

Key Insights
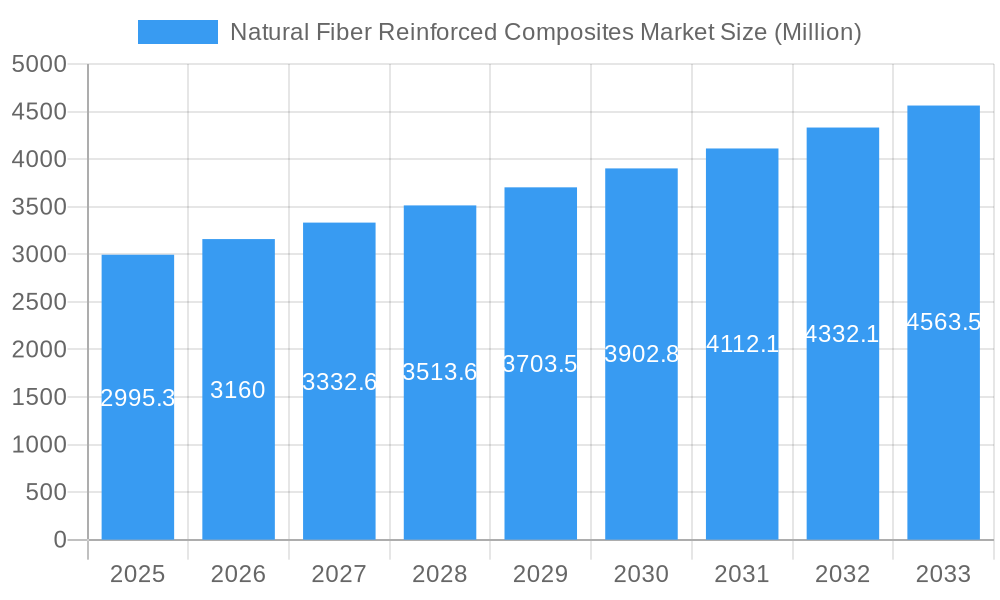
The global Natural Fiber Reinforced Composites (NFRC) market, valued at $2,995.3 million in 2025, is projected to experience robust growth, driven by the increasing demand for sustainable and eco-friendly materials across diverse industries. A Compound Annual Growth Rate (CAGR) of 5.3% from 2025 to 2033 signifies a considerable market expansion, reaching an estimated value exceeding $4,500 million by 2033. Key drivers include the rising awareness of environmental concerns, stringent regulations on the use of synthetic materials, and the inherent advantages of NFRCs, such as their lightweight nature, high strength-to-weight ratio, biodegradability, and cost-effectiveness compared to traditional composites. The automotive and building and construction sectors are major contributors to market growth, fueled by the adoption of NFRCs in lightweight vehicle components and sustainable building materials. Furthermore, the expanding aerospace and marine industries are also contributing to market expansion, driven by the need for lightweight and durable components. Growth is segmented across fiber types (wood and non-wood), polymer types (thermosets and thermoplastics), and end-user industries, offering diverse opportunities for market players. Competition is expected to intensify as established players and new entrants strive for market share. Regional variations will likely persist, with North America and Europe maintaining significant market presence, while Asia Pacific is projected to experience the highest growth rate due to increasing industrialization and rising adoption in emerging economies.

Natural Fiber Reinforced Composites Market Market Size (In Billion)
The competitive landscape includes a mix of large multinational corporations and specialized smaller companies, each with their unique strengths and market focus. Strategic partnerships, collaborations, and technological advancements will play a crucial role in shaping future market dynamics. The market is expected to witness innovations in material processing, composite design, and application expansion, driving further growth. Challenges remain in terms of standardization, scalability of production, and consistent quality control, but ongoing research and development are addressing these limitations. The long-term outlook for the NFRC market remains positive, driven by ongoing technological improvements and a global shift towards sustainable and environmentally responsible material choices. The diverse applications across various end-use sectors ensure sustained demand for this promising composite material in the years to come.
Natural Fiber Reinforced Composites Market Company Market Share
Natural Fiber Reinforced Composites Market: A Comprehensive Market Report (2019-2033)
This comprehensive report offers an in-depth analysis of the Natural Fiber Reinforced Composites market, encompassing market dynamics, growth trends, regional analysis, product landscape, key players, and future outlook. The study period covers 2019-2033, with 2025 as the base year and a forecast period of 2025-2033. The report segments the market by fiber type (Wood Fiber Composites, Non-wood Fiber Composites), polymer type (Thermosets, Thermoplastics), and end-user industry (Aerospace, Automotive, Marine, Building & Construction, Electrical & Electronics, Sports, and Others). The market size is presented in million units.
Natural Fiber Reinforced Composites Market Dynamics & Structure
This section analyzes the competitive landscape, technological advancements, regulatory influences, and market trends shaping the Natural Fiber Reinforced Composites market. The market exhibits a moderately concentrated structure, with key players continuously innovating to enhance product performance and expand their market share. The report quantifies market concentration using Herfindahl-Hirschman Index (HHI) and provides insights into the number and value of M&A deals over the historical period.
- Market Concentration: xx% (estimated)
- Technological Innovation Drivers: Bio-based polymers, improved fiber processing techniques, and advancements in composite manufacturing processes.
- Regulatory Frameworks: Government initiatives promoting sustainable materials and stricter environmental regulations are influencing market growth.
- Competitive Product Substitutes: Traditional materials like steel, aluminum, and plastics pose competition.
- End-User Demographics: Growing construction, automotive, and renewable energy sectors drive demand.
- M&A Trends: xx number of M&A deals were recorded between 2019-2024, primarily driven by strategic expansions and technological acquisitions.
Natural Fiber Reinforced Composites Market Growth Trends & Insights
The Natural Fiber Reinforced Composites market is experiencing robust growth, driven by increasing demand for sustainable and lightweight materials across various industries. This section analyzes the market's size evolution, adoption rates, and technological disruptions, providing detailed insights into CAGR and market penetration. The report utilizes both primary and secondary research to provide robust growth forecasts.
- Market Size (2025): xx Million Units
- CAGR (2025-2033): xx%
- Market Penetration (2025): xx% in key end-user industries.
- Technological Disruptions: 3D printing and automated fiber placement are transforming manufacturing processes.
- Consumer Behavior Shifts: Growing awareness of environmental sustainability is boosting consumer preference for eco-friendly materials.
Dominant Regions, Countries, or Segments in Natural Fiber Reinforced Composites Market
The Building and Construction sector represents the largest end-user segment, driven by the increasing demand for sustainable building materials. Geographically, xx is the leading region, followed by xx and xx. The dominance is attributed to factors like robust infrastructure development, favorable government policies, and high adoption rates.
Leading Segment: Building and Construction (xx Million Units in 2025)
Key Regional Drivers:
- North America: Stringent environmental regulations and growing demand for sustainable construction materials.
- Europe: High adoption of renewable energy technologies and focus on sustainable practices.
- Asia-Pacific: Rapid industrialization and urbanization driving construction activity.
Wood Fiber Composites: Highest market share due to cost-effectiveness and availability of raw materials.
Thermoplastics: Growing preference due to recyclability and ease of processing.
Natural Fiber Reinforced Composites Market Product Landscape
The market offers a diverse range of products with varying fiber types, polymer matrices, and performance characteristics. Innovations focus on enhancing mechanical properties, durability, and cost-effectiveness. Unique selling propositions include lightweight design, sustainability, and recyclability. Recent technological advancements include the development of high-performance bio-based resins and improved fiber treatment methods.
Key Drivers, Barriers & Challenges in Natural Fiber Reinforced Composites Market
Key Drivers:
- Growing demand for sustainable and eco-friendly materials.
- Increasing adoption in the automotive and construction sectors.
- Government initiatives promoting renewable energy and sustainable development.
Challenges:
- Consistency in material properties and performance.
- High initial costs compared to traditional materials.
- Limited availability of high-quality natural fibers in some regions.
- Supply chain disruptions impacting raw material availability.
Emerging Opportunities in Natural Fiber Reinforced Composites Market
- Expanding applications in emerging markets, particularly in the developing economies of Asia and Africa.
- Development of innovative composite structures for advanced applications (e.g., aerospace, wind energy).
- Growing demand for lightweight and high-strength components in electric vehicles.
- Increased focus on recycling and reuse of natural fiber composites.
Growth Accelerators in the Natural Fiber Reinforced Composites Market Industry
Technological advancements, strategic collaborations between material suppliers and manufacturers, and government support for sustainable materials are key growth accelerators. Expansion into new application areas, especially in the renewable energy sector, is expected to further boost market growth.
Key Players Shaping the Natural Fiber Reinforced Composites Market Market
- Beologic
- Amorim Cork Composites SA
- BPREG Composites
- JELU-WERK J Ehrler GmbH & Co KG
- Green Dot Bioplastics
- TECNARO GmbH
- Trex Company Inc
- Fiberon
- UPM
- GreenGran BN
- Wuhu Haoxuan Wood Plastic Composite Co Ltd
- FKuR
- Flexform Technologies
- UFP Technologies Inc
- Oldcastle APG
- The AZEK Company Inc
Notable Milestones in Natural Fiber Reinforced Composites Market Sector
- June 2023: Trex Company introduced Trex Select T-Rail, a wood composite railing system expanding market access.
- February 2023: Trex Company launched Trex Signature Decking, a premium wood composite line enhancing market offerings.
In-Depth Natural Fiber Reinforced Composites Market Market Outlook
The Natural Fiber Reinforced Composites market is poised for significant growth, driven by ongoing technological advancements, increasing environmental concerns, and expanding applications across diverse sectors. Strategic partnerships, investments in R&D, and focus on sustainable manufacturing processes will be crucial for long-term success. The market presents lucrative opportunities for companies focusing on innovation, sustainability, and cost optimization.
Natural Fiber Reinforced Composites Market Segmentation
-
1. Fiber
- 1.1. Wood Fiber Composites
-
1.2. Non-wood Fiber Composites
- 1.2.1. Cotton
- 1.2.2. Flax
- 1.2.3. Kenaf
- 1.2.4. Hemp
- 1.2.5. Other No
-
2. Polymer
- 2.1. Thermosets
-
2.2. Thermoplastics
- 2.2.1. Polyethylene
- 2.2.2. Polypropylene
- 2.2.3. Poly Vinyl Chloride
- 2.2.4. Other Th
-
3. End-user Industry
- 3.1. Aerospace
- 3.2. Automotive
- 3.3. Marine
- 3.4. Building and Construction
- 3.5. Electrical and Electronics
- 3.6. Sports
- 3.7. Other En
Natural Fiber Reinforced Composites Market Segmentation By Geography
-
1. Asia Pacific
- 1.1. China
- 1.2. India
- 1.3. Japan
- 1.4. South Korea
- 1.5. Malaysia
- 1.6. Thailand
- 1.7. Indonesia
- 1.8. Vietnam
- 1.9. Rest of Asia Pacific
-
2. North America
- 2.1. United States
- 2.2. Canada
- 2.3. Mexico
-
3. Europe
- 3.1. Germany
- 3.2. United Kingdom
- 3.3. France
- 3.4. Italy
- 3.5. Spain
- 3.6. Nordic Countries
- 3.7. Turkey
- 3.8. Russia
- 3.9. Rest of Europe
-
4. South America
- 4.1. Brazil
- 4.2. Argentina
- 4.3. Colombia
- 4.4. Rest of South America
-
5. Middle East and Africa
- 5.1. Saudi Arabia
- 5.2. Qatar
- 5.3. United Arab Emirates
- 5.4. Nigeria
- 5.5. Egypt
- 5.6. South Africa
- 5.7. Rest of Middle East and Africa

Natural Fiber Reinforced Composites Market Regional Market Share
Geographic Coverage of Natural Fiber Reinforced Composites Market
Natural Fiber Reinforced Composites Market REPORT HIGHLIGHTS
| Aspects | Details |
|---|---|
| Study Period | 2020-2034 |
| Base Year | 2025 |
| Estimated Year | 2026 |
| Forecast Period | 2026-2034 |
| Historical Period | 2020-2025 |
| Growth Rate | CAGR of 5.3% from 2020-2034 |
| Segmentation |
|
Table of Contents
- 1. Introduction
- 1.1. Research Scope
- 1.2. Market Segmentation
- 1.3. Research Methodology
- 1.4. Definitions and Assumptions
- 2. Executive Summary
- 2.1. Introduction
- 3. Market Dynamics
- 3.1. Introduction
- 3.2. Market Drivers
- 3.2.1. Increasing Demand for Bio-based Composites; Growth in the Automotive Industry Worldwide
- 3.3. Market Restrains
- 3.3.1 Moisture Adsorption
- 3.3.2 Restricted Processing Temperature
- 3.3.3 and Incompatibility with Most of the Polymer Matrices; Degradation Issue Due to Exposure to the External Environment
- 3.4. Market Trends
- 3.4.1. The Construction Industry is Expected to Dominate the Market
- 4. Market Factor Analysis
- 4.1. Porters Five Forces
- 4.2. Supply/Value Chain
- 4.3. PESTEL analysis
- 4.4. Market Entropy
- 4.5. Patent/Trademark Analysis
- 5. Global Natural Fiber Reinforced Composites Market Analysis, Insights and Forecast, 2020-2032
- 5.1. Market Analysis, Insights and Forecast - by Fiber
- 5.1.1. Wood Fiber Composites
- 5.1.2. Non-wood Fiber Composites
- 5.1.2.1. Cotton
- 5.1.2.2. Flax
- 5.1.2.3. Kenaf
- 5.1.2.4. Hemp
- 5.1.2.5. Other No
- 5.2. Market Analysis, Insights and Forecast - by Polymer
- 5.2.1. Thermosets
- 5.2.2. Thermoplastics
- 5.2.2.1. Polyethylene
- 5.2.2.2. Polypropylene
- 5.2.2.3. Poly Vinyl Chloride
- 5.2.2.4. Other Th
- 5.3. Market Analysis, Insights and Forecast - by End-user Industry
- 5.3.1. Aerospace
- 5.3.2. Automotive
- 5.3.3. Marine
- 5.3.4. Building and Construction
- 5.3.5. Electrical and Electronics
- 5.3.6. Sports
- 5.3.7. Other En
- 5.4. Market Analysis, Insights and Forecast - by Region
- 5.4.1. Asia Pacific
- 5.4.2. North America
- 5.4.3. Europe
- 5.4.4. South America
- 5.4.5. Middle East and Africa
- 5.1. Market Analysis, Insights and Forecast - by Fiber
- 6. Asia Pacific Natural Fiber Reinforced Composites Market Analysis, Insights and Forecast, 2020-2032
- 6.1. Market Analysis, Insights and Forecast - by Fiber
- 6.1.1. Wood Fiber Composites
- 6.1.2. Non-wood Fiber Composites
- 6.1.2.1. Cotton
- 6.1.2.2. Flax
- 6.1.2.3. Kenaf
- 6.1.2.4. Hemp
- 6.1.2.5. Other No
- 6.2. Market Analysis, Insights and Forecast - by Polymer
- 6.2.1. Thermosets
- 6.2.2. Thermoplastics
- 6.2.2.1. Polyethylene
- 6.2.2.2. Polypropylene
- 6.2.2.3. Poly Vinyl Chloride
- 6.2.2.4. Other Th
- 6.3. Market Analysis, Insights and Forecast - by End-user Industry
- 6.3.1. Aerospace
- 6.3.2. Automotive
- 6.3.3. Marine
- 6.3.4. Building and Construction
- 6.3.5. Electrical and Electronics
- 6.3.6. Sports
- 6.3.7. Other En
- 6.1. Market Analysis, Insights and Forecast - by Fiber
- 7. North America Natural Fiber Reinforced Composites Market Analysis, Insights and Forecast, 2020-2032
- 7.1. Market Analysis, Insights and Forecast - by Fiber
- 7.1.1. Wood Fiber Composites
- 7.1.2. Non-wood Fiber Composites
- 7.1.2.1. Cotton
- 7.1.2.2. Flax
- 7.1.2.3. Kenaf
- 7.1.2.4. Hemp
- 7.1.2.5. Other No
- 7.2. Market Analysis, Insights and Forecast - by Polymer
- 7.2.1. Thermosets
- 7.2.2. Thermoplastics
- 7.2.2.1. Polyethylene
- 7.2.2.2. Polypropylene
- 7.2.2.3. Poly Vinyl Chloride
- 7.2.2.4. Other Th
- 7.3. Market Analysis, Insights and Forecast - by End-user Industry
- 7.3.1. Aerospace
- 7.3.2. Automotive
- 7.3.3. Marine
- 7.3.4. Building and Construction
- 7.3.5. Electrical and Electronics
- 7.3.6. Sports
- 7.3.7. Other En
- 7.1. Market Analysis, Insights and Forecast - by Fiber
- 8. Europe Natural Fiber Reinforced Composites Market Analysis, Insights and Forecast, 2020-2032
- 8.1. Market Analysis, Insights and Forecast - by Fiber
- 8.1.1. Wood Fiber Composites
- 8.1.2. Non-wood Fiber Composites
- 8.1.2.1. Cotton
- 8.1.2.2. Flax
- 8.1.2.3. Kenaf
- 8.1.2.4. Hemp
- 8.1.2.5. Other No
- 8.2. Market Analysis, Insights and Forecast - by Polymer
- 8.2.1. Thermosets
- 8.2.2. Thermoplastics
- 8.2.2.1. Polyethylene
- 8.2.2.2. Polypropylene
- 8.2.2.3. Poly Vinyl Chloride
- 8.2.2.4. Other Th
- 8.3. Market Analysis, Insights and Forecast - by End-user Industry
- 8.3.1. Aerospace
- 8.3.2. Automotive
- 8.3.3. Marine
- 8.3.4. Building and Construction
- 8.3.5. Electrical and Electronics
- 8.3.6. Sports
- 8.3.7. Other En
- 8.1. Market Analysis, Insights and Forecast - by Fiber
- 9. South America Natural Fiber Reinforced Composites Market Analysis, Insights and Forecast, 2020-2032
- 9.1. Market Analysis, Insights and Forecast - by Fiber
- 9.1.1. Wood Fiber Composites
- 9.1.2. Non-wood Fiber Composites
- 9.1.2.1. Cotton
- 9.1.2.2. Flax
- 9.1.2.3. Kenaf
- 9.1.2.4. Hemp
- 9.1.2.5. Other No
- 9.2. Market Analysis, Insights and Forecast - by Polymer
- 9.2.1. Thermosets
- 9.2.2. Thermoplastics
- 9.2.2.1. Polyethylene
- 9.2.2.2. Polypropylene
- 9.2.2.3. Poly Vinyl Chloride
- 9.2.2.4. Other Th
- 9.3. Market Analysis, Insights and Forecast - by End-user Industry
- 9.3.1. Aerospace
- 9.3.2. Automotive
- 9.3.3. Marine
- 9.3.4. Building and Construction
- 9.3.5. Electrical and Electronics
- 9.3.6. Sports
- 9.3.7. Other En
- 9.1. Market Analysis, Insights and Forecast - by Fiber
- 10. Middle East and Africa Natural Fiber Reinforced Composites Market Analysis, Insights and Forecast, 2020-2032
- 10.1. Market Analysis, Insights and Forecast - by Fiber
- 10.1.1. Wood Fiber Composites
- 10.1.2. Non-wood Fiber Composites
- 10.1.2.1. Cotton
- 10.1.2.2. Flax
- 10.1.2.3. Kenaf
- 10.1.2.4. Hemp
- 10.1.2.5. Other No
- 10.2. Market Analysis, Insights and Forecast - by Polymer
- 10.2.1. Thermosets
- 10.2.2. Thermoplastics
- 10.2.2.1. Polyethylene
- 10.2.2.2. Polypropylene
- 10.2.2.3. Poly Vinyl Chloride
- 10.2.2.4. Other Th
- 10.3. Market Analysis, Insights and Forecast - by End-user Industry
- 10.3.1. Aerospace
- 10.3.2. Automotive
- 10.3.3. Marine
- 10.3.4. Building and Construction
- 10.3.5. Electrical and Electronics
- 10.3.6. Sports
- 10.3.7. Other En
- 10.1. Market Analysis, Insights and Forecast - by Fiber
- 11. Competitive Analysis
- 11.1. Global Market Share Analysis 2025
- 11.2. Company Profiles
- 11.2.1 Beologic
- 11.2.1.1. Overview
- 11.2.1.2. Products
- 11.2.1.3. SWOT Analysis
- 11.2.1.4. Recent Developments
- 11.2.1.5. Financials (Based on Availability)
- 11.2.2 Amorim Cork Composites SA
- 11.2.2.1. Overview
- 11.2.2.2. Products
- 11.2.2.3. SWOT Analysis
- 11.2.2.4. Recent Developments
- 11.2.2.5. Financials (Based on Availability)
- 11.2.3 BPREG Composites
- 11.2.3.1. Overview
- 11.2.3.2. Products
- 11.2.3.3. SWOT Analysis
- 11.2.3.4. Recent Developments
- 11.2.3.5. Financials (Based on Availability)
- 11.2.4 JELU-WERK J Ehrler GmbH & Co KG
- 11.2.4.1. Overview
- 11.2.4.2. Products
- 11.2.4.3. SWOT Analysis
- 11.2.4.4. Recent Developments
- 11.2.4.5. Financials (Based on Availability)
- 11.2.5 Green Dot Bioplastics
- 11.2.5.1. Overview
- 11.2.5.2. Products
- 11.2.5.3. SWOT Analysis
- 11.2.5.4. Recent Developments
- 11.2.5.5. Financials (Based on Availability)
- 11.2.6 TECNARO GmbH
- 11.2.6.1. Overview
- 11.2.6.2. Products
- 11.2.6.3. SWOT Analysis
- 11.2.6.4. Recent Developments
- 11.2.6.5. Financials (Based on Availability)
- 11.2.7 Trex Company Inc
- 11.2.7.1. Overview
- 11.2.7.2. Products
- 11.2.7.3. SWOT Analysis
- 11.2.7.4. Recent Developments
- 11.2.7.5. Financials (Based on Availability)
- 11.2.8 Fiberon
- 11.2.8.1. Overview
- 11.2.8.2. Products
- 11.2.8.3. SWOT Analysis
- 11.2.8.4. Recent Developments
- 11.2.8.5. Financials (Based on Availability)
- 11.2.9 UPM
- 11.2.9.1. Overview
- 11.2.9.2. Products
- 11.2.9.3. SWOT Analysis
- 11.2.9.4. Recent Developments
- 11.2.9.5. Financials (Based on Availability)
- 11.2.10 GreenGran BN
- 11.2.10.1. Overview
- 11.2.10.2. Products
- 11.2.10.3. SWOT Analysis
- 11.2.10.4. Recent Developments
- 11.2.10.5. Financials (Based on Availability)
- 11.2.11 Wuhu Haoxuan Wood Plastic Composite Co Ltd
- 11.2.11.1. Overview
- 11.2.11.2. Products
- 11.2.11.3. SWOT Analysis
- 11.2.11.4. Recent Developments
- 11.2.11.5. Financials (Based on Availability)
- 11.2.12 FKuR
- 11.2.12.1. Overview
- 11.2.12.2. Products
- 11.2.12.3. SWOT Analysis
- 11.2.12.4. Recent Developments
- 11.2.12.5. Financials (Based on Availability)
- 11.2.13 Flexform Technologies
- 11.2.13.1. Overview
- 11.2.13.2. Products
- 11.2.13.3. SWOT Analysis
- 11.2.13.4. Recent Developments
- 11.2.13.5. Financials (Based on Availability)
- 11.2.14 UFP Technologies Inc
- 11.2.14.1. Overview
- 11.2.14.2. Products
- 11.2.14.3. SWOT Analysis
- 11.2.14.4. Recent Developments
- 11.2.14.5. Financials (Based on Availability)
- 11.2.15 Oldcastle APG
- 11.2.15.1. Overview
- 11.2.15.2. Products
- 11.2.15.3. SWOT Analysis
- 11.2.15.4. Recent Developments
- 11.2.15.5. Financials (Based on Availability)
- 11.2.16 The AZEK Company Inc
- 11.2.16.1. Overview
- 11.2.16.2. Products
- 11.2.16.3. SWOT Analysis
- 11.2.16.4. Recent Developments
- 11.2.16.5. Financials (Based on Availability)
- 11.2.1 Beologic
List of Figures
- Figure 1: Global Natural Fiber Reinforced Composites Market Revenue Breakdown (Million, %) by Region 2025 & 2033
- Figure 2: Global Natural Fiber Reinforced Composites Market Volume Breakdown (K Tons, %) by Region 2025 & 2033
- Figure 3: Asia Pacific Natural Fiber Reinforced Composites Market Revenue (Million), by Fiber 2025 & 2033
- Figure 4: Asia Pacific Natural Fiber Reinforced Composites Market Volume (K Tons), by Fiber 2025 & 2033
- Figure 5: Asia Pacific Natural Fiber Reinforced Composites Market Revenue Share (%), by Fiber 2025 & 2033
- Figure 6: Asia Pacific Natural Fiber Reinforced Composites Market Volume Share (%), by Fiber 2025 & 2033
- Figure 7: Asia Pacific Natural Fiber Reinforced Composites Market Revenue (Million), by Polymer 2025 & 2033
- Figure 8: Asia Pacific Natural Fiber Reinforced Composites Market Volume (K Tons), by Polymer 2025 & 2033
- Figure 9: Asia Pacific Natural Fiber Reinforced Composites Market Revenue Share (%), by Polymer 2025 & 2033
- Figure 10: Asia Pacific Natural Fiber Reinforced Composites Market Volume Share (%), by Polymer 2025 & 2033
- Figure 11: Asia Pacific Natural Fiber Reinforced Composites Market Revenue (Million), by End-user Industry 2025 & 2033
- Figure 12: Asia Pacific Natural Fiber Reinforced Composites Market Volume (K Tons), by End-user Industry 2025 & 2033
- Figure 13: Asia Pacific Natural Fiber Reinforced Composites Market Revenue Share (%), by End-user Industry 2025 & 2033
- Figure 14: Asia Pacific Natural Fiber Reinforced Composites Market Volume Share (%), by End-user Industry 2025 & 2033
- Figure 15: Asia Pacific Natural Fiber Reinforced Composites Market Revenue (Million), by Country 2025 & 2033
- Figure 16: Asia Pacific Natural Fiber Reinforced Composites Market Volume (K Tons), by Country 2025 & 2033
- Figure 17: Asia Pacific Natural Fiber Reinforced Composites Market Revenue Share (%), by Country 2025 & 2033
- Figure 18: Asia Pacific Natural Fiber Reinforced Composites Market Volume Share (%), by Country 2025 & 2033
- Figure 19: North America Natural Fiber Reinforced Composites Market Revenue (Million), by Fiber 2025 & 2033
- Figure 20: North America Natural Fiber Reinforced Composites Market Volume (K Tons), by Fiber 2025 & 2033
- Figure 21: North America Natural Fiber Reinforced Composites Market Revenue Share (%), by Fiber 2025 & 2033
- Figure 22: North America Natural Fiber Reinforced Composites Market Volume Share (%), by Fiber 2025 & 2033
- Figure 23: North America Natural Fiber Reinforced Composites Market Revenue (Million), by Polymer 2025 & 2033
- Figure 24: North America Natural Fiber Reinforced Composites Market Volume (K Tons), by Polymer 2025 & 2033
- Figure 25: North America Natural Fiber Reinforced Composites Market Revenue Share (%), by Polymer 2025 & 2033
- Figure 26: North America Natural Fiber Reinforced Composites Market Volume Share (%), by Polymer 2025 & 2033
- Figure 27: North America Natural Fiber Reinforced Composites Market Revenue (Million), by End-user Industry 2025 & 2033
- Figure 28: North America Natural Fiber Reinforced Composites Market Volume (K Tons), by End-user Industry 2025 & 2033
- Figure 29: North America Natural Fiber Reinforced Composites Market Revenue Share (%), by End-user Industry 2025 & 2033
- Figure 30: North America Natural Fiber Reinforced Composites Market Volume Share (%), by End-user Industry 2025 & 2033
- Figure 31: North America Natural Fiber Reinforced Composites Market Revenue (Million), by Country 2025 & 2033
- Figure 32: North America Natural Fiber Reinforced Composites Market Volume (K Tons), by Country 2025 & 2033
- Figure 33: North America Natural Fiber Reinforced Composites Market Revenue Share (%), by Country 2025 & 2033
- Figure 34: North America Natural Fiber Reinforced Composites Market Volume Share (%), by Country 2025 & 2033
- Figure 35: Europe Natural Fiber Reinforced Composites Market Revenue (Million), by Fiber 2025 & 2033
- Figure 36: Europe Natural Fiber Reinforced Composites Market Volume (K Tons), by Fiber 2025 & 2033
- Figure 37: Europe Natural Fiber Reinforced Composites Market Revenue Share (%), by Fiber 2025 & 2033
- Figure 38: Europe Natural Fiber Reinforced Composites Market Volume Share (%), by Fiber 2025 & 2033
- Figure 39: Europe Natural Fiber Reinforced Composites Market Revenue (Million), by Polymer 2025 & 2033
- Figure 40: Europe Natural Fiber Reinforced Composites Market Volume (K Tons), by Polymer 2025 & 2033
- Figure 41: Europe Natural Fiber Reinforced Composites Market Revenue Share (%), by Polymer 2025 & 2033
- Figure 42: Europe Natural Fiber Reinforced Composites Market Volume Share (%), by Polymer 2025 & 2033
- Figure 43: Europe Natural Fiber Reinforced Composites Market Revenue (Million), by End-user Industry 2025 & 2033
- Figure 44: Europe Natural Fiber Reinforced Composites Market Volume (K Tons), by End-user Industry 2025 & 2033
- Figure 45: Europe Natural Fiber Reinforced Composites Market Revenue Share (%), by End-user Industry 2025 & 2033
- Figure 46: Europe Natural Fiber Reinforced Composites Market Volume Share (%), by End-user Industry 2025 & 2033
- Figure 47: Europe Natural Fiber Reinforced Composites Market Revenue (Million), by Country 2025 & 2033
- Figure 48: Europe Natural Fiber Reinforced Composites Market Volume (K Tons), by Country 2025 & 2033
- Figure 49: Europe Natural Fiber Reinforced Composites Market Revenue Share (%), by Country 2025 & 2033
- Figure 50: Europe Natural Fiber Reinforced Composites Market Volume Share (%), by Country 2025 & 2033
- Figure 51: South America Natural Fiber Reinforced Composites Market Revenue (Million), by Fiber 2025 & 2033
- Figure 52: South America Natural Fiber Reinforced Composites Market Volume (K Tons), by Fiber 2025 & 2033
- Figure 53: South America Natural Fiber Reinforced Composites Market Revenue Share (%), by Fiber 2025 & 2033
- Figure 54: South America Natural Fiber Reinforced Composites Market Volume Share (%), by Fiber 2025 & 2033
- Figure 55: South America Natural Fiber Reinforced Composites Market Revenue (Million), by Polymer 2025 & 2033
- Figure 56: South America Natural Fiber Reinforced Composites Market Volume (K Tons), by Polymer 2025 & 2033
- Figure 57: South America Natural Fiber Reinforced Composites Market Revenue Share (%), by Polymer 2025 & 2033
- Figure 58: South America Natural Fiber Reinforced Composites Market Volume Share (%), by Polymer 2025 & 2033
- Figure 59: South America Natural Fiber Reinforced Composites Market Revenue (Million), by End-user Industry 2025 & 2033
- Figure 60: South America Natural Fiber Reinforced Composites Market Volume (K Tons), by End-user Industry 2025 & 2033
- Figure 61: South America Natural Fiber Reinforced Composites Market Revenue Share (%), by End-user Industry 2025 & 2033
- Figure 62: South America Natural Fiber Reinforced Composites Market Volume Share (%), by End-user Industry 2025 & 2033
- Figure 63: South America Natural Fiber Reinforced Composites Market Revenue (Million), by Country 2025 & 2033
- Figure 64: South America Natural Fiber Reinforced Composites Market Volume (K Tons), by Country 2025 & 2033
- Figure 65: South America Natural Fiber Reinforced Composites Market Revenue Share (%), by Country 2025 & 2033
- Figure 66: South America Natural Fiber Reinforced Composites Market Volume Share (%), by Country 2025 & 2033
- Figure 67: Middle East and Africa Natural Fiber Reinforced Composites Market Revenue (Million), by Fiber 2025 & 2033
- Figure 68: Middle East and Africa Natural Fiber Reinforced Composites Market Volume (K Tons), by Fiber 2025 & 2033
- Figure 69: Middle East and Africa Natural Fiber Reinforced Composites Market Revenue Share (%), by Fiber 2025 & 2033
- Figure 70: Middle East and Africa Natural Fiber Reinforced Composites Market Volume Share (%), by Fiber 2025 & 2033
- Figure 71: Middle East and Africa Natural Fiber Reinforced Composites Market Revenue (Million), by Polymer 2025 & 2033
- Figure 72: Middle East and Africa Natural Fiber Reinforced Composites Market Volume (K Tons), by Polymer 2025 & 2033
- Figure 73: Middle East and Africa Natural Fiber Reinforced Composites Market Revenue Share (%), by Polymer 2025 & 2033
- Figure 74: Middle East and Africa Natural Fiber Reinforced Composites Market Volume Share (%), by Polymer 2025 & 2033
- Figure 75: Middle East and Africa Natural Fiber Reinforced Composites Market Revenue (Million), by End-user Industry 2025 & 2033
- Figure 76: Middle East and Africa Natural Fiber Reinforced Composites Market Volume (K Tons), by End-user Industry 2025 & 2033
- Figure 77: Middle East and Africa Natural Fiber Reinforced Composites Market Revenue Share (%), by End-user Industry 2025 & 2033
- Figure 78: Middle East and Africa Natural Fiber Reinforced Composites Market Volume Share (%), by End-user Industry 2025 & 2033
- Figure 79: Middle East and Africa Natural Fiber Reinforced Composites Market Revenue (Million), by Country 2025 & 2033
- Figure 80: Middle East and Africa Natural Fiber Reinforced Composites Market Volume (K Tons), by Country 2025 & 2033
- Figure 81: Middle East and Africa Natural Fiber Reinforced Composites Market Revenue Share (%), by Country 2025 & 2033
- Figure 82: Middle East and Africa Natural Fiber Reinforced Composites Market Volume Share (%), by Country 2025 & 2033
List of Tables
- Table 1: Global Natural Fiber Reinforced Composites Market Revenue Million Forecast, by Fiber 2020 & 2033
- Table 2: Global Natural Fiber Reinforced Composites Market Volume K Tons Forecast, by Fiber 2020 & 2033
- Table 3: Global Natural Fiber Reinforced Composites Market Revenue Million Forecast, by Polymer 2020 & 2033
- Table 4: Global Natural Fiber Reinforced Composites Market Volume K Tons Forecast, by Polymer 2020 & 2033
- Table 5: Global Natural Fiber Reinforced Composites Market Revenue Million Forecast, by End-user Industry 2020 & 2033
- Table 6: Global Natural Fiber Reinforced Composites Market Volume K Tons Forecast, by End-user Industry 2020 & 2033
- Table 7: Global Natural Fiber Reinforced Composites Market Revenue Million Forecast, by Region 2020 & 2033
- Table 8: Global Natural Fiber Reinforced Composites Market Volume K Tons Forecast, by Region 2020 & 2033
- Table 9: Global Natural Fiber Reinforced Composites Market Revenue Million Forecast, by Fiber 2020 & 2033
- Table 10: Global Natural Fiber Reinforced Composites Market Volume K Tons Forecast, by Fiber 2020 & 2033
- Table 11: Global Natural Fiber Reinforced Composites Market Revenue Million Forecast, by Polymer 2020 & 2033
- Table 12: Global Natural Fiber Reinforced Composites Market Volume K Tons Forecast, by Polymer 2020 & 2033
- Table 13: Global Natural Fiber Reinforced Composites Market Revenue Million Forecast, by End-user Industry 2020 & 2033
- Table 14: Global Natural Fiber Reinforced Composites Market Volume K Tons Forecast, by End-user Industry 2020 & 2033
- Table 15: Global Natural Fiber Reinforced Composites Market Revenue Million Forecast, by Country 2020 & 2033
- Table 16: Global Natural Fiber Reinforced Composites Market Volume K Tons Forecast, by Country 2020 & 2033
- Table 17: China Natural Fiber Reinforced Composites Market Revenue (Million) Forecast, by Application 2020 & 2033
- Table 18: China Natural Fiber Reinforced Composites Market Volume (K Tons) Forecast, by Application 2020 & 2033
- Table 19: India Natural Fiber Reinforced Composites Market Revenue (Million) Forecast, by Application 2020 & 2033
- Table 20: India Natural Fiber Reinforced Composites Market Volume (K Tons) Forecast, by Application 2020 & 2033
- Table 21: Japan Natural Fiber Reinforced Composites Market Revenue (Million) Forecast, by Application 2020 & 2033
- Table 22: Japan Natural Fiber Reinforced Composites Market Volume (K Tons) Forecast, by Application 2020 & 2033
- Table 23: South Korea Natural Fiber Reinforced Composites Market Revenue (Million) Forecast, by Application 2020 & 2033
- Table 24: South Korea Natural Fiber Reinforced Composites Market Volume (K Tons) Forecast, by Application 2020 & 2033
- Table 25: Malaysia Natural Fiber Reinforced Composites Market Revenue (Million) Forecast, by Application 2020 & 2033
- Table 26: Malaysia Natural Fiber Reinforced Composites Market Volume (K Tons) Forecast, by Application 2020 & 2033
- Table 27: Thailand Natural Fiber Reinforced Composites Market Revenue (Million) Forecast, by Application 2020 & 2033
- Table 28: Thailand Natural Fiber Reinforced Composites Market Volume (K Tons) Forecast, by Application 2020 & 2033
- Table 29: Indonesia Natural Fiber Reinforced Composites Market Revenue (Million) Forecast, by Application 2020 & 2033
- Table 30: Indonesia Natural Fiber Reinforced Composites Market Volume (K Tons) Forecast, by Application 2020 & 2033
- Table 31: Vietnam Natural Fiber Reinforced Composites Market Revenue (Million) Forecast, by Application 2020 & 2033
- Table 32: Vietnam Natural Fiber Reinforced Composites Market Volume (K Tons) Forecast, by Application 2020 & 2033
- Table 33: Rest of Asia Pacific Natural Fiber Reinforced Composites Market Revenue (Million) Forecast, by Application 2020 & 2033
- Table 34: Rest of Asia Pacific Natural Fiber Reinforced Composites Market Volume (K Tons) Forecast, by Application 2020 & 2033
- Table 35: Global Natural Fiber Reinforced Composites Market Revenue Million Forecast, by Fiber 2020 & 2033
- Table 36: Global Natural Fiber Reinforced Composites Market Volume K Tons Forecast, by Fiber 2020 & 2033
- Table 37: Global Natural Fiber Reinforced Composites Market Revenue Million Forecast, by Polymer 2020 & 2033
- Table 38: Global Natural Fiber Reinforced Composites Market Volume K Tons Forecast, by Polymer 2020 & 2033
- Table 39: Global Natural Fiber Reinforced Composites Market Revenue Million Forecast, by End-user Industry 2020 & 2033
- Table 40: Global Natural Fiber Reinforced Composites Market Volume K Tons Forecast, by End-user Industry 2020 & 2033
- Table 41: Global Natural Fiber Reinforced Composites Market Revenue Million Forecast, by Country 2020 & 2033
- Table 42: Global Natural Fiber Reinforced Composites Market Volume K Tons Forecast, by Country 2020 & 2033
- Table 43: United States Natural Fiber Reinforced Composites Market Revenue (Million) Forecast, by Application 2020 & 2033
- Table 44: United States Natural Fiber Reinforced Composites Market Volume (K Tons) Forecast, by Application 2020 & 2033
- Table 45: Canada Natural Fiber Reinforced Composites Market Revenue (Million) Forecast, by Application 2020 & 2033
- Table 46: Canada Natural Fiber Reinforced Composites Market Volume (K Tons) Forecast, by Application 2020 & 2033
- Table 47: Mexico Natural Fiber Reinforced Composites Market Revenue (Million) Forecast, by Application 2020 & 2033
- Table 48: Mexico Natural Fiber Reinforced Composites Market Volume (K Tons) Forecast, by Application 2020 & 2033
- Table 49: Global Natural Fiber Reinforced Composites Market Revenue Million Forecast, by Fiber 2020 & 2033
- Table 50: Global Natural Fiber Reinforced Composites Market Volume K Tons Forecast, by Fiber 2020 & 2033
- Table 51: Global Natural Fiber Reinforced Composites Market Revenue Million Forecast, by Polymer 2020 & 2033
- Table 52: Global Natural Fiber Reinforced Composites Market Volume K Tons Forecast, by Polymer 2020 & 2033
- Table 53: Global Natural Fiber Reinforced Composites Market Revenue Million Forecast, by End-user Industry 2020 & 2033
- Table 54: Global Natural Fiber Reinforced Composites Market Volume K Tons Forecast, by End-user Industry 2020 & 2033
- Table 55: Global Natural Fiber Reinforced Composites Market Revenue Million Forecast, by Country 2020 & 2033
- Table 56: Global Natural Fiber Reinforced Composites Market Volume K Tons Forecast, by Country 2020 & 2033
- Table 57: Germany Natural Fiber Reinforced Composites Market Revenue (Million) Forecast, by Application 2020 & 2033
- Table 58: Germany Natural Fiber Reinforced Composites Market Volume (K Tons) Forecast, by Application 2020 & 2033
- Table 59: United Kingdom Natural Fiber Reinforced Composites Market Revenue (Million) Forecast, by Application 2020 & 2033
- Table 60: United Kingdom Natural Fiber Reinforced Composites Market Volume (K Tons) Forecast, by Application 2020 & 2033
- Table 61: France Natural Fiber Reinforced Composites Market Revenue (Million) Forecast, by Application 2020 & 2033
- Table 62: France Natural Fiber Reinforced Composites Market Volume (K Tons) Forecast, by Application 2020 & 2033
- Table 63: Italy Natural Fiber Reinforced Composites Market Revenue (Million) Forecast, by Application 2020 & 2033
- Table 64: Italy Natural Fiber Reinforced Composites Market Volume (K Tons) Forecast, by Application 2020 & 2033
- Table 65: Spain Natural Fiber Reinforced Composites Market Revenue (Million) Forecast, by Application 2020 & 2033
- Table 66: Spain Natural Fiber Reinforced Composites Market Volume (K Tons) Forecast, by Application 2020 & 2033
- Table 67: Nordic Countries Natural Fiber Reinforced Composites Market Revenue (Million) Forecast, by Application 2020 & 2033
- Table 68: Nordic Countries Natural Fiber Reinforced Composites Market Volume (K Tons) Forecast, by Application 2020 & 2033
- Table 69: Turkey Natural Fiber Reinforced Composites Market Revenue (Million) Forecast, by Application 2020 & 2033
- Table 70: Turkey Natural Fiber Reinforced Composites Market Volume (K Tons) Forecast, by Application 2020 & 2033
- Table 71: Russia Natural Fiber Reinforced Composites Market Revenue (Million) Forecast, by Application 2020 & 2033
- Table 72: Russia Natural Fiber Reinforced Composites Market Volume (K Tons) Forecast, by Application 2020 & 2033
- Table 73: Rest of Europe Natural Fiber Reinforced Composites Market Revenue (Million) Forecast, by Application 2020 & 2033
- Table 74: Rest of Europe Natural Fiber Reinforced Composites Market Volume (K Tons) Forecast, by Application 2020 & 2033
- Table 75: Global Natural Fiber Reinforced Composites Market Revenue Million Forecast, by Fiber 2020 & 2033
- Table 76: Global Natural Fiber Reinforced Composites Market Volume K Tons Forecast, by Fiber 2020 & 2033
- Table 77: Global Natural Fiber Reinforced Composites Market Revenue Million Forecast, by Polymer 2020 & 2033
- Table 78: Global Natural Fiber Reinforced Composites Market Volume K Tons Forecast, by Polymer 2020 & 2033
- Table 79: Global Natural Fiber Reinforced Composites Market Revenue Million Forecast, by End-user Industry 2020 & 2033
- Table 80: Global Natural Fiber Reinforced Composites Market Volume K Tons Forecast, by End-user Industry 2020 & 2033
- Table 81: Global Natural Fiber Reinforced Composites Market Revenue Million Forecast, by Country 2020 & 2033
- Table 82: Global Natural Fiber Reinforced Composites Market Volume K Tons Forecast, by Country 2020 & 2033
- Table 83: Brazil Natural Fiber Reinforced Composites Market Revenue (Million) Forecast, by Application 2020 & 2033
- Table 84: Brazil Natural Fiber Reinforced Composites Market Volume (K Tons) Forecast, by Application 2020 & 2033
- Table 85: Argentina Natural Fiber Reinforced Composites Market Revenue (Million) Forecast, by Application 2020 & 2033
- Table 86: Argentina Natural Fiber Reinforced Composites Market Volume (K Tons) Forecast, by Application 2020 & 2033
- Table 87: Colombia Natural Fiber Reinforced Composites Market Revenue (Million) Forecast, by Application 2020 & 2033
- Table 88: Colombia Natural Fiber Reinforced Composites Market Volume (K Tons) Forecast, by Application 2020 & 2033
- Table 89: Rest of South America Natural Fiber Reinforced Composites Market Revenue (Million) Forecast, by Application 2020 & 2033
- Table 90: Rest of South America Natural Fiber Reinforced Composites Market Volume (K Tons) Forecast, by Application 2020 & 2033
- Table 91: Global Natural Fiber Reinforced Composites Market Revenue Million Forecast, by Fiber 2020 & 2033
- Table 92: Global Natural Fiber Reinforced Composites Market Volume K Tons Forecast, by Fiber 2020 & 2033
- Table 93: Global Natural Fiber Reinforced Composites Market Revenue Million Forecast, by Polymer 2020 & 2033
- Table 94: Global Natural Fiber Reinforced Composites Market Volume K Tons Forecast, by Polymer 2020 & 2033
- Table 95: Global Natural Fiber Reinforced Composites Market Revenue Million Forecast, by End-user Industry 2020 & 2033
- Table 96: Global Natural Fiber Reinforced Composites Market Volume K Tons Forecast, by End-user Industry 2020 & 2033
- Table 97: Global Natural Fiber Reinforced Composites Market Revenue Million Forecast, by Country 2020 & 2033
- Table 98: Global Natural Fiber Reinforced Composites Market Volume K Tons Forecast, by Country 2020 & 2033
- Table 99: Saudi Arabia Natural Fiber Reinforced Composites Market Revenue (Million) Forecast, by Application 2020 & 2033
- Table 100: Saudi Arabia Natural Fiber Reinforced Composites Market Volume (K Tons) Forecast, by Application 2020 & 2033
- Table 101: Qatar Natural Fiber Reinforced Composites Market Revenue (Million) Forecast, by Application 2020 & 2033
- Table 102: Qatar Natural Fiber Reinforced Composites Market Volume (K Tons) Forecast, by Application 2020 & 2033
- Table 103: United Arab Emirates Natural Fiber Reinforced Composites Market Revenue (Million) Forecast, by Application 2020 & 2033
- Table 104: United Arab Emirates Natural Fiber Reinforced Composites Market Volume (K Tons) Forecast, by Application 2020 & 2033
- Table 105: Nigeria Natural Fiber Reinforced Composites Market Revenue (Million) Forecast, by Application 2020 & 2033
- Table 106: Nigeria Natural Fiber Reinforced Composites Market Volume (K Tons) Forecast, by Application 2020 & 2033
- Table 107: Egypt Natural Fiber Reinforced Composites Market Revenue (Million) Forecast, by Application 2020 & 2033
- Table 108: Egypt Natural Fiber Reinforced Composites Market Volume (K Tons) Forecast, by Application 2020 & 2033
- Table 109: South Africa Natural Fiber Reinforced Composites Market Revenue (Million) Forecast, by Application 2020 & 2033
- Table 110: South Africa Natural Fiber Reinforced Composites Market Volume (K Tons) Forecast, by Application 2020 & 2033
- Table 111: Rest of Middle East and Africa Natural Fiber Reinforced Composites Market Revenue (Million) Forecast, by Application 2020 & 2033
- Table 112: Rest of Middle East and Africa Natural Fiber Reinforced Composites Market Volume (K Tons) Forecast, by Application 2020 & 2033
Frequently Asked Questions
1. What is the projected Compound Annual Growth Rate (CAGR) of the Natural Fiber Reinforced Composites Market?
The projected CAGR is approximately 5.3%.
2. Which companies are prominent players in the Natural Fiber Reinforced Composites Market?
Key companies in the market include Beologic, Amorim Cork Composites SA, BPREG Composites, JELU-WERK J Ehrler GmbH & Co KG, Green Dot Bioplastics, TECNARO GmbH, Trex Company Inc, Fiberon, UPM, GreenGran BN, Wuhu Haoxuan Wood Plastic Composite Co Ltd, FKuR, Flexform Technologies, UFP Technologies Inc, Oldcastle APG, The AZEK Company Inc.
3. What are the main segments of the Natural Fiber Reinforced Composites Market?
The market segments include Fiber, Polymer, End-user Industry.
4. Can you provide details about the market size?
The market size is estimated to be USD 2,995.3 Million as of 2022.
5. What are some drivers contributing to market growth?
Increasing Demand for Bio-based Composites; Growth in the Automotive Industry Worldwide.
6. What are the notable trends driving market growth?
The Construction Industry is Expected to Dominate the Market.
7. Are there any restraints impacting market growth?
Moisture Adsorption. Restricted Processing Temperature. and Incompatibility with Most of the Polymer Matrices; Degradation Issue Due to Exposure to the External Environment.
8. Can you provide examples of recent developments in the market?
June 2023: Trex Company introduced Trex Select T-Rail. The wood composite railing system, which includes a popular T-shaped top rail, is intended to make the beauty and convenience of Trex's high-performance wood composite railing available to a wider audience at prices that compete head-to-head with PVC vinyl railing.
9. What pricing options are available for accessing the report?
Pricing options include single-user, multi-user, and enterprise licenses priced at USD 4750, USD 5250, and USD 8750 respectively.
10. Is the market size provided in terms of value or volume?
The market size is provided in terms of value, measured in Million and volume, measured in K Tons.
11. Are there any specific market keywords associated with the report?
Yes, the market keyword associated with the report is "Natural Fiber Reinforced Composites Market," which aids in identifying and referencing the specific market segment covered.
12. How do I determine which pricing option suits my needs best?
The pricing options vary based on user requirements and access needs. Individual users may opt for single-user licenses, while businesses requiring broader access may choose multi-user or enterprise licenses for cost-effective access to the report.
13. Are there any additional resources or data provided in the Natural Fiber Reinforced Composites Market report?
While the report offers comprehensive insights, it's advisable to review the specific contents or supplementary materials provided to ascertain if additional resources or data are available.
14. How can I stay updated on further developments or reports in the Natural Fiber Reinforced Composites Market?
To stay informed about further developments, trends, and reports in the Natural Fiber Reinforced Composites Market, consider subscribing to industry newsletters, following relevant companies and organizations, or regularly checking reputable industry news sources and publications.
Methodology
Step 1 - Identification of Relevant Samples Size from Population Database


Step 2 - Approaches for Defining Global Market Size (Value, Volume* & Price*)

Note*: In applicable scenarios
Step 3 - Data Sources
Primary Research
- Web Analytics
- Survey Reports
- Research Institute
- Latest Research Reports
- Opinion Leaders
Secondary Research
- Annual Reports
- White Paper
- Latest Press Release
- Industry Association
- Paid Database
- Investor Presentations

Step 4 - Data Triangulation
Involves using different sources of information in order to increase the validity of a study
These sources are likely to be stakeholders in a program - participants, other researchers, program staff, other community members, and so on.
Then we put all data in single framework & apply various statistical tools to find out the dynamic on the market.
During the analysis stage, feedback from the stakeholder groups would be compared to determine areas of agreement as well as areas of divergence