
Key Insights
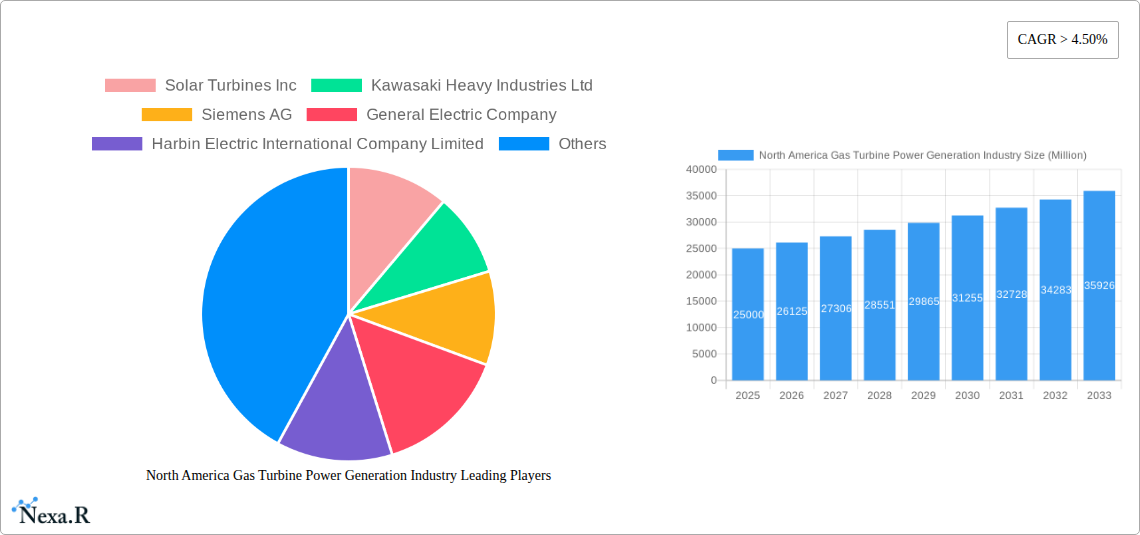
The North American gas turbine power generation market is poised for significant expansion, driven by escalating electricity requirements, the imperative to modernize aging energy infrastructure, and the global shift towards sustainable energy solutions. Emphasis is increasingly placed on highly efficient combined-cycle gas turbines (CCGTs) over open-cycle systems, due to their superior thermal efficiency and reduced environmental impact. This trend is further propelled by governmental initiatives focused on carbon footprint reduction and air quality enhancement. The market is segmented by strong demand across diverse end-user segments, with the power sector leading, followed by oil and gas, and other industrial applications. Larger capacity turbines (31 MW and above) are preferred, reflecting the cost-effectiveness of centralized power generation. Leading industry players, including General Electric, Siemens, and Mitsubishi Heavy Industries, are engaged in competitive strategies, investing in innovation and strategic alliances to solidify their market positions. The projected market size is $22.6 billion by 2033, with a compound annual growth rate (CAGR) of 11.2% from the base year 2025.
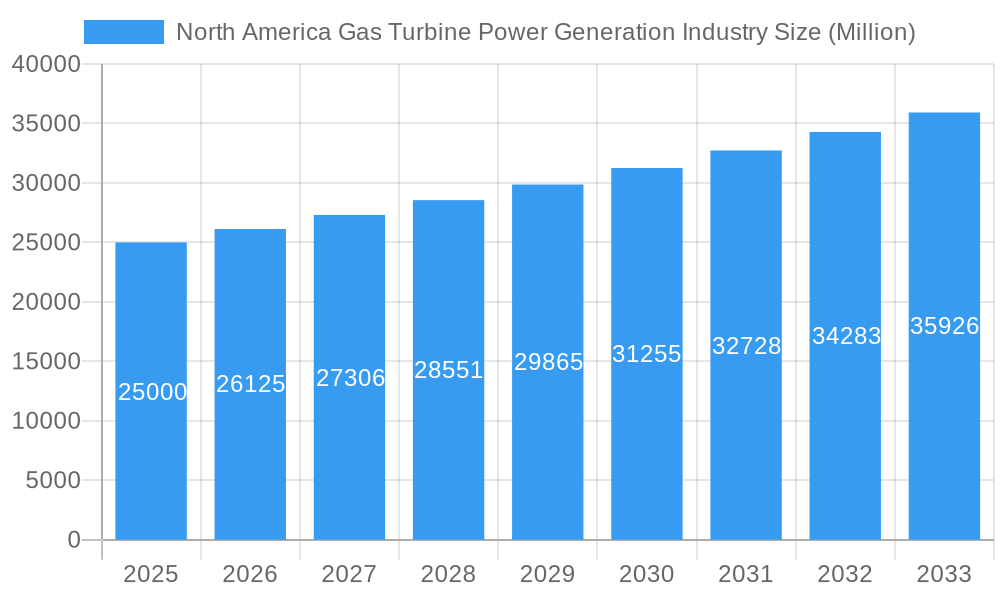
North America Gas Turbine Power Generation Industry Market Size (In Billion)
Key drivers shaping the market's growth include the complementary role of gas turbines in supporting the integration of renewable energy sources by providing flexible and reliable backup power. Technological advancements are continually enhancing turbine efficiency and minimizing emissions, thereby boosting market appeal. However, market growth may be tempered by fluctuations in natural gas prices and the growing competitiveness of alternative power generation technologies like solar and wind. Despite these challenges, the North American gas turbine power generation market exhibits a robust positive outlook, anticipating sustained growth fueled by supportive regulatory frameworks, rising energy demand, and ongoing technological progress. The strategic adoption of CCGTs, combined with the established market presence and expertise of key manufacturers, ensures continued industry advancement.
North America Gas Turbine Power Generation Industry Company Market Share
North America Gas Turbine Power Generation Industry: Market Report 2019-2033
This comprehensive report provides a detailed analysis of the North America gas turbine power generation industry, covering the period from 2019 to 2033. It examines market dynamics, growth trends, dominant segments, and key players, offering valuable insights for industry professionals, investors, and strategic decision-makers. The report leverages extensive data analysis and expert insights to deliver a clear understanding of this dynamic market.
North America Gas Turbine Power Generation Industry Market Dynamics & Structure
The North American gas turbine power generation market is characterized by moderate concentration, with a few major players holding significant market share. The market is driven by technological advancements, increasing energy demands, and regulatory pressures towards cleaner energy sources. However, the industry faces challenges from renewable energy competition and fluctuating fuel prices. Mergers and acquisitions (M&A) activity has been moderate in recent years, with strategic alliances focusing on technological advancements and geographic expansion.
Market Structure:
- Market Concentration: Moderately concentrated, with the top 5 players holding approximately xx% of the market share in 2025.
- Technological Innovation: Driven by efficiency improvements, emissions reduction technologies, and digitalization.
- Regulatory Framework: Subject to environmental regulations impacting emissions and fuel usage, influencing technology adoption.
- Competitive Substitutes: Facing competition from renewable energy sources like solar and wind power.
- End-User Demographics: Primarily power generation companies, oil & gas facilities, and industrial users.
- M&A Trends: Moderate activity, focused on strengthening technological capabilities and market reach. xx M&A deals closed between 2019-2024, totaling an estimated value of $xx million.
North America Gas Turbine Power Generation Industry Growth Trends & Insights
The North American gas turbine power generation market experienced [Positive/Negative - Choose one based on data] growth during the historical period (2019-2024), with a CAGR of xx%. This growth is attributed to [insert specific reasons, e.g., increasing energy demand, aging infrastructure upgrades, etc.]. Market size is projected to reach $xx million in 2025, with a forecast CAGR of xx% from 2025 to 2033. Technological advancements such as the development of more efficient and cleaner gas turbines are driving market adoption. Consumer behavior shifts towards sustainability are also influencing the market, creating demand for eco-friendly power generation solutions. The market penetration of combined cycle gas turbines is projected to increase significantly over the forecast period.
Dominant Regions, Countries, or Segments in North America Gas Turbine Power Generation Industry
The [Specific Region, e.g., Southwestern United States] region dominates the North American gas turbine power generation market, driven by strong industrial activity and a favorable regulatory environment. Within end-user industries, the power generation sector holds the largest market share, followed by oil and gas. The 31-120 MW capacity segment shows the highest growth potential, fueled by demand for medium-sized power plants. Combined cycle gas turbines maintain a dominant share of the market due to their higher efficiency.
- Key Drivers:
- Strong industrial growth in specific regions.
- Government incentives for power generation infrastructure development.
- Increasing demand for reliable and efficient power sources.
- Dominance Factors:
- Higher concentration of power generation facilities.
- Favorable regulatory landscape.
- Extensive existing gas pipeline infrastructure.
North America Gas Turbine Power Generation Industry Product Landscape
The North American gas turbine power generation market offers a diverse range of products, including open-cycle and combined-cycle gas turbines across various capacity ranges. Technological advancements focus on improving efficiency, reducing emissions, and enhancing digital capabilities for remote monitoring and predictive maintenance. Key product innovations include advanced materials, improved combustion technologies, and integrated digital solutions. Unique selling propositions emphasize fuel flexibility, reduced environmental impact, and optimized operational performance.
Key Drivers, Barriers & Challenges in North America Gas Turbine Power Generation Industry
Key Drivers:
- Growing energy demand driven by population growth and industrial expansion.
- Aging infrastructure requiring upgrades and replacements.
- Government regulations promoting cleaner energy technologies.
Challenges & Restraints:
- Competition from renewable energy sources (e.g., solar, wind).
- Fluctuations in natural gas prices.
- Supply chain disruptions impacting manufacturing and maintenance. This resulted in a xx% increase in costs during 2022.
- Stringent environmental regulations increasing compliance costs.
Emerging Opportunities in North America Gas Turbine Power Generation Industry
Emerging opportunities lie in the integration of gas turbines with renewable energy sources (hybrid systems), development of smaller, modular gas turbines for distributed generation, and expansion into emerging markets within North America. The increasing focus on digitalization creates opportunities for advanced monitoring and predictive maintenance services. The demand for flexible and efficient power generation systems to support intermittent renewable energy sources presents a significant growth avenue.
Growth Accelerators in the North America Gas Turbine Power Generation Industry
Long-term growth will be accelerated by technological advancements such as the development of hydrogen-capable gas turbines and improved digital capabilities. Strategic partnerships between manufacturers and energy providers will foster market expansion. Government policies supporting energy infrastructure upgrades and promoting cleaner technologies will continue to play a vital role in driving market growth.
Key Players Shaping the North America Gas Turbine Power Generation Market
- Solar Turbines Inc
- Kawasaki Heavy Industries Ltd
- Siemens AG
- General Electric Company
- Harbin Electric International Company Limited
- Capstone Turbine Corporation
- Mitsubishi Heavy Industries Ltd
- Rolls-Royce Holding PLC
Notable Milestones in North America Gas Turbine Power Generation Industry Sector
- 2021: Siemens AG launched its new highly efficient gas turbine model.
- 2022: General Electric announced a major investment in hydrogen-ready gas turbine technology.
- 2023: A significant merger occurred between two smaller gas turbine manufacturers. (Specific details need to be added here based on factual data)
In-Depth North America Gas Turbine Power Generation Industry Market Outlook
The North American gas turbine power generation market holds significant long-term growth potential, driven by technological innovation and a shift towards cleaner energy solutions. Strategic opportunities exist for companies focused on developing efficient, flexible, and environmentally friendly gas turbine technologies. Companies that embrace digitalization and establish strong partnerships with energy providers will be well-positioned to capture market share in the coming years. The market is expected to experience continued growth, driven by modernization and renewable integration efforts.
North America Gas Turbine Power Generation Industry Segmentation
-
1. Capacity
- 1.1. Less than 30 MW
- 1.2. 31 to 120 MW
- 1.3. Above 120
-
2. Type
- 2.1. Combined Cycle
- 2.2. Open Cycle
-
3. End-User Industries
- 3.1. Power
- 3.2. Oil and Gas
- 3.3. Other End-User Industries
-
4. Geography
- 4.1. United States
- 4.2. Canada
- 4.3. Restof North America
North America Gas Turbine Power Generation Industry Segmentation By Geography
- 1. United States
- 2. Canada
- 3. Restof North America
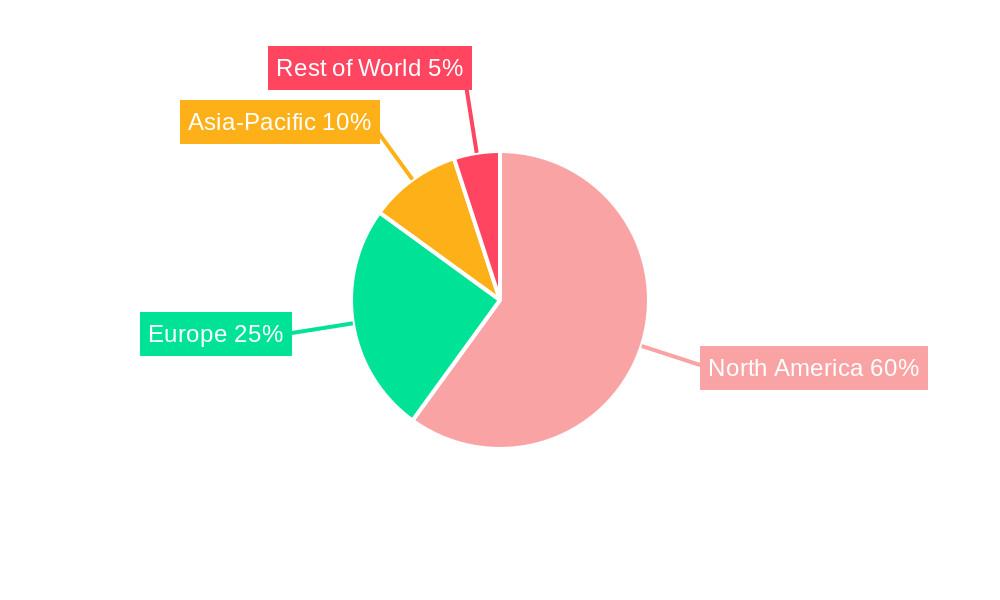
North America Gas Turbine Power Generation Industry Regional Market Share
Geographic Coverage of North America Gas Turbine Power Generation Industry
North America Gas Turbine Power Generation Industry REPORT HIGHLIGHTS
| Aspects | Details |
|---|---|
| Study Period | 2020-2034 |
| Base Year | 2025 |
| Estimated Year | 2026 |
| Forecast Period | 2026-2034 |
| Historical Period | 2020-2025 |
| Growth Rate | CAGR of 11.2% from 2020-2034 |
| Segmentation |
|
Table of Contents
- 1. Introduction
- 1.1. Research Scope
- 1.2. Market Segmentation
- 1.3. Research Methodology
- 1.4. Definitions and Assumptions
- 2. Executive Summary
- 2.1. Introduction
- 3. Market Dynamics
- 3.1. Introduction
- 3.2. Market Drivers
- 3.2.1. 4.; Supportive Government Policies and Incentives4.; Environmental Concerns
- 3.3. Market Restrains
- 3.3.1. 4.; Fossil Fuel Subsidies
- 3.4. Market Trends
- 3.4.1. Power Generation Application is Expected to Dominate the Market
- 4. Market Factor Analysis
- 4.1. Porters Five Forces
- 4.2. Supply/Value Chain
- 4.3. PESTEL analysis
- 4.4. Market Entropy
- 4.5. Patent/Trademark Analysis
- 5. North America Gas Turbine Power Generation Industry Analysis, Insights and Forecast, 2020-2032
- 5.1. Market Analysis, Insights and Forecast - by Capacity
- 5.1.1. Less than 30 MW
- 5.1.2. 31 to 120 MW
- 5.1.3. Above 120
- 5.2. Market Analysis, Insights and Forecast - by Type
- 5.2.1. Combined Cycle
- 5.2.2. Open Cycle
- 5.3. Market Analysis, Insights and Forecast - by End-User Industries
- 5.3.1. Power
- 5.3.2. Oil and Gas
- 5.3.3. Other End-User Industries
- 5.4. Market Analysis, Insights and Forecast - by Geography
- 5.4.1. United States
- 5.4.2. Canada
- 5.4.3. Restof North America
- 5.5. Market Analysis, Insights and Forecast - by Region
- 5.5.1. United States
- 5.5.2. Canada
- 5.5.3. Restof North America
- 5.1. Market Analysis, Insights and Forecast - by Capacity
- 6. United States North America Gas Turbine Power Generation Industry Analysis, Insights and Forecast, 2020-2032
- 6.1. Market Analysis, Insights and Forecast - by Capacity
- 6.1.1. Less than 30 MW
- 6.1.2. 31 to 120 MW
- 6.1.3. Above 120
- 6.2. Market Analysis, Insights and Forecast - by Type
- 6.2.1. Combined Cycle
- 6.2.2. Open Cycle
- 6.3. Market Analysis, Insights and Forecast - by End-User Industries
- 6.3.1. Power
- 6.3.2. Oil and Gas
- 6.3.3. Other End-User Industries
- 6.4. Market Analysis, Insights and Forecast - by Geography
- 6.4.1. United States
- 6.4.2. Canada
- 6.4.3. Restof North America
- 6.1. Market Analysis, Insights and Forecast - by Capacity
- 7. Canada North America Gas Turbine Power Generation Industry Analysis, Insights and Forecast, 2020-2032
- 7.1. Market Analysis, Insights and Forecast - by Capacity
- 7.1.1. Less than 30 MW
- 7.1.2. 31 to 120 MW
- 7.1.3. Above 120
- 7.2. Market Analysis, Insights and Forecast - by Type
- 7.2.1. Combined Cycle
- 7.2.2. Open Cycle
- 7.3. Market Analysis, Insights and Forecast - by End-User Industries
- 7.3.1. Power
- 7.3.2. Oil and Gas
- 7.3.3. Other End-User Industries
- 7.4. Market Analysis, Insights and Forecast - by Geography
- 7.4.1. United States
- 7.4.2. Canada
- 7.4.3. Restof North America
- 7.1. Market Analysis, Insights and Forecast - by Capacity
- 8. Restof North America North America Gas Turbine Power Generation Industry Analysis, Insights and Forecast, 2020-2032
- 8.1. Market Analysis, Insights and Forecast - by Capacity
- 8.1.1. Less than 30 MW
- 8.1.2. 31 to 120 MW
- 8.1.3. Above 120
- 8.2. Market Analysis, Insights and Forecast - by Type
- 8.2.1. Combined Cycle
- 8.2.2. Open Cycle
- 8.3. Market Analysis, Insights and Forecast - by End-User Industries
- 8.3.1. Power
- 8.3.2. Oil and Gas
- 8.3.3. Other End-User Industries
- 8.4. Market Analysis, Insights and Forecast - by Geography
- 8.4.1. United States
- 8.4.2. Canada
- 8.4.3. Restof North America
- 8.1. Market Analysis, Insights and Forecast - by Capacity
- 9. Competitive Analysis
- 9.1. Market Share Analysis 2025
- 9.2. Company Profiles
- 9.2.1 Solar Turbines Inc
- 9.2.1.1. Overview
- 9.2.1.2. Products
- 9.2.1.3. SWOT Analysis
- 9.2.1.4. Recent Developments
- 9.2.1.5. Financials (Based on Availability)
- 9.2.2 Kawasaki Heavy Industries Ltd
- 9.2.2.1. Overview
- 9.2.2.2. Products
- 9.2.2.3. SWOT Analysis
- 9.2.2.4. Recent Developments
- 9.2.2.5. Financials (Based on Availability)
- 9.2.3 Siemens AG
- 9.2.3.1. Overview
- 9.2.3.2. Products
- 9.2.3.3. SWOT Analysis
- 9.2.3.4. Recent Developments
- 9.2.3.5. Financials (Based on Availability)
- 9.2.4 General Electric Company
- 9.2.4.1. Overview
- 9.2.4.2. Products
- 9.2.4.3. SWOT Analysis
- 9.2.4.4. Recent Developments
- 9.2.4.5. Financials (Based on Availability)
- 9.2.5 Harbin Electric International Company Limited
- 9.2.5.1. Overview
- 9.2.5.2. Products
- 9.2.5.3. SWOT Analysis
- 9.2.5.4. Recent Developments
- 9.2.5.5. Financials (Based on Availability)
- 9.2.6 Capstone Turbine Corporation
- 9.2.6.1. Overview
- 9.2.6.2. Products
- 9.2.6.3. SWOT Analysis
- 9.2.6.4. Recent Developments
- 9.2.6.5. Financials (Based on Availability)
- 9.2.7 Mitsubishi Heavy Industries Ltd
- 9.2.7.1. Overview
- 9.2.7.2. Products
- 9.2.7.3. SWOT Analysis
- 9.2.7.4. Recent Developments
- 9.2.7.5. Financials (Based on Availability)
- 9.2.8 Rolls-Royce Holding PLC
- 9.2.8.1. Overview
- 9.2.8.2. Products
- 9.2.8.3. SWOT Analysis
- 9.2.8.4. Recent Developments
- 9.2.8.5. Financials (Based on Availability)
- 9.2.1 Solar Turbines Inc
List of Figures
- Figure 1: North America Gas Turbine Power Generation Industry Revenue Breakdown (billion, %) by Product 2025 & 2033
- Figure 2: North America Gas Turbine Power Generation Industry Share (%) by Company 2025
List of Tables
- Table 1: North America Gas Turbine Power Generation Industry Revenue billion Forecast, by Capacity 2020 & 2033
- Table 2: North America Gas Turbine Power Generation Industry Revenue billion Forecast, by Type 2020 & 2033
- Table 3: North America Gas Turbine Power Generation Industry Revenue billion Forecast, by End-User Industries 2020 & 2033
- Table 4: North America Gas Turbine Power Generation Industry Revenue billion Forecast, by Geography 2020 & 2033
- Table 5: North America Gas Turbine Power Generation Industry Revenue billion Forecast, by Region 2020 & 2033
- Table 6: North America Gas Turbine Power Generation Industry Revenue billion Forecast, by Capacity 2020 & 2033
- Table 7: North America Gas Turbine Power Generation Industry Revenue billion Forecast, by Type 2020 & 2033
- Table 8: North America Gas Turbine Power Generation Industry Revenue billion Forecast, by End-User Industries 2020 & 2033
- Table 9: North America Gas Turbine Power Generation Industry Revenue billion Forecast, by Geography 2020 & 2033
- Table 10: North America Gas Turbine Power Generation Industry Revenue billion Forecast, by Country 2020 & 2033
- Table 11: North America Gas Turbine Power Generation Industry Revenue billion Forecast, by Capacity 2020 & 2033
- Table 12: North America Gas Turbine Power Generation Industry Revenue billion Forecast, by Type 2020 & 2033
- Table 13: North America Gas Turbine Power Generation Industry Revenue billion Forecast, by End-User Industries 2020 & 2033
- Table 14: North America Gas Turbine Power Generation Industry Revenue billion Forecast, by Geography 2020 & 2033
- Table 15: North America Gas Turbine Power Generation Industry Revenue billion Forecast, by Country 2020 & 2033
- Table 16: North America Gas Turbine Power Generation Industry Revenue billion Forecast, by Capacity 2020 & 2033
- Table 17: North America Gas Turbine Power Generation Industry Revenue billion Forecast, by Type 2020 & 2033
- Table 18: North America Gas Turbine Power Generation Industry Revenue billion Forecast, by End-User Industries 2020 & 2033
- Table 19: North America Gas Turbine Power Generation Industry Revenue billion Forecast, by Geography 2020 & 2033
- Table 20: North America Gas Turbine Power Generation Industry Revenue billion Forecast, by Country 2020 & 2033
Frequently Asked Questions
1. What is the projected Compound Annual Growth Rate (CAGR) of the North America Gas Turbine Power Generation Industry?
The projected CAGR is approximately 11.2%.
2. Which companies are prominent players in the North America Gas Turbine Power Generation Industry?
Key companies in the market include Solar Turbines Inc, Kawasaki Heavy Industries Ltd, Siemens AG, General Electric Company, Harbin Electric International Company Limited, Capstone Turbine Corporation, Mitsubishi Heavy Industries Ltd, Rolls-Royce Holding PLC.
3. What are the main segments of the North America Gas Turbine Power Generation Industry?
The market segments include Capacity, Type, End-User Industries, Geography.
4. Can you provide details about the market size?
The market size is estimated to be USD 22.6 billion as of 2022.
5. What are some drivers contributing to market growth?
4.; Supportive Government Policies and Incentives4.; Environmental Concerns.
6. What are the notable trends driving market growth?
Power Generation Application is Expected to Dominate the Market.
7. Are there any restraints impacting market growth?
4.; Fossil Fuel Subsidies.
8. Can you provide examples of recent developments in the market?
N/A
9. What pricing options are available for accessing the report?
Pricing options include single-user, multi-user, and enterprise licenses priced at USD 4750, USD 5250, and USD 8750 respectively.
10. Is the market size provided in terms of value or volume?
The market size is provided in terms of value, measured in billion.
11. Are there any specific market keywords associated with the report?
Yes, the market keyword associated with the report is "North America Gas Turbine Power Generation Industry," which aids in identifying and referencing the specific market segment covered.
12. How do I determine which pricing option suits my needs best?
The pricing options vary based on user requirements and access needs. Individual users may opt for single-user licenses, while businesses requiring broader access may choose multi-user or enterprise licenses for cost-effective access to the report.
13. Are there any additional resources or data provided in the North America Gas Turbine Power Generation Industry report?
While the report offers comprehensive insights, it's advisable to review the specific contents or supplementary materials provided to ascertain if additional resources or data are available.
14. How can I stay updated on further developments or reports in the North America Gas Turbine Power Generation Industry?
To stay informed about further developments, trends, and reports in the North America Gas Turbine Power Generation Industry, consider subscribing to industry newsletters, following relevant companies and organizations, or regularly checking reputable industry news sources and publications.
Methodology
Step 1 - Identification of Relevant Samples Size from Population Database


Step 2 - Approaches for Defining Global Market Size (Value, Volume* & Price*)

Note*: In applicable scenarios
Step 3 - Data Sources
Primary Research
- Web Analytics
- Survey Reports
- Research Institute
- Latest Research Reports
- Opinion Leaders
Secondary Research
- Annual Reports
- White Paper
- Latest Press Release
- Industry Association
- Paid Database
- Investor Presentations

Step 4 - Data Triangulation
Involves using different sources of information in order to increase the validity of a study
These sources are likely to be stakeholders in a program - participants, other researchers, program staff, other community members, and so on.
Then we put all data in single framework & apply various statistical tools to find out the dynamic on the market.
During the analysis stage, feedback from the stakeholder groups would be compared to determine areas of agreement as well as areas of divergence
