

Key Insights
The optical brightener market is poised for significant expansion, driven by escalating demand across the textile, paper, and plastics sectors. A projected Compound Annual Growth Rate (CAGR) exceeding 4% from 2025 to 2033 indicates robust market development. With a current market size of $2.9 billion in the base year of 2025, the market is expected to reach substantial value by 2033. This growth is propelled by a growing consumer preference for enhanced whiteness and brightness in diverse product applications, coupled with continuous technological advancements in brightener formulations that offer improved efficacy and reduced environmental impact. Furthermore, rising disposable incomes in emerging economies and increasing urbanization contribute to a higher demand for consumer goods, indirectly stimulating the optical brightener market.

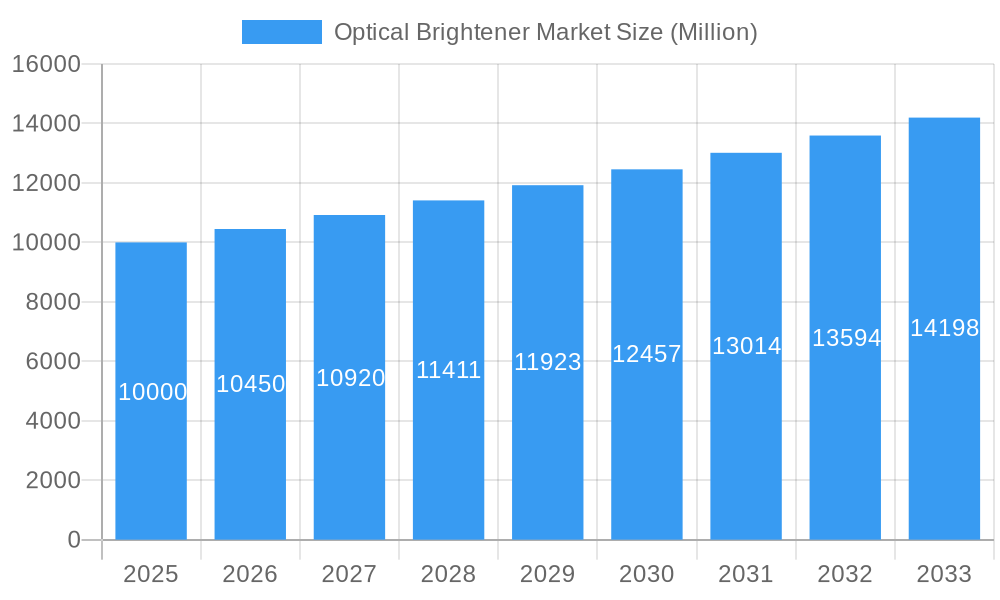
Optical Brightener Market Market Size (In Billion)
Despite the positive outlook, the market confronts certain challenges. Stringent environmental regulations governing the use of specific chemical brighteners present a constraint. Volatile raw material pricing and potential supply chain disruptions also pose risks to market stability. The market is segmented by type, application, and region. Leading industry players, including Huntsman International LLC, Eastman Chemical Company, and BASF SE, engage in intense competition through product innovation and strategic geographic expansion. The future trajectory of the optical brightener market appears promising, particularly with the growing emphasis on sustainable and eco-friendly alternatives, which are anticipated to gain increasing market share. Continued investment in research and development will be critical for sustained market growth. A strategic focus on addressing environmental concerns, alongside innovation in product development, will be paramount for maintaining strong market performance.
Optical Brightener Market Company Market Share
Optical Brightener Market: A Comprehensive Report (2019-2033)
This in-depth report provides a comprehensive analysis of the Optical Brightener Market, encompassing market dynamics, growth trends, regional performance, product landscape, key players, and future outlook. The study period spans from 2019 to 2033, with 2025 serving as the base and estimated year. The forecast period covers 2025-2033, and the historical period encompasses 2019-2024. This report is essential for industry professionals, investors, and researchers seeking to understand the current state and future trajectory of this dynamic market. The report segments the market into various categories (details provided below) and analyzes the performance of key players like Huntsman International LLC, Eastman Chemical Company, BASF SE, and Clariant, among others. The total market size is predicted to reach xx Million units by 2033.
Optical Brightener Market Market Dynamics & Structure
The Optical Brightener market is characterized by moderate concentration, with a few dominant players holding significant market share. Technological innovation, particularly in developing sustainable and high-performance brighteners, is a key driver. Stringent environmental regulations concerning chemical usage are shaping product development and influencing market dynamics. The presence of substitute products, such as natural dyes, presents competitive pressure, while the market's growth is strongly linked to the performance of its parent markets, including the textile, paper, and plastics industries. Mergers and acquisitions (M&A) activity has been moderate, reflecting strategic consolidation efforts within the industry.
- Market Concentration: Moderately concentrated, with top 5 players holding approximately xx% market share in 2025.
- Technological Innovation: Focus on developing bio-based and sustainable brighteners.
- Regulatory Framework: Stringent environmental regulations driving sustainable product development.
- Competitive Substitutes: Natural dyes and alternative whitening agents exert competitive pressure.
- End-User Demographics: Strong correlation with growth in textile, paper, and plastic industries.
- M&A Trends: Moderate M&A activity, reflecting strategic consolidation amongst key players with approximately xx deals in the past five years.
- Innovation Barriers: High R&D costs and stringent regulatory approvals pose challenges.
Optical Brightener Market Growth Trends & Insights
The Optical Brightener market experienced steady growth during the historical period (2019-2024), driven by increasing demand from key end-use sectors. The market size is estimated at xx Million units in 2025. The adoption rate of optical brighteners in various applications continues to rise, fueled by increasing consumer preference for brighter and whiter products. Technological disruptions, such as the development of more efficient and sustainable brighteners, are influencing market growth. Consumer behavior shifts toward environmentally friendly products are driving demand for sustainable alternatives. The market is projected to exhibit a Compound Annual Growth Rate (CAGR) of xx% during the forecast period (2025-2033), reaching an estimated xx Million units by 2033. Market penetration across various sectors is expected to increase further, owing to technological advancements and increased awareness about the benefits of optical brighteners. Increased adoption in emerging markets will also contribute to overall growth.
Dominant Regions, Countries, or Segments in Optical Brightener Market
The Asia-Pacific region currently dominates the Optical Brightener market, driven by robust growth in the textile and paper industries in countries like China and India. The strong economic growth, expanding manufacturing sectors, and increasing consumer spending in these regions are significant contributors. Europe and North America also hold substantial market share, owing to established industries and higher per capita consumption.
- Key Drivers in Asia-Pacific:
- Rapid industrialization and economic growth.
- Expanding textile and paper manufacturing sectors.
- Increasing consumer demand for brighter products.
- Dominance Factors: High production capacity, favorable government policies, and lower labor costs in Asia-Pacific contribute to its market leadership.
- Growth Potential: Untapped markets in emerging economies within Asia-Pacific and Africa offer significant growth potential.
Optical Brightener Market Product Landscape
Optical brighteners are available in various forms, including liquid, powder, and granular, catering to diverse applications. Recent innovations focus on developing more environmentally friendly, bio-based formulations with improved performance characteristics such as increased whiteness, reduced environmental impact, and enhanced stability. These advancements are driven by growing environmental awareness and stricter regulations. Unique selling propositions frequently center around improved brightness, enhanced wash fastness, and cost-effectiveness. Technological advancements in formulation chemistry and application techniques continue to drive product differentiation.
Key Drivers, Barriers & Challenges in Optical Brightener Market
Key Drivers:
- Growing demand from the textile industry.
- Increasing application in paper manufacturing.
- Rising disposable income and consumer preference for brighter products.
Challenges and Restraints:
- Stringent environmental regulations limiting the use of certain chemicals.
- Fluctuations in raw material prices impacting manufacturing costs.
- Intense competition from existing and emerging players.
- Supply chain disruptions due to geopolitical instability. This resulted in a xx% increase in production costs in 2024.
Emerging Opportunities in Optical Brightener Market
- Development of bio-based and sustainable optical brighteners.
- Growing demand for high-performance brighteners in specialized applications.
- Expansion into emerging markets with high growth potential.
- Development of novel applications in areas such as plastics and cosmetics.
Growth Accelerators in the Optical Brightener Market Industry
Technological breakthroughs in formulation chemistry, coupled with strategic partnerships between manufacturers and end-users, are key growth catalysts. Market expansion strategies targeting emerging economies and diversification into new application segments will also drive long-term growth. Furthermore, increasing consumer awareness about the benefits of optical brighteners in enhancing the aesthetic appeal of various products will boost market expansion.
Key Players Shaping the Optical Brightener Market Market
- Huntsman International LLC
- Eastman Chemical Company
- BASF SE
- Clariant
- Kolorjet Chemicals Pvt Ltd
- Sarex
- Keystone Aniline Corporation
- United Specialities Pvt Ltd
- Archroma
- Zhejiang Transfar Foreign Chemical Co Ltd
- Dayglo Color Corp
- Aron Universal Limited
- Milliken Chemical
- Brilliant Group Inc
Notable Milestones in Optical Brightener Market Sector
- 2022-Q3: BASF SE launched a new range of sustainable optical brighteners.
- 2023-Q1: Huntsman International LLC acquired a smaller optical brightener manufacturer, expanding its market share.
- 2024-Q4: New environmental regulations in the EU impacted the production and sale of certain optical brighteners.
- (Further milestones to be added based on available data)
In-Depth Optical Brightener Market Market Outlook
The Optical Brightener market is poised for continued growth over the forecast period, driven by several factors. Innovation in sustainable and high-performance products, expansion into new applications, and increasing demand from emerging markets will contribute significantly. Strategic partnerships and collaborations among key players will further accelerate market expansion. Focusing on sustainable products and catering to evolving consumer preferences will be crucial for success in this dynamic market. The market’s growth is predicted to be driven by the increasing demand for high-performance, environmentally friendly products in various sectors, creating significant opportunities for innovation and market expansion.
Optical Brightener Market Segmentation
-
1. Chemical Type
- 1.1. Triazine-Stilbenes
- 1.2. Coumarins
- 1.3. Imidazolines
- 1.4. Diazoles
- 1.5. Benzoxazolines
- 1.6. Other Chemical Types
-
2. Application
- 2.1. Detergent Brightener
- 2.2. Paper Brightning
- 2.3. Fiber Whitening
- 2.4. Textile Whitening
- 2.5. Cosmetics
- 2.6. Other Applications
Optical Brightener Market Segmentation By Geography
-
1. Asia Pacific
- 1.1. China
- 1.2. India
- 1.3. Japan
- 1.4. South Korea
- 1.5. Rest of Asia Pacific
-
2. North America
- 2.1. United States
- 2.2. Canada
- 2.3. Mexico
-
3. Europe
- 3.1. Germany
- 3.2. United Kingdom
- 3.3. France
- 3.4. Italy
- 3.5. Rest of Europe
-
4. South America
- 4.1. Brazil
- 4.2. Argentina
- 4.3. Rest of South America
-
5. Middle East and Africa
- 5.1. Saudi Arabia
- 5.2. South Africa
- 5.3. Rest of Middle East and Africa

Optical Brightener Market Regional Market Share
Geographic Coverage of Optical Brightener Market
Optical Brightener Market REPORT HIGHLIGHTS
| Aspects | Details |
|---|---|
| Study Period | 2020-2034 |
| Base Year | 2025 |
| Estimated Year | 2026 |
| Forecast Period | 2026-2034 |
| Historical Period | 2020-2025 |
| Growth Rate | CAGR of 4% from 2020-2034 |
| Segmentation |
|
Table of Contents
- 1. Introduction
- 1.1. Research Scope
- 1.2. Market Segmentation
- 1.3. Research Methodology
- 1.4. Definitions and Assumptions
- 2. Executive Summary
- 2.1. Introduction
- 3. Market Dynamics
- 3.1. Introduction
- 3.2. Market Drivers
- 3.2.1. ; Increasing Demand for Optical Brighteners in Laundry Detergent; Other Drivers
- 3.3. Market Restrains
- 3.3.1. ; Increasing Demand for Optical Brighteners in Laundry Detergent; Other Drivers
- 3.4. Market Trends
- 3.4.1. Increasing Demand for Optical Brightener in Laundry Detergent Demand
- 4. Market Factor Analysis
- 4.1. Porters Five Forces
- 4.2. Supply/Value Chain
- 4.3. PESTEL analysis
- 4.4. Market Entropy
- 4.5. Patent/Trademark Analysis
- 5. Global Optical Brightener Market Analysis, Insights and Forecast, 2020-2032
- 5.1. Market Analysis, Insights and Forecast - by Chemical Type
- 5.1.1. Triazine-Stilbenes
- 5.1.2. Coumarins
- 5.1.3. Imidazolines
- 5.1.4. Diazoles
- 5.1.5. Benzoxazolines
- 5.1.6. Other Chemical Types
- 5.2. Market Analysis, Insights and Forecast - by Application
- 5.2.1. Detergent Brightener
- 5.2.2. Paper Brightning
- 5.2.3. Fiber Whitening
- 5.2.4. Textile Whitening
- 5.2.5. Cosmetics
- 5.2.6. Other Applications
- 5.3. Market Analysis, Insights and Forecast - by Region
- 5.3.1. Asia Pacific
- 5.3.2. North America
- 5.3.3. Europe
- 5.3.4. South America
- 5.3.5. Middle East and Africa
- 5.1. Market Analysis, Insights and Forecast - by Chemical Type
- 6. Asia Pacific Optical Brightener Market Analysis, Insights and Forecast, 2020-2032
- 6.1. Market Analysis, Insights and Forecast - by Chemical Type
- 6.1.1. Triazine-Stilbenes
- 6.1.2. Coumarins
- 6.1.3. Imidazolines
- 6.1.4. Diazoles
- 6.1.5. Benzoxazolines
- 6.1.6. Other Chemical Types
- 6.2. Market Analysis, Insights and Forecast - by Application
- 6.2.1. Detergent Brightener
- 6.2.2. Paper Brightning
- 6.2.3. Fiber Whitening
- 6.2.4. Textile Whitening
- 6.2.5. Cosmetics
- 6.2.6. Other Applications
- 6.1. Market Analysis, Insights and Forecast - by Chemical Type
- 7. North America Optical Brightener Market Analysis, Insights and Forecast, 2020-2032
- 7.1. Market Analysis, Insights and Forecast - by Chemical Type
- 7.1.1. Triazine-Stilbenes
- 7.1.2. Coumarins
- 7.1.3. Imidazolines
- 7.1.4. Diazoles
- 7.1.5. Benzoxazolines
- 7.1.6. Other Chemical Types
- 7.2. Market Analysis, Insights and Forecast - by Application
- 7.2.1. Detergent Brightener
- 7.2.2. Paper Brightning
- 7.2.3. Fiber Whitening
- 7.2.4. Textile Whitening
- 7.2.5. Cosmetics
- 7.2.6. Other Applications
- 7.1. Market Analysis, Insights and Forecast - by Chemical Type
- 8. Europe Optical Brightener Market Analysis, Insights and Forecast, 2020-2032
- 8.1. Market Analysis, Insights and Forecast - by Chemical Type
- 8.1.1. Triazine-Stilbenes
- 8.1.2. Coumarins
- 8.1.3. Imidazolines
- 8.1.4. Diazoles
- 8.1.5. Benzoxazolines
- 8.1.6. Other Chemical Types
- 8.2. Market Analysis, Insights and Forecast - by Application
- 8.2.1. Detergent Brightener
- 8.2.2. Paper Brightning
- 8.2.3. Fiber Whitening
- 8.2.4. Textile Whitening
- 8.2.5. Cosmetics
- 8.2.6. Other Applications
- 8.1. Market Analysis, Insights and Forecast - by Chemical Type
- 9. South America Optical Brightener Market Analysis, Insights and Forecast, 2020-2032
- 9.1. Market Analysis, Insights and Forecast - by Chemical Type
- 9.1.1. Triazine-Stilbenes
- 9.1.2. Coumarins
- 9.1.3. Imidazolines
- 9.1.4. Diazoles
- 9.1.5. Benzoxazolines
- 9.1.6. Other Chemical Types
- 9.2. Market Analysis, Insights and Forecast - by Application
- 9.2.1. Detergent Brightener
- 9.2.2. Paper Brightning
- 9.2.3. Fiber Whitening
- 9.2.4. Textile Whitening
- 9.2.5. Cosmetics
- 9.2.6. Other Applications
- 9.1. Market Analysis, Insights and Forecast - by Chemical Type
- 10. Middle East and Africa Optical Brightener Market Analysis, Insights and Forecast, 2020-2032
- 10.1. Market Analysis, Insights and Forecast - by Chemical Type
- 10.1.1. Triazine-Stilbenes
- 10.1.2. Coumarins
- 10.1.3. Imidazolines
- 10.1.4. Diazoles
- 10.1.5. Benzoxazolines
- 10.1.6. Other Chemical Types
- 10.2. Market Analysis, Insights and Forecast - by Application
- 10.2.1. Detergent Brightener
- 10.2.2. Paper Brightning
- 10.2.3. Fiber Whitening
- 10.2.4. Textile Whitening
- 10.2.5. Cosmetics
- 10.2.6. Other Applications
- 10.1. Market Analysis, Insights and Forecast - by Chemical Type
- 11. Competitive Analysis
- 11.1. Global Market Share Analysis 2025
- 11.2. Company Profiles
- 11.2.1 Huntsman International LLC
- 11.2.1.1. Overview
- 11.2.1.2. Products
- 11.2.1.3. SWOT Analysis
- 11.2.1.4. Recent Developments
- 11.2.1.5. Financials (Based on Availability)
- 11.2.2 Eastman Chemical Company
- 11.2.2.1. Overview
- 11.2.2.2. Products
- 11.2.2.3. SWOT Analysis
- 11.2.2.4. Recent Developments
- 11.2.2.5. Financials (Based on Availability)
- 11.2.3 BASF SE
- 11.2.3.1. Overview
- 11.2.3.2. Products
- 11.2.3.3. SWOT Analysis
- 11.2.3.4. Recent Developments
- 11.2.3.5. Financials (Based on Availability)
- 11.2.4 Clariant
- 11.2.4.1. Overview
- 11.2.4.2. Products
- 11.2.4.3. SWOT Analysis
- 11.2.4.4. Recent Developments
- 11.2.4.5. Financials (Based on Availability)
- 11.2.5 Kolorjet Chemicals Pvt Ltd
- 11.2.5.1. Overview
- 11.2.5.2. Products
- 11.2.5.3. SWOT Analysis
- 11.2.5.4. Recent Developments
- 11.2.5.5. Financials (Based on Availability)
- 11.2.6 Sarex
- 11.2.6.1. Overview
- 11.2.6.2. Products
- 11.2.6.3. SWOT Analysis
- 11.2.6.4. Recent Developments
- 11.2.6.5. Financials (Based on Availability)
- 11.2.7 Keystone Aniline Corporation
- 11.2.7.1. Overview
- 11.2.7.2. Products
- 11.2.7.3. SWOT Analysis
- 11.2.7.4. Recent Developments
- 11.2.7.5. Financials (Based on Availability)
- 11.2.8 United Specialities Pvt Ltd
- 11.2.8.1. Overview
- 11.2.8.2. Products
- 11.2.8.3. SWOT Analysis
- 11.2.8.4. Recent Developments
- 11.2.8.5. Financials (Based on Availability)
- 11.2.9 Archroma
- 11.2.9.1. Overview
- 11.2.9.2. Products
- 11.2.9.3. SWOT Analysis
- 11.2.9.4. Recent Developments
- 11.2.9.5. Financials (Based on Availability)
- 11.2.10 Zhejiang Transfar Foreign Chemical Co Ltd
- 11.2.10.1. Overview
- 11.2.10.2. Products
- 11.2.10.3. SWOT Analysis
- 11.2.10.4. Recent Developments
- 11.2.10.5. Financials (Based on Availability)
- 11.2.11 Dayglo Color Corp
- 11.2.11.1. Overview
- 11.2.11.2. Products
- 11.2.11.3. SWOT Analysis
- 11.2.11.4. Recent Developments
- 11.2.11.5. Financials (Based on Availability)
- 11.2.12 Aron Universal Limited
- 11.2.12.1. Overview
- 11.2.12.2. Products
- 11.2.12.3. SWOT Analysis
- 11.2.12.4. Recent Developments
- 11.2.12.5. Financials (Based on Availability)
- 11.2.13 Milliken Chemical
- 11.2.13.1. Overview
- 11.2.13.2. Products
- 11.2.13.3. SWOT Analysis
- 11.2.13.4. Recent Developments
- 11.2.13.5. Financials (Based on Availability)
- 11.2.14 Brilliant Group Inc *List Not Exhaustive
- 11.2.14.1. Overview
- 11.2.14.2. Products
- 11.2.14.3. SWOT Analysis
- 11.2.14.4. Recent Developments
- 11.2.14.5. Financials (Based on Availability)
- 11.2.1 Huntsman International LLC
List of Figures
- Figure 1: Global Optical Brightener Market Revenue Breakdown (billion, %) by Region 2025 & 2033
- Figure 2: Asia Pacific Optical Brightener Market Revenue (billion), by Chemical Type 2025 & 2033
- Figure 3: Asia Pacific Optical Brightener Market Revenue Share (%), by Chemical Type 2025 & 2033
- Figure 4: Asia Pacific Optical Brightener Market Revenue (billion), by Application 2025 & 2033
- Figure 5: Asia Pacific Optical Brightener Market Revenue Share (%), by Application 2025 & 2033
- Figure 6: Asia Pacific Optical Brightener Market Revenue (billion), by Country 2025 & 2033
- Figure 7: Asia Pacific Optical Brightener Market Revenue Share (%), by Country 2025 & 2033
- Figure 8: North America Optical Brightener Market Revenue (billion), by Chemical Type 2025 & 2033
- Figure 9: North America Optical Brightener Market Revenue Share (%), by Chemical Type 2025 & 2033
- Figure 10: North America Optical Brightener Market Revenue (billion), by Application 2025 & 2033
- Figure 11: North America Optical Brightener Market Revenue Share (%), by Application 2025 & 2033
- Figure 12: North America Optical Brightener Market Revenue (billion), by Country 2025 & 2033
- Figure 13: North America Optical Brightener Market Revenue Share (%), by Country 2025 & 2033
- Figure 14: Europe Optical Brightener Market Revenue (billion), by Chemical Type 2025 & 2033
- Figure 15: Europe Optical Brightener Market Revenue Share (%), by Chemical Type 2025 & 2033
- Figure 16: Europe Optical Brightener Market Revenue (billion), by Application 2025 & 2033
- Figure 17: Europe Optical Brightener Market Revenue Share (%), by Application 2025 & 2033
- Figure 18: Europe Optical Brightener Market Revenue (billion), by Country 2025 & 2033
- Figure 19: Europe Optical Brightener Market Revenue Share (%), by Country 2025 & 2033
- Figure 20: South America Optical Brightener Market Revenue (billion), by Chemical Type 2025 & 2033
- Figure 21: South America Optical Brightener Market Revenue Share (%), by Chemical Type 2025 & 2033
- Figure 22: South America Optical Brightener Market Revenue (billion), by Application 2025 & 2033
- Figure 23: South America Optical Brightener Market Revenue Share (%), by Application 2025 & 2033
- Figure 24: South America Optical Brightener Market Revenue (billion), by Country 2025 & 2033
- Figure 25: South America Optical Brightener Market Revenue Share (%), by Country 2025 & 2033
- Figure 26: Middle East and Africa Optical Brightener Market Revenue (billion), by Chemical Type 2025 & 2033
- Figure 27: Middle East and Africa Optical Brightener Market Revenue Share (%), by Chemical Type 2025 & 2033
- Figure 28: Middle East and Africa Optical Brightener Market Revenue (billion), by Application 2025 & 2033
- Figure 29: Middle East and Africa Optical Brightener Market Revenue Share (%), by Application 2025 & 2033
- Figure 30: Middle East and Africa Optical Brightener Market Revenue (billion), by Country 2025 & 2033
- Figure 31: Middle East and Africa Optical Brightener Market Revenue Share (%), by Country 2025 & 2033
List of Tables
- Table 1: Global Optical Brightener Market Revenue billion Forecast, by Chemical Type 2020 & 2033
- Table 2: Global Optical Brightener Market Revenue billion Forecast, by Application 2020 & 2033
- Table 3: Global Optical Brightener Market Revenue billion Forecast, by Region 2020 & 2033
- Table 4: Global Optical Brightener Market Revenue billion Forecast, by Chemical Type 2020 & 2033
- Table 5: Global Optical Brightener Market Revenue billion Forecast, by Application 2020 & 2033
- Table 6: Global Optical Brightener Market Revenue billion Forecast, by Country 2020 & 2033
- Table 7: China Optical Brightener Market Revenue (billion) Forecast, by Application 2020 & 2033
- Table 8: India Optical Brightener Market Revenue (billion) Forecast, by Application 2020 & 2033
- Table 9: Japan Optical Brightener Market Revenue (billion) Forecast, by Application 2020 & 2033
- Table 10: South Korea Optical Brightener Market Revenue (billion) Forecast, by Application 2020 & 2033
- Table 11: Rest of Asia Pacific Optical Brightener Market Revenue (billion) Forecast, by Application 2020 & 2033
- Table 12: Global Optical Brightener Market Revenue billion Forecast, by Chemical Type 2020 & 2033
- Table 13: Global Optical Brightener Market Revenue billion Forecast, by Application 2020 & 2033
- Table 14: Global Optical Brightener Market Revenue billion Forecast, by Country 2020 & 2033
- Table 15: United States Optical Brightener Market Revenue (billion) Forecast, by Application 2020 & 2033
- Table 16: Canada Optical Brightener Market Revenue (billion) Forecast, by Application 2020 & 2033
- Table 17: Mexico Optical Brightener Market Revenue (billion) Forecast, by Application 2020 & 2033
- Table 18: Global Optical Brightener Market Revenue billion Forecast, by Chemical Type 2020 & 2033
- Table 19: Global Optical Brightener Market Revenue billion Forecast, by Application 2020 & 2033
- Table 20: Global Optical Brightener Market Revenue billion Forecast, by Country 2020 & 2033
- Table 21: Germany Optical Brightener Market Revenue (billion) Forecast, by Application 2020 & 2033
- Table 22: United Kingdom Optical Brightener Market Revenue (billion) Forecast, by Application 2020 & 2033
- Table 23: France Optical Brightener Market Revenue (billion) Forecast, by Application 2020 & 2033
- Table 24: Italy Optical Brightener Market Revenue (billion) Forecast, by Application 2020 & 2033
- Table 25: Rest of Europe Optical Brightener Market Revenue (billion) Forecast, by Application 2020 & 2033
- Table 26: Global Optical Brightener Market Revenue billion Forecast, by Chemical Type 2020 & 2033
- Table 27: Global Optical Brightener Market Revenue billion Forecast, by Application 2020 & 2033
- Table 28: Global Optical Brightener Market Revenue billion Forecast, by Country 2020 & 2033
- Table 29: Brazil Optical Brightener Market Revenue (billion) Forecast, by Application 2020 & 2033
- Table 30: Argentina Optical Brightener Market Revenue (billion) Forecast, by Application 2020 & 2033
- Table 31: Rest of South America Optical Brightener Market Revenue (billion) Forecast, by Application 2020 & 2033
- Table 32: Global Optical Brightener Market Revenue billion Forecast, by Chemical Type 2020 & 2033
- Table 33: Global Optical Brightener Market Revenue billion Forecast, by Application 2020 & 2033
- Table 34: Global Optical Brightener Market Revenue billion Forecast, by Country 2020 & 2033
- Table 35: Saudi Arabia Optical Brightener Market Revenue (billion) Forecast, by Application 2020 & 2033
- Table 36: South Africa Optical Brightener Market Revenue (billion) Forecast, by Application 2020 & 2033
- Table 37: Rest of Middle East and Africa Optical Brightener Market Revenue (billion) Forecast, by Application 2020 & 2033
Frequently Asked Questions
1. What is the projected Compound Annual Growth Rate (CAGR) of the Optical Brightener Market?
The projected CAGR is approximately 4%.
2. Which companies are prominent players in the Optical Brightener Market?
Key companies in the market include Huntsman International LLC, Eastman Chemical Company, BASF SE, Clariant, Kolorjet Chemicals Pvt Ltd, Sarex, Keystone Aniline Corporation, United Specialities Pvt Ltd, Archroma, Zhejiang Transfar Foreign Chemical Co Ltd, Dayglo Color Corp, Aron Universal Limited, Milliken Chemical, Brilliant Group Inc *List Not Exhaustive.
3. What are the main segments of the Optical Brightener Market?
The market segments include Chemical Type, Application.
4. Can you provide details about the market size?
The market size is estimated to be USD 2.9 billion as of 2022.
5. What are some drivers contributing to market growth?
; Increasing Demand for Optical Brighteners in Laundry Detergent; Other Drivers.
6. What are the notable trends driving market growth?
Increasing Demand for Optical Brightener in Laundry Detergent Demand.
7. Are there any restraints impacting market growth?
; Increasing Demand for Optical Brighteners in Laundry Detergent; Other Drivers.
8. Can you provide examples of recent developments in the market?
N/A
9. What pricing options are available for accessing the report?
Pricing options include single-user, multi-user, and enterprise licenses priced at USD 4750, USD 5250, and USD 8750 respectively.
10. Is the market size provided in terms of value or volume?
The market size is provided in terms of value, measured in billion.
11. Are there any specific market keywords associated with the report?
Yes, the market keyword associated with the report is "Optical Brightener Market," which aids in identifying and referencing the specific market segment covered.
12. How do I determine which pricing option suits my needs best?
The pricing options vary based on user requirements and access needs. Individual users may opt for single-user licenses, while businesses requiring broader access may choose multi-user or enterprise licenses for cost-effective access to the report.
13. Are there any additional resources or data provided in the Optical Brightener Market report?
While the report offers comprehensive insights, it's advisable to review the specific contents or supplementary materials provided to ascertain if additional resources or data are available.
14. How can I stay updated on further developments or reports in the Optical Brightener Market?
To stay informed about further developments, trends, and reports in the Optical Brightener Market, consider subscribing to industry newsletters, following relevant companies and organizations, or regularly checking reputable industry news sources and publications.
Methodology
Step 1 - Identification of Relevant Samples Size from Population Database


Step 2 - Approaches for Defining Global Market Size (Value, Volume* & Price*)

Note*: In applicable scenarios
Step 3 - Data Sources
Primary Research
- Web Analytics
- Survey Reports
- Research Institute
- Latest Research Reports
- Opinion Leaders
Secondary Research
- Annual Reports
- White Paper
- Latest Press Release
- Industry Association
- Paid Database
- Investor Presentations

Step 4 - Data Triangulation
Involves using different sources of information in order to increase the validity of a study
These sources are likely to be stakeholders in a program - participants, other researchers, program staff, other community members, and so on.
Then we put all data in single framework & apply various statistical tools to find out the dynamic on the market.
During the analysis stage, feedback from the stakeholder groups would be compared to determine areas of agreement as well as areas of divergence