

Key Insights
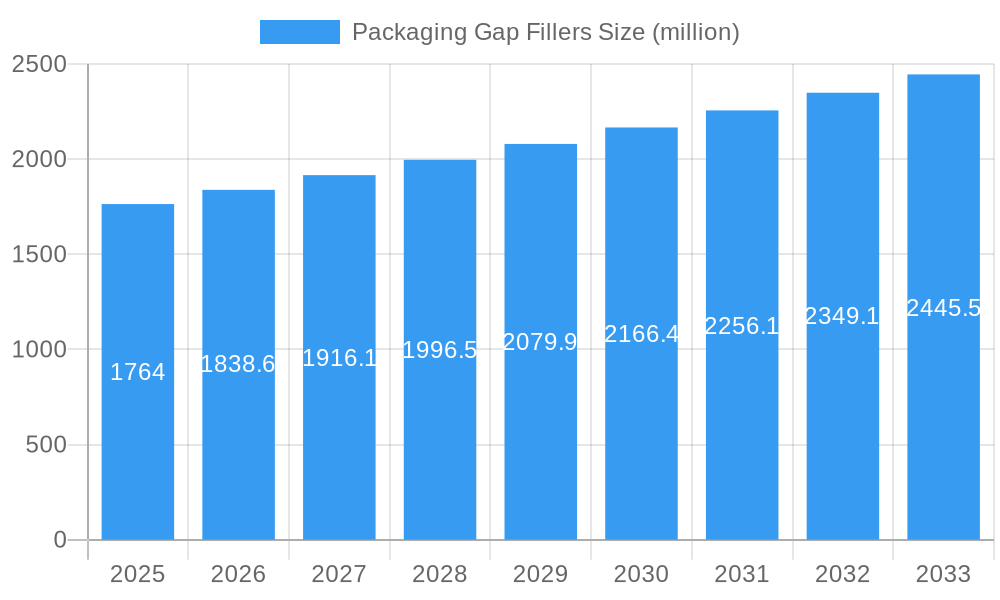
The global packaging gap fillers market, projected to reach $15.14 billion by 2025, is experiencing significant growth. This expansion is driven by the burgeoning e-commerce sector and the escalating demand for robust protective packaging solutions across diverse industries. With a Compound Annual Growth Rate (CAGR) of 14.45% between 2025 and 2033, the market demonstrates a strong upward trajectory. Key growth catalysts include the imperative for effective product protection during transit, the increasing adoption of automated packaging systems, and a heightened focus on sustainable and eco-friendly packaging materials. The surge in e-commerce necessitates efficient and cost-effective gap-filling solutions, thereby propelling market expansion. Furthermore, advancements in material science are yielding innovative gap fillers with superior cushioning, lighter weight, and enhanced recyclability, contributing to a positive market outlook.
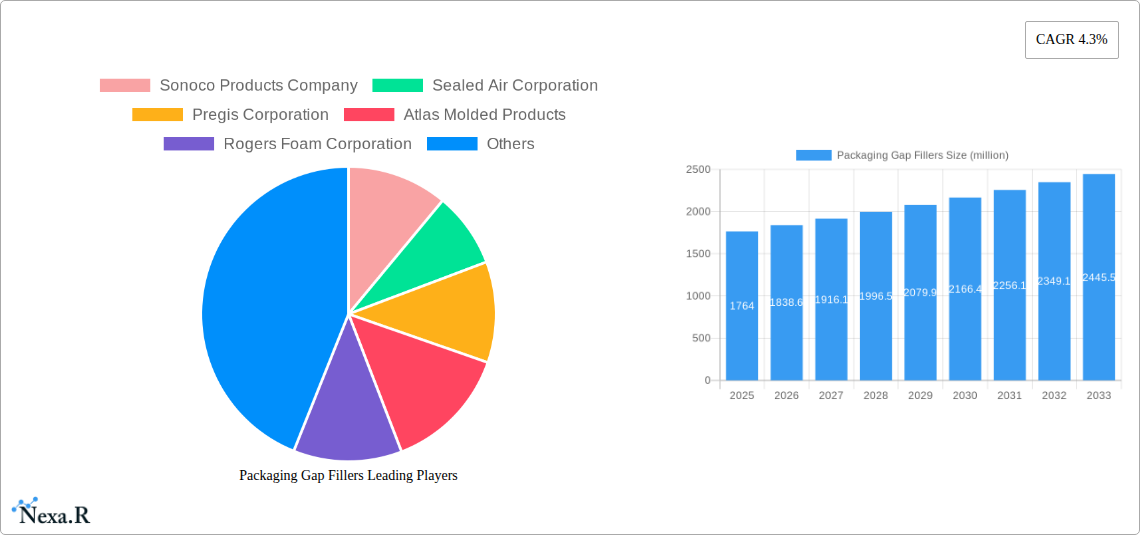
Packaging Gap Fillers Market Size (In Billion)
The forecast period from 2025 to 2033 anticipates sustained growth, primarily fueled by the continued expansion of e-commerce logistics and the increasing emphasis on supply chain resilience. Industry players are investing in research and development to create innovative, sustainable, and cost-effective gap fillers, presenting further opportunities. While challenges such as fluctuating raw material costs and environmental concerns persist, the long-term outlook for the packaging gap fillers market remains robust, underpinned by fundamental trends in global trade and evolving consumer behavior. Regional growth rates are expected to vary, with areas exhibiting higher e-commerce penetration and industrial activity likely to witness faster adoption. The market will continue to evolve, emphasizing customization, advanced material properties, and reduced environmental impact.
Packaging Gap Fillers Company Market Share
Packaging Gap Fillers Market Report: 2019-2033
This comprehensive report provides a detailed analysis of the global packaging gap fillers market, encompassing market dynamics, growth trends, regional insights, product landscape, key players, and future outlook. The study period covers 2019-2033, with 2025 as the base and estimated year. The report leverages extensive primary and secondary research to deliver actionable intelligence for industry professionals, investors, and strategic decision-makers. This report covers the parent market of Packaging and the child market of Gap Fillers.
Packaging Gap Fillers Market Dynamics & Structure
This section analyzes the competitive landscape, technological advancements, regulatory influences, and market trends within the packaging gap fillers market. The market is characterized by a moderately concentrated structure with a few dominant players and several niche competitors. The analysis includes:
- Market Concentration: The top 5 players account for approximately xx% of the global market share in 2025, with a projected xx% by 2033.
- Technological Innovation: Key drivers include advancements in material science (e.g., biodegradable fillers, customizable foam densities), automation in manufacturing processes, and the rise of sustainable packaging solutions. Innovation barriers include high R&D costs and stringent regulatory compliance.
- Regulatory Frameworks: Regulations concerning material safety, recyclability, and environmental impact significantly influence product development and market entry. Stringent regulations in regions like Europe are driving the adoption of eco-friendly gap fillers.
- Competitive Product Substitutes: Alternative packaging solutions, such as void-fill systems and inflatable packaging, pose competitive threats. The choice depends on factors such as product fragility, shipping distance, and environmental concerns.
- End-User Demographics: The report examines the various end-user segments, including e-commerce, food & beverage, pharmaceuticals, electronics, and automotive, evaluating their unique requirements and preferences for gap fillers.
- M&A Trends: The past five years have seen xx M&A deals in the gap filler market, largely driven by strategic expansion and consolidation efforts. The average deal value was approximately $xx million.
Packaging Gap Fillers Growth Trends & Insights
The global packaging gap fillers market is projected to experience robust growth during the forecast period (2025-2033). Driven by the expansion of e-commerce, increasing demand for customized packaging solutions, and the growing preference for sustainable packaging materials, the market size is estimated at xx million units in 2025 and is projected to reach xx million units by 2033, exhibiting a CAGR of xx%. This growth is fueled by several factors including:
- Increasing e-commerce sales leading to a surge in demand for effective protective packaging.
- Rising consumer awareness of environmentally friendly packaging solutions.
- The shift towards automation in packaging processes.
- Technological advancements leading to improved product quality, performance, and efficiency.
- The growing adoption of customized packaging solutions to protect diverse product types.
The market penetration rate is expected to increase from xx% in 2025 to xx% by 2033. Consumer behavior shifts toward online shopping and a preference for convenient, eco-conscious delivery models are also critical drivers of growth. Furthermore, technological disruptions, such as the introduction of innovative materials and automation technologies, are significantly enhancing the efficiency and effectiveness of packaging solutions.
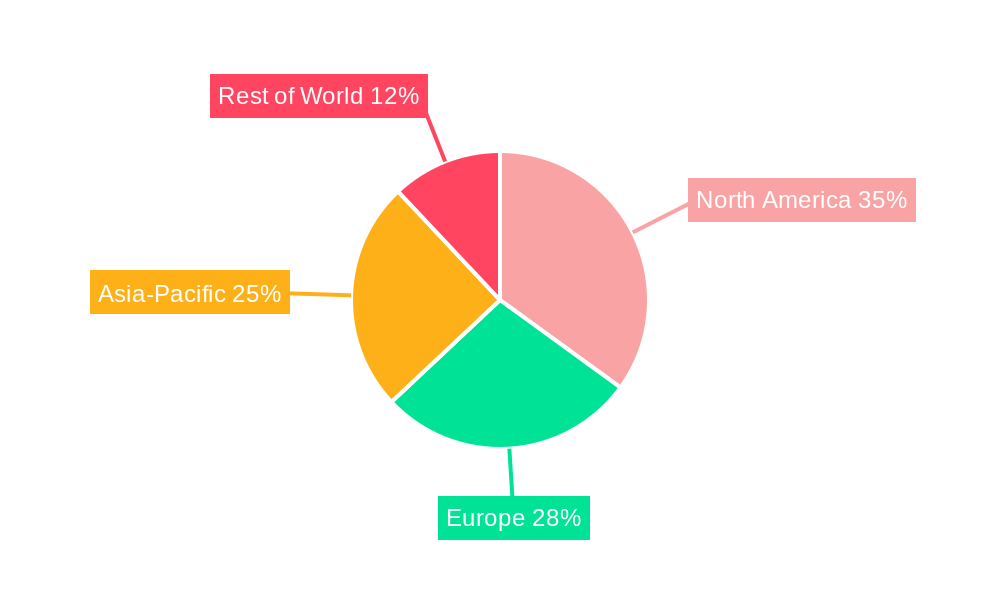
Dominant Regions, Countries, or Segments in Packaging Gap Fillers
North America currently holds the largest market share, followed by Europe and Asia Pacific. However, the Asia Pacific region is expected to witness the fastest growth rate during the forecast period, driven by rapid industrialization and e-commerce expansion.
- North America: Strong demand from the e-commerce sector and the presence of major market players contribute to its dominance. Strict regulations on packaging waste also push innovation in sustainable solutions.
- Europe: High environmental awareness and stringent regulations push the adoption of eco-friendly gap fillers. A mature market with a focus on efficient supply chains.
- Asia Pacific: Rapid growth in e-commerce, industrialization, and manufacturing sectors fuel high demand for efficient and protective packaging.
Key drivers for regional growth include:
- Economic Growth: Strong economic growth in developing economies fuels increased industrial output and consumption, driving demand for packaging solutions.
- Infrastructure Development: Improved infrastructure in developing regions facilitates smoother logistics and supply chain operations.
- Government Policies: Supportive government policies related to environmental protection and sustainable packaging practices influence market dynamics.
Packaging Gap Fillers Product Landscape
The packaging gap fillers market offers a diverse range of products, including foam-based fillers (PE, EPS, EPE), paper-based void fill, air pillows, and inflatable packaging. Innovations focus on enhanced cushioning capabilities, lightweight designs, recyclability, and biodegradability. Unique selling propositions include customization options, automated dispensing systems, and the use of recycled materials. Technological advancements are driving the development of smarter, more efficient, and sustainable gap fillers.
Key Drivers, Barriers & Challenges in Packaging Gap Fillers
Key Drivers:
- The growth of e-commerce and the need for efficient protective packaging for shipped goods.
- Increasing consumer demand for sustainable and eco-friendly packaging solutions.
- Technological advancements in materials science leading to the development of innovative gap fillers.
Key Challenges and Restraints:
- Fluctuations in raw material prices, particularly for petroleum-based materials, impacting production costs.
- Stringent environmental regulations and compliance requirements pose challenges for manufacturers.
- Intense competition among numerous players necessitates innovation and cost optimization.
Emerging Opportunities in Packaging Gap Fillers
- Expanding into emerging markets with growing e-commerce sectors.
- Developing innovative applications for gap fillers in specialized industries like pharmaceuticals and electronics.
- Focusing on the growing demand for customized, on-demand packaging solutions.
Growth Accelerators in the Packaging Gap Fillers Industry
Technological advancements, strategic partnerships, and market expansion strategies are key catalysts for long-term growth in the packaging gap fillers industry. The development of biodegradable and compostable materials, coupled with advancements in automated packaging systems, are poised to reshape the market landscape. Strategic collaborations between packaging manufacturers and logistics providers are streamlining supply chains and enhancing operational efficiency. Furthermore, expanding into untapped markets and focusing on niche applications presents significant growth opportunities.
Key Players Shaping the Packaging Gap Fillers Market
- Sonoco Products Company
- Sealed Air Corporation
- Pregis Corporation
- Atlas Molded Products
- Rogers Foam Corporation
- Plymouth Foam
- Foam Fabricators
- Tucson Container Corporation
- Plastifoam Company
- Wisconsin Foam Products
- Polyfoam Corporation
- Woodbridge
- Recticel
- Teamway
- Haijing
- Smurfit Kappa Group
- Storopack Hans Reichenecker GmbH
- FROMM Packaging Systems Inc.
- Automated Packaging Systems, Inc.
- Polyair Inter Pack
Notable Milestones in Packaging Gap Fillers Sector
- 2020: Introduction of a fully biodegradable foam gap filler by Pregis Corporation.
- 2021: Sealed Air Corporation acquires a smaller competitor, expanding its product portfolio.
- 2022: Sonoco Products Company launches a new line of sustainable paper-based void fill.
- 2023: Several key players invest heavily in automation technology to improve production efficiency.
In-Depth Packaging Gap Fillers Market Outlook
The future of the packaging gap fillers market is bright, driven by continuous innovation, the increasing preference for sustainable options, and the expansion of e-commerce globally. Strategic opportunities lie in developing customized solutions, expanding into niche markets, and strengthening supply chain partnerships. Focusing on circular economy principles and the development of completely recyclable or compostable materials will be crucial for long-term success. The market is poised for sustained growth, offering significant returns for companies that embrace innovation and adapt to evolving consumer demands.
Packaging Gap Fillers Segmentation
-
1. Application
- 1.1. Electronics
- 1.2. Consumer Goods
- 1.3. Cosmetic and Personal Care
- 1.4. Foods and Beverages
- 1.5. Pharmaceuticals
- 1.6. Others
-
2. Type
- 2.1. Expanded Polystyrene
- 2.2. Bubble Wrap
- 2.3. Others
Packaging Gap Fillers Segmentation By Geography
-
1. North America
- 1.1. United States
- 1.2. Canada
- 1.3. Mexico
-
2. South America
- 2.1. Brazil
- 2.2. Argentina
- 2.3. Rest of South America
-
3. Europe
- 3.1. United Kingdom
- 3.2. Germany
- 3.3. France
- 3.4. Italy
- 3.5. Spain
- 3.6. Russia
- 3.7. Benelux
- 3.8. Nordics
- 3.9. Rest of Europe
-
4. Middle East & Africa
- 4.1. Turkey
- 4.2. Israel
- 4.3. GCC
- 4.4. North Africa
- 4.5. South Africa
- 4.6. Rest of Middle East & Africa
-
5. Asia Pacific
- 5.1. China
- 5.2. India
- 5.3. Japan
- 5.4. South Korea
- 5.5. ASEAN
- 5.6. Oceania
- 5.7. Rest of Asia Pacific
Packaging Gap Fillers Regional Market Share
Geographic Coverage of Packaging Gap Fillers
Packaging Gap Fillers REPORT HIGHLIGHTS
| Aspects | Details |
|---|---|
| Study Period | 2020-2034 |
| Base Year | 2025 |
| Estimated Year | 2026 |
| Forecast Period | 2026-2034 |
| Historical Period | 2020-2025 |
| Growth Rate | CAGR of 14.45% from 2020-2034 |
| Segmentation |
|
Table of Contents
- 1. Introduction
- 1.1. Research Scope
- 1.2. Market Segmentation
- 1.3. Research Methodology
- 1.4. Definitions and Assumptions
- 2. Executive Summary
- 2.1. Introduction
- 3. Market Dynamics
- 3.1. Introduction
- 3.2. Market Drivers
- 3.3. Market Restrains
- 3.4. Market Trends
- 4. Market Factor Analysis
- 4.1. Porters Five Forces
- 4.2. Supply/Value Chain
- 4.3. PESTEL analysis
- 4.4. Market Entropy
- 4.5. Patent/Trademark Analysis
- 5. Global Packaging Gap Fillers Analysis, Insights and Forecast, 2020-2032
- 5.1. Market Analysis, Insights and Forecast - by Application
- 5.1.1. Electronics
- 5.1.2. Consumer Goods
- 5.1.3. Cosmetic and Personal Care
- 5.1.4. Foods and Beverages
- 5.1.5. Pharmaceuticals
- 5.1.6. Others
- 5.2. Market Analysis, Insights and Forecast - by Type
- 5.2.1. Expanded Polystyrene
- 5.2.2. Bubble Wrap
- 5.2.3. Others
- 5.3. Market Analysis, Insights and Forecast - by Region
- 5.3.1. North America
- 5.3.2. South America
- 5.3.3. Europe
- 5.3.4. Middle East & Africa
- 5.3.5. Asia Pacific
- 5.1. Market Analysis, Insights and Forecast - by Application
- 6. North America Packaging Gap Fillers Analysis, Insights and Forecast, 2020-2032
- 6.1. Market Analysis, Insights and Forecast - by Application
- 6.1.1. Electronics
- 6.1.2. Consumer Goods
- 6.1.3. Cosmetic and Personal Care
- 6.1.4. Foods and Beverages
- 6.1.5. Pharmaceuticals
- 6.1.6. Others
- 6.2. Market Analysis, Insights and Forecast - by Type
- 6.2.1. Expanded Polystyrene
- 6.2.2. Bubble Wrap
- 6.2.3. Others
- 6.1. Market Analysis, Insights and Forecast - by Application
- 7. South America Packaging Gap Fillers Analysis, Insights and Forecast, 2020-2032
- 7.1. Market Analysis, Insights and Forecast - by Application
- 7.1.1. Electronics
- 7.1.2. Consumer Goods
- 7.1.3. Cosmetic and Personal Care
- 7.1.4. Foods and Beverages
- 7.1.5. Pharmaceuticals
- 7.1.6. Others
- 7.2. Market Analysis, Insights and Forecast - by Type
- 7.2.1. Expanded Polystyrene
- 7.2.2. Bubble Wrap
- 7.2.3. Others
- 7.1. Market Analysis, Insights and Forecast - by Application
- 8. Europe Packaging Gap Fillers Analysis, Insights and Forecast, 2020-2032
- 8.1. Market Analysis, Insights and Forecast - by Application
- 8.1.1. Electronics
- 8.1.2. Consumer Goods
- 8.1.3. Cosmetic and Personal Care
- 8.1.4. Foods and Beverages
- 8.1.5. Pharmaceuticals
- 8.1.6. Others
- 8.2. Market Analysis, Insights and Forecast - by Type
- 8.2.1. Expanded Polystyrene
- 8.2.2. Bubble Wrap
- 8.2.3. Others
- 8.1. Market Analysis, Insights and Forecast - by Application
- 9. Middle East & Africa Packaging Gap Fillers Analysis, Insights and Forecast, 2020-2032
- 9.1. Market Analysis, Insights and Forecast - by Application
- 9.1.1. Electronics
- 9.1.2. Consumer Goods
- 9.1.3. Cosmetic and Personal Care
- 9.1.4. Foods and Beverages
- 9.1.5. Pharmaceuticals
- 9.1.6. Others
- 9.2. Market Analysis, Insights and Forecast - by Type
- 9.2.1. Expanded Polystyrene
- 9.2.2. Bubble Wrap
- 9.2.3. Others
- 9.1. Market Analysis, Insights and Forecast - by Application
- 10. Asia Pacific Packaging Gap Fillers Analysis, Insights and Forecast, 2020-2032
- 10.1. Market Analysis, Insights and Forecast - by Application
- 10.1.1. Electronics
- 10.1.2. Consumer Goods
- 10.1.3. Cosmetic and Personal Care
- 10.1.4. Foods and Beverages
- 10.1.5. Pharmaceuticals
- 10.1.6. Others
- 10.2. Market Analysis, Insights and Forecast - by Type
- 10.2.1. Expanded Polystyrene
- 10.2.2. Bubble Wrap
- 10.2.3. Others
- 10.1. Market Analysis, Insights and Forecast - by Application
- 11. Competitive Analysis
- 11.1. Global Market Share Analysis 2025
- 11.2. Company Profiles
- 11.2.1 Sonoco Products Company
- 11.2.1.1. Overview
- 11.2.1.2. Products
- 11.2.1.3. SWOT Analysis
- 11.2.1.4. Recent Developments
- 11.2.1.5. Financials (Based on Availability)
- 11.2.2 Sealed Air Corporation
- 11.2.2.1. Overview
- 11.2.2.2. Products
- 11.2.2.3. SWOT Analysis
- 11.2.2.4. Recent Developments
- 11.2.2.5. Financials (Based on Availability)
- 11.2.3 Pregis Corporation
- 11.2.3.1. Overview
- 11.2.3.2. Products
- 11.2.3.3. SWOT Analysis
- 11.2.3.4. Recent Developments
- 11.2.3.5. Financials (Based on Availability)
- 11.2.4 Atlas Molded Products
- 11.2.4.1. Overview
- 11.2.4.2. Products
- 11.2.4.3. SWOT Analysis
- 11.2.4.4. Recent Developments
- 11.2.4.5. Financials (Based on Availability)
- 11.2.5 Rogers Foam Corporation
- 11.2.5.1. Overview
- 11.2.5.2. Products
- 11.2.5.3. SWOT Analysis
- 11.2.5.4. Recent Developments
- 11.2.5.5. Financials (Based on Availability)
- 11.2.6 Plymouth Foam
- 11.2.6.1. Overview
- 11.2.6.2. Products
- 11.2.6.3. SWOT Analysis
- 11.2.6.4. Recent Developments
- 11.2.6.5. Financials (Based on Availability)
- 11.2.7 Foam Fabricators
- 11.2.7.1. Overview
- 11.2.7.2. Products
- 11.2.7.3. SWOT Analysis
- 11.2.7.4. Recent Developments
- 11.2.7.5. Financials (Based on Availability)
- 11.2.8 Tucson Container Corporation
- 11.2.8.1. Overview
- 11.2.8.2. Products
- 11.2.8.3. SWOT Analysis
- 11.2.8.4. Recent Developments
- 11.2.8.5. Financials (Based on Availability)
- 11.2.9 Plastifoam Company
- 11.2.9.1. Overview
- 11.2.9.2. Products
- 11.2.9.3. SWOT Analysis
- 11.2.9.4. Recent Developments
- 11.2.9.5. Financials (Based on Availability)
- 11.2.10 Wisconsin Foam Products
- 11.2.10.1. Overview
- 11.2.10.2. Products
- 11.2.10.3. SWOT Analysis
- 11.2.10.4. Recent Developments
- 11.2.10.5. Financials (Based on Availability)
- 11.2.11 Polyfoam Corporation
- 11.2.11.1. Overview
- 11.2.11.2. Products
- 11.2.11.3. SWOT Analysis
- 11.2.11.4. Recent Developments
- 11.2.11.5. Financials (Based on Availability)
- 11.2.12 Woodbridge
- 11.2.12.1. Overview
- 11.2.12.2. Products
- 11.2.12.3. SWOT Analysis
- 11.2.12.4. Recent Developments
- 11.2.12.5. Financials (Based on Availability)
- 11.2.13 Recticel
- 11.2.13.1. Overview
- 11.2.13.2. Products
- 11.2.13.3. SWOT Analysis
- 11.2.13.4. Recent Developments
- 11.2.13.5. Financials (Based on Availability)
- 11.2.14 Teamway
- 11.2.14.1. Overview
- 11.2.14.2. Products
- 11.2.14.3. SWOT Analysis
- 11.2.14.4. Recent Developments
- 11.2.14.5. Financials (Based on Availability)
- 11.2.15 Haijing
- 11.2.15.1. Overview
- 11.2.15.2. Products
- 11.2.15.3. SWOT Analysis
- 11.2.15.4. Recent Developments
- 11.2.15.5. Financials (Based on Availability)
- 11.2.16 Smurfit Kappa Group
- 11.2.16.1. Overview
- 11.2.16.2. Products
- 11.2.16.3. SWOT Analysis
- 11.2.16.4. Recent Developments
- 11.2.16.5. Financials (Based on Availability)
- 11.2.17 Storopack Hans Reichenecker GmbH
- 11.2.17.1. Overview
- 11.2.17.2. Products
- 11.2.17.3. SWOT Analysis
- 11.2.17.4. Recent Developments
- 11.2.17.5. Financials (Based on Availability)
- 11.2.18 FROMM Packaging Systems Inc.
- 11.2.18.1. Overview
- 11.2.18.2. Products
- 11.2.18.3. SWOT Analysis
- 11.2.18.4. Recent Developments
- 11.2.18.5. Financials (Based on Availability)
- 11.2.19 Automated Packaging Systems Inc.
- 11.2.19.1. Overview
- 11.2.19.2. Products
- 11.2.19.3. SWOT Analysis
- 11.2.19.4. Recent Developments
- 11.2.19.5. Financials (Based on Availability)
- 11.2.20 Polyair Inter Pack
- 11.2.20.1. Overview
- 11.2.20.2. Products
- 11.2.20.3. SWOT Analysis
- 11.2.20.4. Recent Developments
- 11.2.20.5. Financials (Based on Availability)
- 11.2.1 Sonoco Products Company
List of Figures
- Figure 1: Global Packaging Gap Fillers Revenue Breakdown (billion, %) by Region 2025 & 2033
- Figure 2: Global Packaging Gap Fillers Volume Breakdown (K, %) by Region 2025 & 2033
- Figure 3: North America Packaging Gap Fillers Revenue (billion), by Application 2025 & 2033
- Figure 4: North America Packaging Gap Fillers Volume (K), by Application 2025 & 2033
- Figure 5: North America Packaging Gap Fillers Revenue Share (%), by Application 2025 & 2033
- Figure 6: North America Packaging Gap Fillers Volume Share (%), by Application 2025 & 2033
- Figure 7: North America Packaging Gap Fillers Revenue (billion), by Type 2025 & 2033
- Figure 8: North America Packaging Gap Fillers Volume (K), by Type 2025 & 2033
- Figure 9: North America Packaging Gap Fillers Revenue Share (%), by Type 2025 & 2033
- Figure 10: North America Packaging Gap Fillers Volume Share (%), by Type 2025 & 2033
- Figure 11: North America Packaging Gap Fillers Revenue (billion), by Country 2025 & 2033
- Figure 12: North America Packaging Gap Fillers Volume (K), by Country 2025 & 2033
- Figure 13: North America Packaging Gap Fillers Revenue Share (%), by Country 2025 & 2033
- Figure 14: North America Packaging Gap Fillers Volume Share (%), by Country 2025 & 2033
- Figure 15: South America Packaging Gap Fillers Revenue (billion), by Application 2025 & 2033
- Figure 16: South America Packaging Gap Fillers Volume (K), by Application 2025 & 2033
- Figure 17: South America Packaging Gap Fillers Revenue Share (%), by Application 2025 & 2033
- Figure 18: South America Packaging Gap Fillers Volume Share (%), by Application 2025 & 2033
- Figure 19: South America Packaging Gap Fillers Revenue (billion), by Type 2025 & 2033
- Figure 20: South America Packaging Gap Fillers Volume (K), by Type 2025 & 2033
- Figure 21: South America Packaging Gap Fillers Revenue Share (%), by Type 2025 & 2033
- Figure 22: South America Packaging Gap Fillers Volume Share (%), by Type 2025 & 2033
- Figure 23: South America Packaging Gap Fillers Revenue (billion), by Country 2025 & 2033
- Figure 24: South America Packaging Gap Fillers Volume (K), by Country 2025 & 2033
- Figure 25: South America Packaging Gap Fillers Revenue Share (%), by Country 2025 & 2033
- Figure 26: South America Packaging Gap Fillers Volume Share (%), by Country 2025 & 2033
- Figure 27: Europe Packaging Gap Fillers Revenue (billion), by Application 2025 & 2033
- Figure 28: Europe Packaging Gap Fillers Volume (K), by Application 2025 & 2033
- Figure 29: Europe Packaging Gap Fillers Revenue Share (%), by Application 2025 & 2033
- Figure 30: Europe Packaging Gap Fillers Volume Share (%), by Application 2025 & 2033
- Figure 31: Europe Packaging Gap Fillers Revenue (billion), by Type 2025 & 2033
- Figure 32: Europe Packaging Gap Fillers Volume (K), by Type 2025 & 2033
- Figure 33: Europe Packaging Gap Fillers Revenue Share (%), by Type 2025 & 2033
- Figure 34: Europe Packaging Gap Fillers Volume Share (%), by Type 2025 & 2033
- Figure 35: Europe Packaging Gap Fillers Revenue (billion), by Country 2025 & 2033
- Figure 36: Europe Packaging Gap Fillers Volume (K), by Country 2025 & 2033
- Figure 37: Europe Packaging Gap Fillers Revenue Share (%), by Country 2025 & 2033
- Figure 38: Europe Packaging Gap Fillers Volume Share (%), by Country 2025 & 2033
- Figure 39: Middle East & Africa Packaging Gap Fillers Revenue (billion), by Application 2025 & 2033
- Figure 40: Middle East & Africa Packaging Gap Fillers Volume (K), by Application 2025 & 2033
- Figure 41: Middle East & Africa Packaging Gap Fillers Revenue Share (%), by Application 2025 & 2033
- Figure 42: Middle East & Africa Packaging Gap Fillers Volume Share (%), by Application 2025 & 2033
- Figure 43: Middle East & Africa Packaging Gap Fillers Revenue (billion), by Type 2025 & 2033
- Figure 44: Middle East & Africa Packaging Gap Fillers Volume (K), by Type 2025 & 2033
- Figure 45: Middle East & Africa Packaging Gap Fillers Revenue Share (%), by Type 2025 & 2033
- Figure 46: Middle East & Africa Packaging Gap Fillers Volume Share (%), by Type 2025 & 2033
- Figure 47: Middle East & Africa Packaging Gap Fillers Revenue (billion), by Country 2025 & 2033
- Figure 48: Middle East & Africa Packaging Gap Fillers Volume (K), by Country 2025 & 2033
- Figure 49: Middle East & Africa Packaging Gap Fillers Revenue Share (%), by Country 2025 & 2033
- Figure 50: Middle East & Africa Packaging Gap Fillers Volume Share (%), by Country 2025 & 2033
- Figure 51: Asia Pacific Packaging Gap Fillers Revenue (billion), by Application 2025 & 2033
- Figure 52: Asia Pacific Packaging Gap Fillers Volume (K), by Application 2025 & 2033
- Figure 53: Asia Pacific Packaging Gap Fillers Revenue Share (%), by Application 2025 & 2033
- Figure 54: Asia Pacific Packaging Gap Fillers Volume Share (%), by Application 2025 & 2033
- Figure 55: Asia Pacific Packaging Gap Fillers Revenue (billion), by Type 2025 & 2033
- Figure 56: Asia Pacific Packaging Gap Fillers Volume (K), by Type 2025 & 2033
- Figure 57: Asia Pacific Packaging Gap Fillers Revenue Share (%), by Type 2025 & 2033
- Figure 58: Asia Pacific Packaging Gap Fillers Volume Share (%), by Type 2025 & 2033
- Figure 59: Asia Pacific Packaging Gap Fillers Revenue (billion), by Country 2025 & 2033
- Figure 60: Asia Pacific Packaging Gap Fillers Volume (K), by Country 2025 & 2033
- Figure 61: Asia Pacific Packaging Gap Fillers Revenue Share (%), by Country 2025 & 2033
- Figure 62: Asia Pacific Packaging Gap Fillers Volume Share (%), by Country 2025 & 2033
List of Tables
- Table 1: Global Packaging Gap Fillers Revenue billion Forecast, by Application 2020 & 2033
- Table 2: Global Packaging Gap Fillers Volume K Forecast, by Application 2020 & 2033
- Table 3: Global Packaging Gap Fillers Revenue billion Forecast, by Type 2020 & 2033
- Table 4: Global Packaging Gap Fillers Volume K Forecast, by Type 2020 & 2033
- Table 5: Global Packaging Gap Fillers Revenue billion Forecast, by Region 2020 & 2033
- Table 6: Global Packaging Gap Fillers Volume K Forecast, by Region 2020 & 2033
- Table 7: Global Packaging Gap Fillers Revenue billion Forecast, by Application 2020 & 2033
- Table 8: Global Packaging Gap Fillers Volume K Forecast, by Application 2020 & 2033
- Table 9: Global Packaging Gap Fillers Revenue billion Forecast, by Type 2020 & 2033
- Table 10: Global Packaging Gap Fillers Volume K Forecast, by Type 2020 & 2033
- Table 11: Global Packaging Gap Fillers Revenue billion Forecast, by Country 2020 & 2033
- Table 12: Global Packaging Gap Fillers Volume K Forecast, by Country 2020 & 2033
- Table 13: United States Packaging Gap Fillers Revenue (billion) Forecast, by Application 2020 & 2033
- Table 14: United States Packaging Gap Fillers Volume (K) Forecast, by Application 2020 & 2033
- Table 15: Canada Packaging Gap Fillers Revenue (billion) Forecast, by Application 2020 & 2033
- Table 16: Canada Packaging Gap Fillers Volume (K) Forecast, by Application 2020 & 2033
- Table 17: Mexico Packaging Gap Fillers Revenue (billion) Forecast, by Application 2020 & 2033
- Table 18: Mexico Packaging Gap Fillers Volume (K) Forecast, by Application 2020 & 2033
- Table 19: Global Packaging Gap Fillers Revenue billion Forecast, by Application 2020 & 2033
- Table 20: Global Packaging Gap Fillers Volume K Forecast, by Application 2020 & 2033
- Table 21: Global Packaging Gap Fillers Revenue billion Forecast, by Type 2020 & 2033
- Table 22: Global Packaging Gap Fillers Volume K Forecast, by Type 2020 & 2033
- Table 23: Global Packaging Gap Fillers Revenue billion Forecast, by Country 2020 & 2033
- Table 24: Global Packaging Gap Fillers Volume K Forecast, by Country 2020 & 2033
- Table 25: Brazil Packaging Gap Fillers Revenue (billion) Forecast, by Application 2020 & 2033
- Table 26: Brazil Packaging Gap Fillers Volume (K) Forecast, by Application 2020 & 2033
- Table 27: Argentina Packaging Gap Fillers Revenue (billion) Forecast, by Application 2020 & 2033
- Table 28: Argentina Packaging Gap Fillers Volume (K) Forecast, by Application 2020 & 2033
- Table 29: Rest of South America Packaging Gap Fillers Revenue (billion) Forecast, by Application 2020 & 2033
- Table 30: Rest of South America Packaging Gap Fillers Volume (K) Forecast, by Application 2020 & 2033
- Table 31: Global Packaging Gap Fillers Revenue billion Forecast, by Application 2020 & 2033
- Table 32: Global Packaging Gap Fillers Volume K Forecast, by Application 2020 & 2033
- Table 33: Global Packaging Gap Fillers Revenue billion Forecast, by Type 2020 & 2033
- Table 34: Global Packaging Gap Fillers Volume K Forecast, by Type 2020 & 2033
- Table 35: Global Packaging Gap Fillers Revenue billion Forecast, by Country 2020 & 2033
- Table 36: Global Packaging Gap Fillers Volume K Forecast, by Country 2020 & 2033
- Table 37: United Kingdom Packaging Gap Fillers Revenue (billion) Forecast, by Application 2020 & 2033
- Table 38: United Kingdom Packaging Gap Fillers Volume (K) Forecast, by Application 2020 & 2033
- Table 39: Germany Packaging Gap Fillers Revenue (billion) Forecast, by Application 2020 & 2033
- Table 40: Germany Packaging Gap Fillers Volume (K) Forecast, by Application 2020 & 2033
- Table 41: France Packaging Gap Fillers Revenue (billion) Forecast, by Application 2020 & 2033
- Table 42: France Packaging Gap Fillers Volume (K) Forecast, by Application 2020 & 2033
- Table 43: Italy Packaging Gap Fillers Revenue (billion) Forecast, by Application 2020 & 2033
- Table 44: Italy Packaging Gap Fillers Volume (K) Forecast, by Application 2020 & 2033
- Table 45: Spain Packaging Gap Fillers Revenue (billion) Forecast, by Application 2020 & 2033
- Table 46: Spain Packaging Gap Fillers Volume (K) Forecast, by Application 2020 & 2033
- Table 47: Russia Packaging Gap Fillers Revenue (billion) Forecast, by Application 2020 & 2033
- Table 48: Russia Packaging Gap Fillers Volume (K) Forecast, by Application 2020 & 2033
- Table 49: Benelux Packaging Gap Fillers Revenue (billion) Forecast, by Application 2020 & 2033
- Table 50: Benelux Packaging Gap Fillers Volume (K) Forecast, by Application 2020 & 2033
- Table 51: Nordics Packaging Gap Fillers Revenue (billion) Forecast, by Application 2020 & 2033
- Table 52: Nordics Packaging Gap Fillers Volume (K) Forecast, by Application 2020 & 2033
- Table 53: Rest of Europe Packaging Gap Fillers Revenue (billion) Forecast, by Application 2020 & 2033
- Table 54: Rest of Europe Packaging Gap Fillers Volume (K) Forecast, by Application 2020 & 2033
- Table 55: Global Packaging Gap Fillers Revenue billion Forecast, by Application 2020 & 2033
- Table 56: Global Packaging Gap Fillers Volume K Forecast, by Application 2020 & 2033
- Table 57: Global Packaging Gap Fillers Revenue billion Forecast, by Type 2020 & 2033
- Table 58: Global Packaging Gap Fillers Volume K Forecast, by Type 2020 & 2033
- Table 59: Global Packaging Gap Fillers Revenue billion Forecast, by Country 2020 & 2033
- Table 60: Global Packaging Gap Fillers Volume K Forecast, by Country 2020 & 2033
- Table 61: Turkey Packaging Gap Fillers Revenue (billion) Forecast, by Application 2020 & 2033
- Table 62: Turkey Packaging Gap Fillers Volume (K) Forecast, by Application 2020 & 2033
- Table 63: Israel Packaging Gap Fillers Revenue (billion) Forecast, by Application 2020 & 2033
- Table 64: Israel Packaging Gap Fillers Volume (K) Forecast, by Application 2020 & 2033
- Table 65: GCC Packaging Gap Fillers Revenue (billion) Forecast, by Application 2020 & 2033
- Table 66: GCC Packaging Gap Fillers Volume (K) Forecast, by Application 2020 & 2033
- Table 67: North Africa Packaging Gap Fillers Revenue (billion) Forecast, by Application 2020 & 2033
- Table 68: North Africa Packaging Gap Fillers Volume (K) Forecast, by Application 2020 & 2033
- Table 69: South Africa Packaging Gap Fillers Revenue (billion) Forecast, by Application 2020 & 2033
- Table 70: South Africa Packaging Gap Fillers Volume (K) Forecast, by Application 2020 & 2033
- Table 71: Rest of Middle East & Africa Packaging Gap Fillers Revenue (billion) Forecast, by Application 2020 & 2033
- Table 72: Rest of Middle East & Africa Packaging Gap Fillers Volume (K) Forecast, by Application 2020 & 2033
- Table 73: Global Packaging Gap Fillers Revenue billion Forecast, by Application 2020 & 2033
- Table 74: Global Packaging Gap Fillers Volume K Forecast, by Application 2020 & 2033
- Table 75: Global Packaging Gap Fillers Revenue billion Forecast, by Type 2020 & 2033
- Table 76: Global Packaging Gap Fillers Volume K Forecast, by Type 2020 & 2033
- Table 77: Global Packaging Gap Fillers Revenue billion Forecast, by Country 2020 & 2033
- Table 78: Global Packaging Gap Fillers Volume K Forecast, by Country 2020 & 2033
- Table 79: China Packaging Gap Fillers Revenue (billion) Forecast, by Application 2020 & 2033
- Table 80: China Packaging Gap Fillers Volume (K) Forecast, by Application 2020 & 2033
- Table 81: India Packaging Gap Fillers Revenue (billion) Forecast, by Application 2020 & 2033
- Table 82: India Packaging Gap Fillers Volume (K) Forecast, by Application 2020 & 2033
- Table 83: Japan Packaging Gap Fillers Revenue (billion) Forecast, by Application 2020 & 2033
- Table 84: Japan Packaging Gap Fillers Volume (K) Forecast, by Application 2020 & 2033
- Table 85: South Korea Packaging Gap Fillers Revenue (billion) Forecast, by Application 2020 & 2033
- Table 86: South Korea Packaging Gap Fillers Volume (K) Forecast, by Application 2020 & 2033
- Table 87: ASEAN Packaging Gap Fillers Revenue (billion) Forecast, by Application 2020 & 2033
- Table 88: ASEAN Packaging Gap Fillers Volume (K) Forecast, by Application 2020 & 2033
- Table 89: Oceania Packaging Gap Fillers Revenue (billion) Forecast, by Application 2020 & 2033
- Table 90: Oceania Packaging Gap Fillers Volume (K) Forecast, by Application 2020 & 2033
- Table 91: Rest of Asia Pacific Packaging Gap Fillers Revenue (billion) Forecast, by Application 2020 & 2033
- Table 92: Rest of Asia Pacific Packaging Gap Fillers Volume (K) Forecast, by Application 2020 & 2033
Frequently Asked Questions
1. What is the projected Compound Annual Growth Rate (CAGR) of the Packaging Gap Fillers?
The projected CAGR is approximately 14.45%.
2. Which companies are prominent players in the Packaging Gap Fillers?
Key companies in the market include Sonoco Products Company, Sealed Air Corporation, Pregis Corporation, Atlas Molded Products, Rogers Foam Corporation, Plymouth Foam, Foam Fabricators, Tucson Container Corporation, Plastifoam Company, Wisconsin Foam Products, Polyfoam Corporation, Woodbridge, Recticel, Teamway, Haijing, Smurfit Kappa Group, Storopack Hans Reichenecker GmbH, FROMM Packaging Systems Inc., Automated Packaging Systems, Inc., Polyair Inter Pack.
3. What are the main segments of the Packaging Gap Fillers?
The market segments include Application, Type.
4. Can you provide details about the market size?
The market size is estimated to be USD 15.14 billion as of 2022.
5. What are some drivers contributing to market growth?
N/A
6. What are the notable trends driving market growth?
N/A
7. Are there any restraints impacting market growth?
N/A
8. Can you provide examples of recent developments in the market?
N/A
9. What pricing options are available for accessing the report?
Pricing options include single-user, multi-user, and enterprise licenses priced at USD 3950.00, USD 5925.00, and USD 7900.00 respectively.
10. Is the market size provided in terms of value or volume?
The market size is provided in terms of value, measured in billion and volume, measured in K.
11. Are there any specific market keywords associated with the report?
Yes, the market keyword associated with the report is "Packaging Gap Fillers," which aids in identifying and referencing the specific market segment covered.
12. How do I determine which pricing option suits my needs best?
The pricing options vary based on user requirements and access needs. Individual users may opt for single-user licenses, while businesses requiring broader access may choose multi-user or enterprise licenses for cost-effective access to the report.
13. Are there any additional resources or data provided in the Packaging Gap Fillers report?
While the report offers comprehensive insights, it's advisable to review the specific contents or supplementary materials provided to ascertain if additional resources or data are available.
14. How can I stay updated on further developments or reports in the Packaging Gap Fillers?
To stay informed about further developments, trends, and reports in the Packaging Gap Fillers, consider subscribing to industry newsletters, following relevant companies and organizations, or regularly checking reputable industry news sources and publications.
Methodology
Step 1 - Identification of Relevant Samples Size from Population Database


Step 2 - Approaches for Defining Global Market Size (Value, Volume* & Price*)

Note*: In applicable scenarios
Step 3 - Data Sources
Primary Research
- Web Analytics
- Survey Reports
- Research Institute
- Latest Research Reports
- Opinion Leaders
Secondary Research
- Annual Reports
- White Paper
- Latest Press Release
- Industry Association
- Paid Database
- Investor Presentations

Step 4 - Data Triangulation
Involves using different sources of information in order to increase the validity of a study
These sources are likely to be stakeholders in a program - participants, other researchers, program staff, other community members, and so on.
Then we put all data in single framework & apply various statistical tools to find out the dynamic on the market.
During the analysis stage, feedback from the stakeholder groups would be compared to determine areas of agreement as well as areas of divergence