

Key Insights
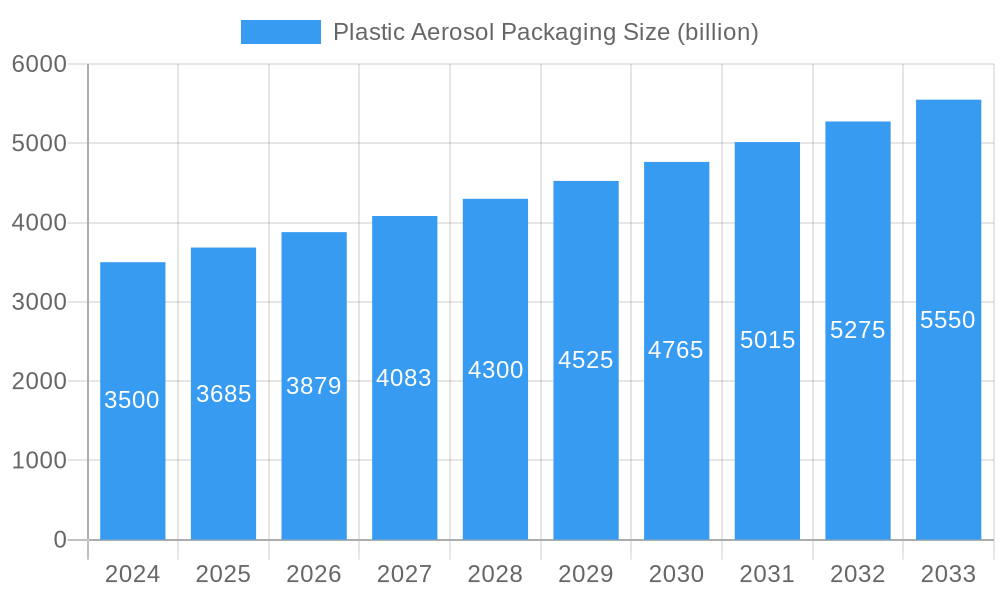
The global plastic aerosol packaging market is projected for substantial growth, driven by the escalating demand for convenient and lightweight packaging solutions across diverse industries. Key growth drivers include the increasing popularity of aerosol products in personal care, household cleaning, and industrial sectors. Consumer preference for portable and user-friendly products, alongside advancements in plastic material technology offering sustainable and recyclable options, are significant contributors. The cost-effectiveness of plastic packaging further supports its widespread adoption. The market is segmented by material type (e.g., HDPE, PET, PP), application (personal care, household, industrial), and geography. The estimated market size for 2024 is $3.5 billion, with a projected compound annual growth rate (CAGR) of 5.2% from 2024 to 2033. Sustained demand across existing segments and emerging applications will fuel this expansion.
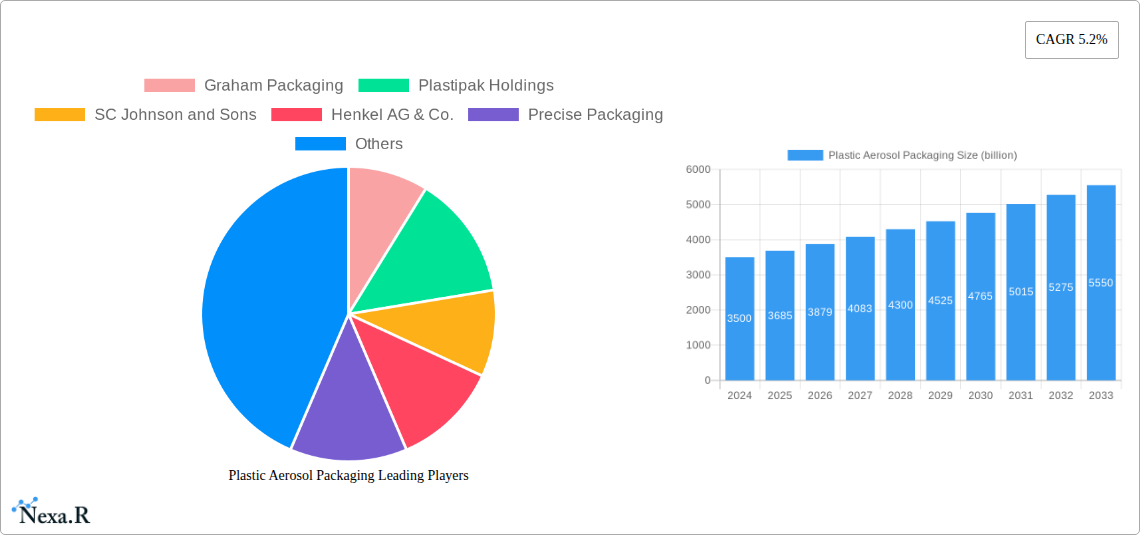
Plastic Aerosol Packaging Market Size (In Billion)
Despite positive growth, the market confronts challenges stemming from environmental concerns regarding plastic waste and evolving regulatory landscapes. This necessitates a transition towards sustainable practices, including the development of biodegradable and recyclable plastic aerosols, and the implementation of lightweighting strategies to minimize material usage. Leading companies are actively investing in research and development to address these challenges and meet the demand for eco-friendly packaging alternatives. The competitive environment, featuring both established multinational corporations and niche manufacturers, fosters innovation and competition. The ongoing shift towards sustainable solutions will fundamentally shape the market's long-term growth, particularly through investments in eco-friendly materials and advanced technologies.
Plastic Aerosol Packaging Company Market Share
Plastic Aerosol Packaging Market Report: 2019-2033
This comprehensive report provides a detailed analysis of the global plastic aerosol packaging market, encompassing market dynamics, growth trends, regional segmentation, product landscape, key players, and future outlook. The study period covers 2019-2033, with 2025 as the base and estimated year. The forecast period extends from 2025 to 2033, while the historical period analyzed is 2019-2024. The report offers crucial insights for industry professionals, investors, and stakeholders seeking to understand and navigate this dynamic market. This in-depth analysis covers both the parent market of packaging and the child market of aerosol packaging, providing a holistic view of market opportunities and challenges.
Expected Market Size (million units): xx (2025), xx (2033)
Plastic Aerosol Packaging Market Dynamics & Structure
The plastic aerosol packaging market is characterized by moderate concentration, with key players holding significant market share. Technological innovation, particularly in sustainable materials and lightweight designs, is a primary growth driver. Stringent regulatory frameworks regarding plastic waste are shaping market dynamics, pushing manufacturers towards eco-friendly solutions. Competition from alternative packaging materials, such as aluminum and glass, presents a challenge. The end-user demographics, primarily driven by the personal care, household products, and pharmaceutical industries, are influential in market growth. Mergers and acquisitions (M&A) activity within the industry is relatively frequent, driving consolidation and innovation.
- Market Concentration: Moderately concentrated, with top 5 players holding approximately xx% market share in 2025.
- Technological Innovation: Focus on lightweighting, sustainable materials (bioplastics, recycled content), and improved barrier properties.
- Regulatory Landscape: Increasingly stringent regulations on plastic waste management in various regions (e.g., EU's Single-Use Plastics Directive) drive demand for sustainable alternatives.
- Competitive Substitutes: Aluminum, glass, and alternative dispensing systems (e.g., pump sprays) pose competitive challenges.
- End-User Demographics: Personal care, household products, pharmaceuticals, and insecticides are major end-use sectors.
- M&A Activity: An estimated xx M&A deals occurred between 2019 and 2024, with a focus on acquiring specialized technologies and expanding geographical reach.
Plastic Aerosol Packaging Growth Trends & Insights
The plastic aerosol packaging market has witnessed consistent growth over the historical period (2019-2024), driven by increasing demand from diverse end-use sectors. The market is projected to maintain a healthy Compound Annual Growth Rate (CAGR) of xx% during the forecast period (2025-2033). Technological disruptions, such as the adoption of advanced barrier materials and innovative dispensing mechanisms, are boosting market adoption. Consumer preference for convenient and user-friendly packaging also fuels market expansion. Shifting consumer behavior towards sustainable and eco-friendly products is gradually influencing packaging choices, pushing innovation towards biodegradable and recyclable solutions.
- Market Size Evolution: Steady growth observed between 2019 and 2024, expected acceleration during the forecast period.
- Adoption Rates: High adoption in established markets, with growth opportunities in emerging economies.
- Technological Disruptions: Advances in materials science and dispensing technology driving market innovation.
- Consumer Behavior Shifts: Growing demand for sustainable and recyclable packaging influencing product development.
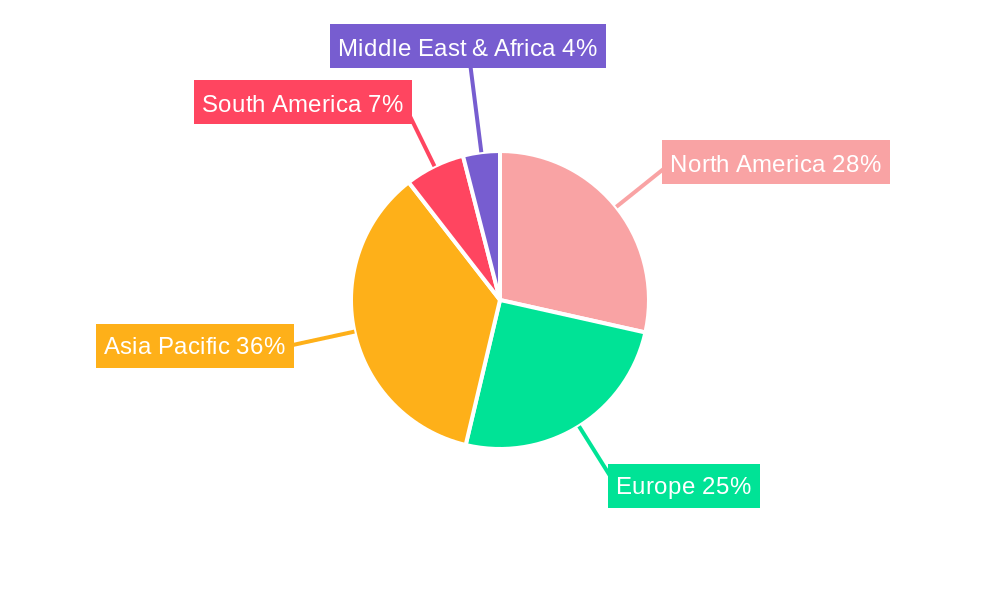
Dominant Regions, Countries, or Segments in Plastic Aerosol Packaging
North America and Europe currently dominate the plastic aerosol packaging market due to high per capita consumption, established infrastructure, and strong regulatory frameworks promoting sustainable packaging. However, Asia-Pacific is poised for significant growth, driven by rising disposable incomes, expanding end-use sectors, and burgeoning demand for convenience products. The personal care segment currently holds the largest market share, but the household products and pharmaceutical segments are anticipated to witness considerable growth over the forecast period.
- North America: High per capita consumption, well-established infrastructure, and a strong regulatory focus on sustainability.
- Europe: Similar to North America, strong consumer base, robust regulatory framework, and established industry players.
- Asia-Pacific: Rapid economic growth, rising disposable incomes, expanding end-use sectors, and a growing population fuel market expansion.
- Key Drivers: Economic development, increasing disposable incomes, expanding middle class, and government initiatives promoting industrial growth and sustainable packaging.
Plastic Aerosol Packaging Product Landscape
Plastic aerosol packaging encompasses a wide range of products designed for diverse applications, including personal care (deodorants, hairsprays), household products (air fresheners, insecticides), and pharmaceuticals. Innovation focuses on improving barrier properties to maintain product integrity, lightweighting for cost and environmental benefits, and incorporating sustainable materials. Unique selling propositions include enhanced dispensing mechanisms, improved aesthetics, and incorporation of recycled content. Technological advancements center on barrier film technologies, smart packaging solutions, and sustainable material alternatives.
Key Drivers, Barriers & Challenges in Plastic Aerosol Packaging
Key Drivers:
- Growing demand from key end-use sectors (personal care, household products, pharmaceuticals).
- Technological innovations enhancing product performance and sustainability.
- Favorable regulatory policies in some regions promoting sustainable packaging.
Key Challenges and Restraints:
- Concerns regarding plastic waste and environmental impact.
- Stringent regulations promoting reduction in plastic usage.
- Competition from alternative packaging materials.
- Fluctuations in raw material prices.
- Supply chain disruptions impacting production and delivery.
Emerging Opportunities in Plastic Aerosol Packaging
- Growing demand for sustainable and eco-friendly packaging solutions opens opportunities for biodegradable and recyclable alternatives.
- Expanding demand in emerging markets presents growth potential.
- Innovative dispensing mechanisms and smart packaging solutions offer lucrative opportunities.
Growth Accelerators in the Plastic Aerosol Packaging Industry
Technological advancements in materials science, improved barrier film technologies, and the development of more sustainable and recyclable materials will be major catalysts for growth. Strategic partnerships between packaging manufacturers and brand owners to co-develop innovative and sustainable packaging solutions will drive market expansion. Expansion into new geographical markets, particularly in developing economies with growing consumer bases, will create further growth opportunities.
Key Players Shaping the Plastic Aerosol Packaging Market
- Graham Packaging
- Plastipak Holdings
- SC Johnson and Sons
- Henkel AG & Co.
- Precise Packaging
- Febereze
- Airopack
- Coster
- Crown Holding
- Montebello Packaging
Notable Milestones in Plastic Aerosol Packaging Sector
- 2021: Launch of a new biodegradable plastic aerosol can by a major packaging manufacturer.
- 2022: Several key players announce significant investments in R&D for sustainable packaging solutions.
- 2023: Introduction of a new recyclable plastic aerosol can with improved barrier properties.
- 2024: A major merger between two leading players reshapes the competitive landscape.
In-Depth Plastic Aerosol Packaging Market Outlook
The future of the plastic aerosol packaging market hinges on the continued adoption of sustainable materials and innovative technologies. The market’s growth will be driven by the increasing focus on environmental concerns and governmental regulations promoting eco-friendly packaging. Opportunities abound for manufacturers who can successfully develop and market cost-effective, sustainable packaging solutions that meet the evolving needs of diverse end-use sectors. The market is expected to experience robust growth, driven by technological innovation, rising consumer demand, and increased focus on sustainability.
Plastic Aerosol Packaging Segmentation
-
1. Application
- 1.1. Food & Beverages
- 1.2. Pharmaceutical
- 1.3. Cosmetics and Personal care
- 1.4. Household Products
- 1.5. Automotive
- 1.6. Others
-
2. Types
- 2.1. Recyclable Plastic
- 2.2. Non-recyclable Plastic
Plastic Aerosol Packaging Segmentation By Geography
-
1. North America
- 1.1. United States
- 1.2. Canada
- 1.3. Mexico
-
2. South America
- 2.1. Brazil
- 2.2. Argentina
- 2.3. Rest of South America
-
3. Europe
- 3.1. United Kingdom
- 3.2. Germany
- 3.3. France
- 3.4. Italy
- 3.5. Spain
- 3.6. Russia
- 3.7. Benelux
- 3.8. Nordics
- 3.9. Rest of Europe
-
4. Middle East & Africa
- 4.1. Turkey
- 4.2. Israel
- 4.3. GCC
- 4.4. North Africa
- 4.5. South Africa
- 4.6. Rest of Middle East & Africa
-
5. Asia Pacific
- 5.1. China
- 5.2. India
- 5.3. Japan
- 5.4. South Korea
- 5.5. ASEAN
- 5.6. Oceania
- 5.7. Rest of Asia Pacific
Plastic Aerosol Packaging Regional Market Share
Geographic Coverage of Plastic Aerosol Packaging
Plastic Aerosol Packaging REPORT HIGHLIGHTS
| Aspects | Details |
|---|---|
| Study Period | 2020-2034 |
| Base Year | 2025 |
| Estimated Year | 2026 |
| Forecast Period | 2026-2034 |
| Historical Period | 2020-2025 |
| Growth Rate | CAGR of 5.2% from 2020-2034 |
| Segmentation |
|
Table of Contents
- 1. Introduction
- 1.1. Research Scope
- 1.2. Market Segmentation
- 1.3. Research Methodology
- 1.4. Definitions and Assumptions
- 2. Executive Summary
- 2.1. Introduction
- 3. Market Dynamics
- 3.1. Introduction
- 3.2. Market Drivers
- 3.3. Market Restrains
- 3.4. Market Trends
- 4. Market Factor Analysis
- 4.1. Porters Five Forces
- 4.2. Supply/Value Chain
- 4.3. PESTEL analysis
- 4.4. Market Entropy
- 4.5. Patent/Trademark Analysis
- 5. Global Plastic Aerosol Packaging Analysis, Insights and Forecast, 2020-2032
- 5.1. Market Analysis, Insights and Forecast - by Application
- 5.1.1. Food & Beverages
- 5.1.2. Pharmaceutical
- 5.1.3. Cosmetics and Personal care
- 5.1.4. Household Products
- 5.1.5. Automotive
- 5.1.6. Others
- 5.2. Market Analysis, Insights and Forecast - by Types
- 5.2.1. Recyclable Plastic
- 5.2.2. Non-recyclable Plastic
- 5.3. Market Analysis, Insights and Forecast - by Region
- 5.3.1. North America
- 5.3.2. South America
- 5.3.3. Europe
- 5.3.4. Middle East & Africa
- 5.3.5. Asia Pacific
- 5.1. Market Analysis, Insights and Forecast - by Application
- 6. North America Plastic Aerosol Packaging Analysis, Insights and Forecast, 2020-2032
- 6.1. Market Analysis, Insights and Forecast - by Application
- 6.1.1. Food & Beverages
- 6.1.2. Pharmaceutical
- 6.1.3. Cosmetics and Personal care
- 6.1.4. Household Products
- 6.1.5. Automotive
- 6.1.6. Others
- 6.2. Market Analysis, Insights and Forecast - by Types
- 6.2.1. Recyclable Plastic
- 6.2.2. Non-recyclable Plastic
- 6.1. Market Analysis, Insights and Forecast - by Application
- 7. South America Plastic Aerosol Packaging Analysis, Insights and Forecast, 2020-2032
- 7.1. Market Analysis, Insights and Forecast - by Application
- 7.1.1. Food & Beverages
- 7.1.2. Pharmaceutical
- 7.1.3. Cosmetics and Personal care
- 7.1.4. Household Products
- 7.1.5. Automotive
- 7.1.6. Others
- 7.2. Market Analysis, Insights and Forecast - by Types
- 7.2.1. Recyclable Plastic
- 7.2.2. Non-recyclable Plastic
- 7.1. Market Analysis, Insights and Forecast - by Application
- 8. Europe Plastic Aerosol Packaging Analysis, Insights and Forecast, 2020-2032
- 8.1. Market Analysis, Insights and Forecast - by Application
- 8.1.1. Food & Beverages
- 8.1.2. Pharmaceutical
- 8.1.3. Cosmetics and Personal care
- 8.1.4. Household Products
- 8.1.5. Automotive
- 8.1.6. Others
- 8.2. Market Analysis, Insights and Forecast - by Types
- 8.2.1. Recyclable Plastic
- 8.2.2. Non-recyclable Plastic
- 8.1. Market Analysis, Insights and Forecast - by Application
- 9. Middle East & Africa Plastic Aerosol Packaging Analysis, Insights and Forecast, 2020-2032
- 9.1. Market Analysis, Insights and Forecast - by Application
- 9.1.1. Food & Beverages
- 9.1.2. Pharmaceutical
- 9.1.3. Cosmetics and Personal care
- 9.1.4. Household Products
- 9.1.5. Automotive
- 9.1.6. Others
- 9.2. Market Analysis, Insights and Forecast - by Types
- 9.2.1. Recyclable Plastic
- 9.2.2. Non-recyclable Plastic
- 9.1. Market Analysis, Insights and Forecast - by Application
- 10. Asia Pacific Plastic Aerosol Packaging Analysis, Insights and Forecast, 2020-2032
- 10.1. Market Analysis, Insights and Forecast - by Application
- 10.1.1. Food & Beverages
- 10.1.2. Pharmaceutical
- 10.1.3. Cosmetics and Personal care
- 10.1.4. Household Products
- 10.1.5. Automotive
- 10.1.6. Others
- 10.2. Market Analysis, Insights and Forecast - by Types
- 10.2.1. Recyclable Plastic
- 10.2.2. Non-recyclable Plastic
- 10.1. Market Analysis, Insights and Forecast - by Application
- 11. Competitive Analysis
- 11.1. Global Market Share Analysis 2025
- 11.2. Company Profiles
- 11.2.1 Graham Packaging
- 11.2.1.1. Overview
- 11.2.1.2. Products
- 11.2.1.3. SWOT Analysis
- 11.2.1.4. Recent Developments
- 11.2.1.5. Financials (Based on Availability)
- 11.2.2 Plastipak Holdings
- 11.2.2.1. Overview
- 11.2.2.2. Products
- 11.2.2.3. SWOT Analysis
- 11.2.2.4. Recent Developments
- 11.2.2.5. Financials (Based on Availability)
- 11.2.3 SC Johnson and Sons
- 11.2.3.1. Overview
- 11.2.3.2. Products
- 11.2.3.3. SWOT Analysis
- 11.2.3.4. Recent Developments
- 11.2.3.5. Financials (Based on Availability)
- 11.2.4 Henkel AG & Co.
- 11.2.4.1. Overview
- 11.2.4.2. Products
- 11.2.4.3. SWOT Analysis
- 11.2.4.4. Recent Developments
- 11.2.4.5. Financials (Based on Availability)
- 11.2.5 Precise Packaging
- 11.2.5.1. Overview
- 11.2.5.2. Products
- 11.2.5.3. SWOT Analysis
- 11.2.5.4. Recent Developments
- 11.2.5.5. Financials (Based on Availability)
- 11.2.6 Febereze
- 11.2.6.1. Overview
- 11.2.6.2. Products
- 11.2.6.3. SWOT Analysis
- 11.2.6.4. Recent Developments
- 11.2.6.5. Financials (Based on Availability)
- 11.2.7 Airopack
- 11.2.7.1. Overview
- 11.2.7.2. Products
- 11.2.7.3. SWOT Analysis
- 11.2.7.4. Recent Developments
- 11.2.7.5. Financials (Based on Availability)
- 11.2.8 Coster
- 11.2.8.1. Overview
- 11.2.8.2. Products
- 11.2.8.3. SWOT Analysis
- 11.2.8.4. Recent Developments
- 11.2.8.5. Financials (Based on Availability)
- 11.2.9 Crown Holding
- 11.2.9.1. Overview
- 11.2.9.2. Products
- 11.2.9.3. SWOT Analysis
- 11.2.9.4. Recent Developments
- 11.2.9.5. Financials (Based on Availability)
- 11.2.10 Montebello Packaging
- 11.2.10.1. Overview
- 11.2.10.2. Products
- 11.2.10.3. SWOT Analysis
- 11.2.10.4. Recent Developments
- 11.2.10.5. Financials (Based on Availability)
- 11.2.1 Graham Packaging
List of Figures
- Figure 1: Global Plastic Aerosol Packaging Revenue Breakdown (billion, %) by Region 2025 & 2033
- Figure 2: Global Plastic Aerosol Packaging Volume Breakdown (K, %) by Region 2025 & 2033
- Figure 3: North America Plastic Aerosol Packaging Revenue (billion), by Application 2025 & 2033
- Figure 4: North America Plastic Aerosol Packaging Volume (K), by Application 2025 & 2033
- Figure 5: North America Plastic Aerosol Packaging Revenue Share (%), by Application 2025 & 2033
- Figure 6: North America Plastic Aerosol Packaging Volume Share (%), by Application 2025 & 2033
- Figure 7: North America Plastic Aerosol Packaging Revenue (billion), by Types 2025 & 2033
- Figure 8: North America Plastic Aerosol Packaging Volume (K), by Types 2025 & 2033
- Figure 9: North America Plastic Aerosol Packaging Revenue Share (%), by Types 2025 & 2033
- Figure 10: North America Plastic Aerosol Packaging Volume Share (%), by Types 2025 & 2033
- Figure 11: North America Plastic Aerosol Packaging Revenue (billion), by Country 2025 & 2033
- Figure 12: North America Plastic Aerosol Packaging Volume (K), by Country 2025 & 2033
- Figure 13: North America Plastic Aerosol Packaging Revenue Share (%), by Country 2025 & 2033
- Figure 14: North America Plastic Aerosol Packaging Volume Share (%), by Country 2025 & 2033
- Figure 15: South America Plastic Aerosol Packaging Revenue (billion), by Application 2025 & 2033
- Figure 16: South America Plastic Aerosol Packaging Volume (K), by Application 2025 & 2033
- Figure 17: South America Plastic Aerosol Packaging Revenue Share (%), by Application 2025 & 2033
- Figure 18: South America Plastic Aerosol Packaging Volume Share (%), by Application 2025 & 2033
- Figure 19: South America Plastic Aerosol Packaging Revenue (billion), by Types 2025 & 2033
- Figure 20: South America Plastic Aerosol Packaging Volume (K), by Types 2025 & 2033
- Figure 21: South America Plastic Aerosol Packaging Revenue Share (%), by Types 2025 & 2033
- Figure 22: South America Plastic Aerosol Packaging Volume Share (%), by Types 2025 & 2033
- Figure 23: South America Plastic Aerosol Packaging Revenue (billion), by Country 2025 & 2033
- Figure 24: South America Plastic Aerosol Packaging Volume (K), by Country 2025 & 2033
- Figure 25: South America Plastic Aerosol Packaging Revenue Share (%), by Country 2025 & 2033
- Figure 26: South America Plastic Aerosol Packaging Volume Share (%), by Country 2025 & 2033
- Figure 27: Europe Plastic Aerosol Packaging Revenue (billion), by Application 2025 & 2033
- Figure 28: Europe Plastic Aerosol Packaging Volume (K), by Application 2025 & 2033
- Figure 29: Europe Plastic Aerosol Packaging Revenue Share (%), by Application 2025 & 2033
- Figure 30: Europe Plastic Aerosol Packaging Volume Share (%), by Application 2025 & 2033
- Figure 31: Europe Plastic Aerosol Packaging Revenue (billion), by Types 2025 & 2033
- Figure 32: Europe Plastic Aerosol Packaging Volume (K), by Types 2025 & 2033
- Figure 33: Europe Plastic Aerosol Packaging Revenue Share (%), by Types 2025 & 2033
- Figure 34: Europe Plastic Aerosol Packaging Volume Share (%), by Types 2025 & 2033
- Figure 35: Europe Plastic Aerosol Packaging Revenue (billion), by Country 2025 & 2033
- Figure 36: Europe Plastic Aerosol Packaging Volume (K), by Country 2025 & 2033
- Figure 37: Europe Plastic Aerosol Packaging Revenue Share (%), by Country 2025 & 2033
- Figure 38: Europe Plastic Aerosol Packaging Volume Share (%), by Country 2025 & 2033
- Figure 39: Middle East & Africa Plastic Aerosol Packaging Revenue (billion), by Application 2025 & 2033
- Figure 40: Middle East & Africa Plastic Aerosol Packaging Volume (K), by Application 2025 & 2033
- Figure 41: Middle East & Africa Plastic Aerosol Packaging Revenue Share (%), by Application 2025 & 2033
- Figure 42: Middle East & Africa Plastic Aerosol Packaging Volume Share (%), by Application 2025 & 2033
- Figure 43: Middle East & Africa Plastic Aerosol Packaging Revenue (billion), by Types 2025 & 2033
- Figure 44: Middle East & Africa Plastic Aerosol Packaging Volume (K), by Types 2025 & 2033
- Figure 45: Middle East & Africa Plastic Aerosol Packaging Revenue Share (%), by Types 2025 & 2033
- Figure 46: Middle East & Africa Plastic Aerosol Packaging Volume Share (%), by Types 2025 & 2033
- Figure 47: Middle East & Africa Plastic Aerosol Packaging Revenue (billion), by Country 2025 & 2033
- Figure 48: Middle East & Africa Plastic Aerosol Packaging Volume (K), by Country 2025 & 2033
- Figure 49: Middle East & Africa Plastic Aerosol Packaging Revenue Share (%), by Country 2025 & 2033
- Figure 50: Middle East & Africa Plastic Aerosol Packaging Volume Share (%), by Country 2025 & 2033
- Figure 51: Asia Pacific Plastic Aerosol Packaging Revenue (billion), by Application 2025 & 2033
- Figure 52: Asia Pacific Plastic Aerosol Packaging Volume (K), by Application 2025 & 2033
- Figure 53: Asia Pacific Plastic Aerosol Packaging Revenue Share (%), by Application 2025 & 2033
- Figure 54: Asia Pacific Plastic Aerosol Packaging Volume Share (%), by Application 2025 & 2033
- Figure 55: Asia Pacific Plastic Aerosol Packaging Revenue (billion), by Types 2025 & 2033
- Figure 56: Asia Pacific Plastic Aerosol Packaging Volume (K), by Types 2025 & 2033
- Figure 57: Asia Pacific Plastic Aerosol Packaging Revenue Share (%), by Types 2025 & 2033
- Figure 58: Asia Pacific Plastic Aerosol Packaging Volume Share (%), by Types 2025 & 2033
- Figure 59: Asia Pacific Plastic Aerosol Packaging Revenue (billion), by Country 2025 & 2033
- Figure 60: Asia Pacific Plastic Aerosol Packaging Volume (K), by Country 2025 & 2033
- Figure 61: Asia Pacific Plastic Aerosol Packaging Revenue Share (%), by Country 2025 & 2033
- Figure 62: Asia Pacific Plastic Aerosol Packaging Volume Share (%), by Country 2025 & 2033
List of Tables
- Table 1: Global Plastic Aerosol Packaging Revenue billion Forecast, by Application 2020 & 2033
- Table 2: Global Plastic Aerosol Packaging Volume K Forecast, by Application 2020 & 2033
- Table 3: Global Plastic Aerosol Packaging Revenue billion Forecast, by Types 2020 & 2033
- Table 4: Global Plastic Aerosol Packaging Volume K Forecast, by Types 2020 & 2033
- Table 5: Global Plastic Aerosol Packaging Revenue billion Forecast, by Region 2020 & 2033
- Table 6: Global Plastic Aerosol Packaging Volume K Forecast, by Region 2020 & 2033
- Table 7: Global Plastic Aerosol Packaging Revenue billion Forecast, by Application 2020 & 2033
- Table 8: Global Plastic Aerosol Packaging Volume K Forecast, by Application 2020 & 2033
- Table 9: Global Plastic Aerosol Packaging Revenue billion Forecast, by Types 2020 & 2033
- Table 10: Global Plastic Aerosol Packaging Volume K Forecast, by Types 2020 & 2033
- Table 11: Global Plastic Aerosol Packaging Revenue billion Forecast, by Country 2020 & 2033
- Table 12: Global Plastic Aerosol Packaging Volume K Forecast, by Country 2020 & 2033
- Table 13: United States Plastic Aerosol Packaging Revenue (billion) Forecast, by Application 2020 & 2033
- Table 14: United States Plastic Aerosol Packaging Volume (K) Forecast, by Application 2020 & 2033
- Table 15: Canada Plastic Aerosol Packaging Revenue (billion) Forecast, by Application 2020 & 2033
- Table 16: Canada Plastic Aerosol Packaging Volume (K) Forecast, by Application 2020 & 2033
- Table 17: Mexico Plastic Aerosol Packaging Revenue (billion) Forecast, by Application 2020 & 2033
- Table 18: Mexico Plastic Aerosol Packaging Volume (K) Forecast, by Application 2020 & 2033
- Table 19: Global Plastic Aerosol Packaging Revenue billion Forecast, by Application 2020 & 2033
- Table 20: Global Plastic Aerosol Packaging Volume K Forecast, by Application 2020 & 2033
- Table 21: Global Plastic Aerosol Packaging Revenue billion Forecast, by Types 2020 & 2033
- Table 22: Global Plastic Aerosol Packaging Volume K Forecast, by Types 2020 & 2033
- Table 23: Global Plastic Aerosol Packaging Revenue billion Forecast, by Country 2020 & 2033
- Table 24: Global Plastic Aerosol Packaging Volume K Forecast, by Country 2020 & 2033
- Table 25: Brazil Plastic Aerosol Packaging Revenue (billion) Forecast, by Application 2020 & 2033
- Table 26: Brazil Plastic Aerosol Packaging Volume (K) Forecast, by Application 2020 & 2033
- Table 27: Argentina Plastic Aerosol Packaging Revenue (billion) Forecast, by Application 2020 & 2033
- Table 28: Argentina Plastic Aerosol Packaging Volume (K) Forecast, by Application 2020 & 2033
- Table 29: Rest of South America Plastic Aerosol Packaging Revenue (billion) Forecast, by Application 2020 & 2033
- Table 30: Rest of South America Plastic Aerosol Packaging Volume (K) Forecast, by Application 2020 & 2033
- Table 31: Global Plastic Aerosol Packaging Revenue billion Forecast, by Application 2020 & 2033
- Table 32: Global Plastic Aerosol Packaging Volume K Forecast, by Application 2020 & 2033
- Table 33: Global Plastic Aerosol Packaging Revenue billion Forecast, by Types 2020 & 2033
- Table 34: Global Plastic Aerosol Packaging Volume K Forecast, by Types 2020 & 2033
- Table 35: Global Plastic Aerosol Packaging Revenue billion Forecast, by Country 2020 & 2033
- Table 36: Global Plastic Aerosol Packaging Volume K Forecast, by Country 2020 & 2033
- Table 37: United Kingdom Plastic Aerosol Packaging Revenue (billion) Forecast, by Application 2020 & 2033
- Table 38: United Kingdom Plastic Aerosol Packaging Volume (K) Forecast, by Application 2020 & 2033
- Table 39: Germany Plastic Aerosol Packaging Revenue (billion) Forecast, by Application 2020 & 2033
- Table 40: Germany Plastic Aerosol Packaging Volume (K) Forecast, by Application 2020 & 2033
- Table 41: France Plastic Aerosol Packaging Revenue (billion) Forecast, by Application 2020 & 2033
- Table 42: France Plastic Aerosol Packaging Volume (K) Forecast, by Application 2020 & 2033
- Table 43: Italy Plastic Aerosol Packaging Revenue (billion) Forecast, by Application 2020 & 2033
- Table 44: Italy Plastic Aerosol Packaging Volume (K) Forecast, by Application 2020 & 2033
- Table 45: Spain Plastic Aerosol Packaging Revenue (billion) Forecast, by Application 2020 & 2033
- Table 46: Spain Plastic Aerosol Packaging Volume (K) Forecast, by Application 2020 & 2033
- Table 47: Russia Plastic Aerosol Packaging Revenue (billion) Forecast, by Application 2020 & 2033
- Table 48: Russia Plastic Aerosol Packaging Volume (K) Forecast, by Application 2020 & 2033
- Table 49: Benelux Plastic Aerosol Packaging Revenue (billion) Forecast, by Application 2020 & 2033
- Table 50: Benelux Plastic Aerosol Packaging Volume (K) Forecast, by Application 2020 & 2033
- Table 51: Nordics Plastic Aerosol Packaging Revenue (billion) Forecast, by Application 2020 & 2033
- Table 52: Nordics Plastic Aerosol Packaging Volume (K) Forecast, by Application 2020 & 2033
- Table 53: Rest of Europe Plastic Aerosol Packaging Revenue (billion) Forecast, by Application 2020 & 2033
- Table 54: Rest of Europe Plastic Aerosol Packaging Volume (K) Forecast, by Application 2020 & 2033
- Table 55: Global Plastic Aerosol Packaging Revenue billion Forecast, by Application 2020 & 2033
- Table 56: Global Plastic Aerosol Packaging Volume K Forecast, by Application 2020 & 2033
- Table 57: Global Plastic Aerosol Packaging Revenue billion Forecast, by Types 2020 & 2033
- Table 58: Global Plastic Aerosol Packaging Volume K Forecast, by Types 2020 & 2033
- Table 59: Global Plastic Aerosol Packaging Revenue billion Forecast, by Country 2020 & 2033
- Table 60: Global Plastic Aerosol Packaging Volume K Forecast, by Country 2020 & 2033
- Table 61: Turkey Plastic Aerosol Packaging Revenue (billion) Forecast, by Application 2020 & 2033
- Table 62: Turkey Plastic Aerosol Packaging Volume (K) Forecast, by Application 2020 & 2033
- Table 63: Israel Plastic Aerosol Packaging Revenue (billion) Forecast, by Application 2020 & 2033
- Table 64: Israel Plastic Aerosol Packaging Volume (K) Forecast, by Application 2020 & 2033
- Table 65: GCC Plastic Aerosol Packaging Revenue (billion) Forecast, by Application 2020 & 2033
- Table 66: GCC Plastic Aerosol Packaging Volume (K) Forecast, by Application 2020 & 2033
- Table 67: North Africa Plastic Aerosol Packaging Revenue (billion) Forecast, by Application 2020 & 2033
- Table 68: North Africa Plastic Aerosol Packaging Volume (K) Forecast, by Application 2020 & 2033
- Table 69: South Africa Plastic Aerosol Packaging Revenue (billion) Forecast, by Application 2020 & 2033
- Table 70: South Africa Plastic Aerosol Packaging Volume (K) Forecast, by Application 2020 & 2033
- Table 71: Rest of Middle East & Africa Plastic Aerosol Packaging Revenue (billion) Forecast, by Application 2020 & 2033
- Table 72: Rest of Middle East & Africa Plastic Aerosol Packaging Volume (K) Forecast, by Application 2020 & 2033
- Table 73: Global Plastic Aerosol Packaging Revenue billion Forecast, by Application 2020 & 2033
- Table 74: Global Plastic Aerosol Packaging Volume K Forecast, by Application 2020 & 2033
- Table 75: Global Plastic Aerosol Packaging Revenue billion Forecast, by Types 2020 & 2033
- Table 76: Global Plastic Aerosol Packaging Volume K Forecast, by Types 2020 & 2033
- Table 77: Global Plastic Aerosol Packaging Revenue billion Forecast, by Country 2020 & 2033
- Table 78: Global Plastic Aerosol Packaging Volume K Forecast, by Country 2020 & 2033
- Table 79: China Plastic Aerosol Packaging Revenue (billion) Forecast, by Application 2020 & 2033
- Table 80: China Plastic Aerosol Packaging Volume (K) Forecast, by Application 2020 & 2033
- Table 81: India Plastic Aerosol Packaging Revenue (billion) Forecast, by Application 2020 & 2033
- Table 82: India Plastic Aerosol Packaging Volume (K) Forecast, by Application 2020 & 2033
- Table 83: Japan Plastic Aerosol Packaging Revenue (billion) Forecast, by Application 2020 & 2033
- Table 84: Japan Plastic Aerosol Packaging Volume (K) Forecast, by Application 2020 & 2033
- Table 85: South Korea Plastic Aerosol Packaging Revenue (billion) Forecast, by Application 2020 & 2033
- Table 86: South Korea Plastic Aerosol Packaging Volume (K) Forecast, by Application 2020 & 2033
- Table 87: ASEAN Plastic Aerosol Packaging Revenue (billion) Forecast, by Application 2020 & 2033
- Table 88: ASEAN Plastic Aerosol Packaging Volume (K) Forecast, by Application 2020 & 2033
- Table 89: Oceania Plastic Aerosol Packaging Revenue (billion) Forecast, by Application 2020 & 2033
- Table 90: Oceania Plastic Aerosol Packaging Volume (K) Forecast, by Application 2020 & 2033
- Table 91: Rest of Asia Pacific Plastic Aerosol Packaging Revenue (billion) Forecast, by Application 2020 & 2033
- Table 92: Rest of Asia Pacific Plastic Aerosol Packaging Volume (K) Forecast, by Application 2020 & 2033
Frequently Asked Questions
1. What is the projected Compound Annual Growth Rate (CAGR) of the Plastic Aerosol Packaging?
The projected CAGR is approximately 5.2%.
2. Which companies are prominent players in the Plastic Aerosol Packaging?
Key companies in the market include Graham Packaging, Plastipak Holdings, SC Johnson and Sons, Henkel AG & Co., Precise Packaging, Febereze, Airopack, Coster, Crown Holding, Montebello Packaging.
3. What are the main segments of the Plastic Aerosol Packaging?
The market segments include Application, Types.
4. Can you provide details about the market size?
The market size is estimated to be USD 3.5 billion as of 2022.
5. What are some drivers contributing to market growth?
N/A
6. What are the notable trends driving market growth?
N/A
7. Are there any restraints impacting market growth?
N/A
8. Can you provide examples of recent developments in the market?
N/A
9. What pricing options are available for accessing the report?
Pricing options include single-user, multi-user, and enterprise licenses priced at USD 3350.00, USD 5025.00, and USD 6700.00 respectively.
10. Is the market size provided in terms of value or volume?
The market size is provided in terms of value, measured in billion and volume, measured in K.
11. Are there any specific market keywords associated with the report?
Yes, the market keyword associated with the report is "Plastic Aerosol Packaging," which aids in identifying and referencing the specific market segment covered.
12. How do I determine which pricing option suits my needs best?
The pricing options vary based on user requirements and access needs. Individual users may opt for single-user licenses, while businesses requiring broader access may choose multi-user or enterprise licenses for cost-effective access to the report.
13. Are there any additional resources or data provided in the Plastic Aerosol Packaging report?
While the report offers comprehensive insights, it's advisable to review the specific contents or supplementary materials provided to ascertain if additional resources or data are available.
14. How can I stay updated on further developments or reports in the Plastic Aerosol Packaging?
To stay informed about further developments, trends, and reports in the Plastic Aerosol Packaging, consider subscribing to industry newsletters, following relevant companies and organizations, or regularly checking reputable industry news sources and publications.
Methodology
Step 1 - Identification of Relevant Samples Size from Population Database


Step 2 - Approaches for Defining Global Market Size (Value, Volume* & Price*)

Note*: In applicable scenarios
Step 3 - Data Sources
Primary Research
- Web Analytics
- Survey Reports
- Research Institute
- Latest Research Reports
- Opinion Leaders
Secondary Research
- Annual Reports
- White Paper
- Latest Press Release
- Industry Association
- Paid Database
- Investor Presentations

Step 4 - Data Triangulation
Involves using different sources of information in order to increase the validity of a study
These sources are likely to be stakeholders in a program - participants, other researchers, program staff, other community members, and so on.
Then we put all data in single framework & apply various statistical tools to find out the dynamic on the market.
During the analysis stage, feedback from the stakeholder groups would be compared to determine areas of agreement as well as areas of divergence