

Key Insights
The global plastic shrink wrap market is experiencing robust growth, driven by the increasing demand across diverse industries like food and beverage, pharmaceuticals, and consumer goods. The rising need for efficient and cost-effective packaging solutions to protect products during transit and storage is a key factor propelling market expansion. Technological advancements in shrink film materials, focusing on improved barrier properties, enhanced durability, and sustainable options like recycled content, are further stimulating growth. The market is segmented by material type (e.g., PVC, PE, POF), application (e.g., bundling, palletizing, individual product wrapping), and end-use industry. While the market faces challenges related to fluctuating raw material prices and environmental concerns regarding plastic waste, the adoption of innovative recycling technologies and the growing focus on sustainable packaging solutions are mitigating these restraints. The competitive landscape is characterized by a mix of large multinational corporations and regional players, with ongoing consolidation and strategic partnerships shaping the market dynamics. We project a steady CAGR for the forecast period of 2025-2033, driven by consistent demand across existing sectors and potential expansion into new applications.
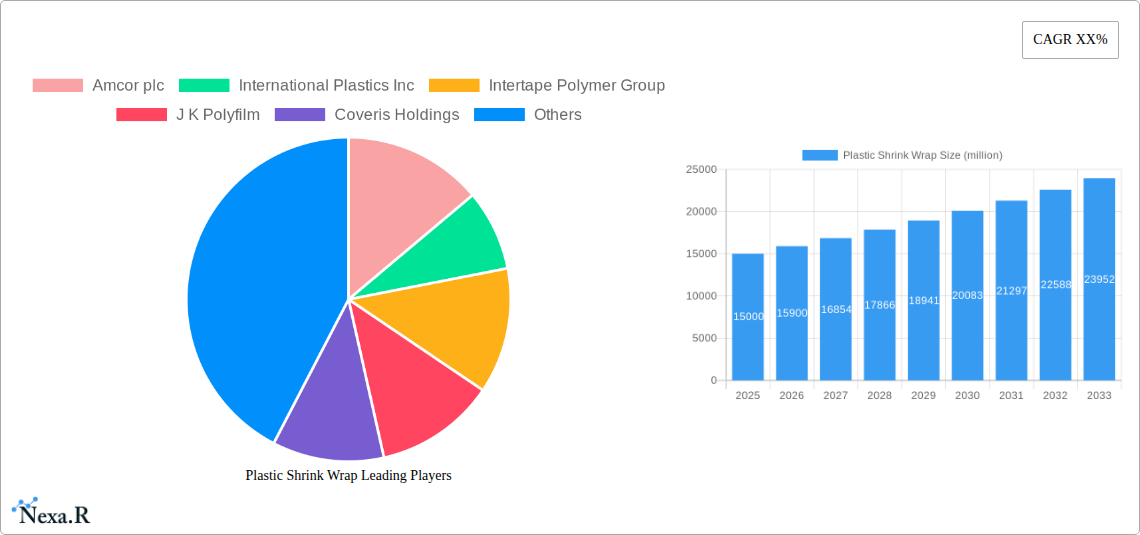
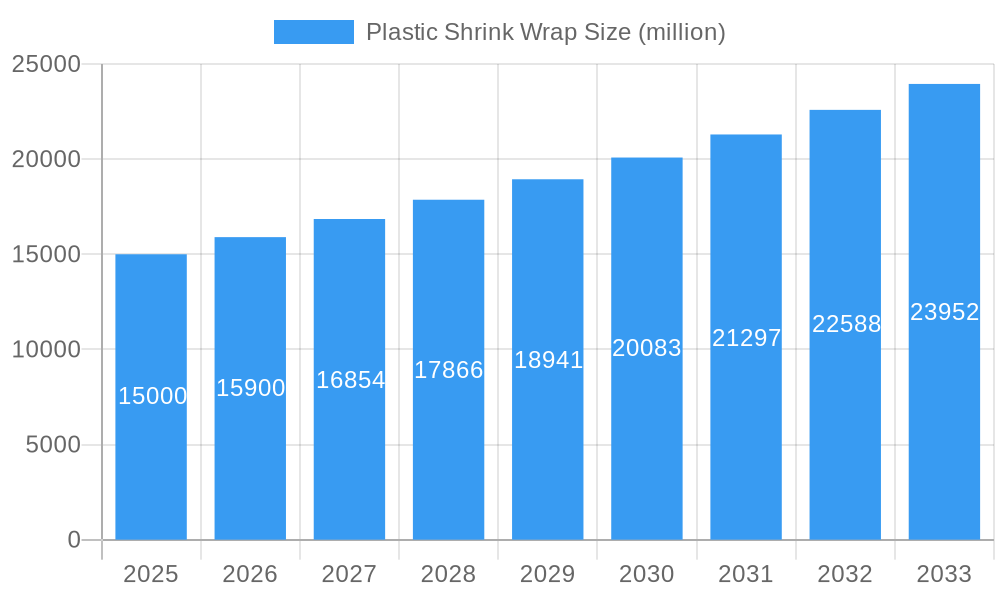
Plastic Shrink Wrap Market Size (In Billion)
Looking ahead, the market is poised for significant growth due to the e-commerce boom, which fuels demand for secure and tamper-evident packaging. The continued focus on optimizing supply chain efficiency and minimizing product damage during transportation will also contribute to increased market demand. Furthermore, the introduction of innovative shrink wrap solutions, such as those with improved heat-shrink properties or enhanced printing capabilities, will further stimulate adoption. Regional variations in market growth are expected, influenced by factors like economic conditions, industrial development, and regulatory frameworks related to plastic waste management. The focus on sustainable practices, such as incorporating recycled materials and reducing plastic consumption, will likely shape future market trends and influence consumer preferences.
Plastic Shrink Wrap Company Market Share
Plastic Shrink Wrap Market Report: 2019-2033
This comprehensive report provides a detailed analysis of the global plastic shrink wrap market, covering market dynamics, growth trends, regional segmentation, product landscape, key players, and future outlook. The study period spans from 2019 to 2033, with 2025 serving as the base and estimated year. The report utilizes data from a variety of sources, including market research firms, industry publications, and company financial reports to provide a comprehensive and accurate picture of the market. This report is essential for industry professionals, investors, and anyone seeking to understand the current state and future trajectory of the plastic shrink wrap market. The market size is projected to reach xx million units by 2033.
Plastic Shrink Wrap Market Dynamics & Structure
This section analyzes the competitive landscape of the plastic shrink wrap market, focusing on market concentration, technological innovation, regulatory frameworks, and key industry trends. The analysis includes a deep dive into mergers and acquisitions (M&A) activity and its impact on market structure.
- Market Concentration: The global plastic shrink wrap market exhibits a moderately concentrated structure, with a handful of large players holding significant market share. The top five players account for approximately xx% of the market.
- Technological Innovation: Continuous advancements in polymer technology and film extrusion processes are driving innovation in the sector, leading to lighter, stronger, and more sustainable shrink wrap options. However, high R&D costs pose a barrier to entry for smaller players.
- Regulatory Frameworks: Growing environmental concerns are driving stricter regulations regarding plastic waste, prompting the industry to explore biodegradable and recyclable alternatives. This is creating both challenges and opportunities.
- Competitive Product Substitutes: The market faces competition from alternative packaging solutions, such as paper-based wraps and reusable containers. The competitiveness of these substitutes depends on factors such as cost, performance, and environmental impact.
- End-User Demographics: The key end-user segments include food and beverage, pharmaceuticals, consumer goods, and industrial products. Demand is influenced by factors such as packaging requirements, consumer preferences, and e-commerce growth.
- M&A Trends: The past five years have witnessed xx M&A deals in the plastic shrink wrap sector, primarily driven by strategic consolidation and expansion into new markets. This activity has led to a more concentrated market and increased competition.
Plastic Shrink Wrap Growth Trends & Insights
This section provides a comprehensive analysis of the global plastic shrink wrap market's growth trajectory over the study period (2019-2033), incorporating detailed market size estimations, adoption rates, technological disruptions, and shifts in consumer behavior.
The global plastic shrink wrap market experienced a CAGR of xx% during the historical period (2019-2024). Driven by factors such as the increasing demand from the e-commerce sector, the market is projected to achieve a CAGR of xx% during the forecast period (2025-2033). Technological advancements in material science are leading to the development of more sustainable and efficient shrink wrap options. The rising adoption of automated packaging systems is also boosting market growth. Shifts in consumer preferences towards convenient and tamper-evident packaging are further driving demand. Market penetration in developing economies is expected to increase substantially as consumer spending and industrial activity rise.
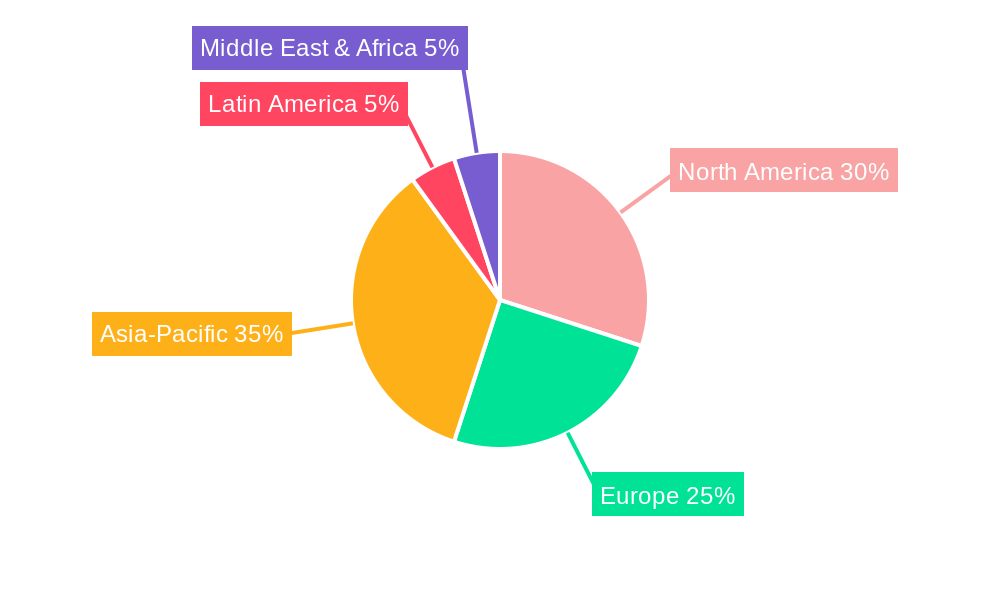
Dominant Regions, Countries, or Segments in Plastic Shrink Wrap
This section identifies the leading regions, countries, and segments driving the growth of the plastic shrink wrap market.
- North America: The region holds a dominant market share due to strong demand from the food and beverage, and e-commerce sectors, along with a well-established manufacturing base. Key growth drivers include favorable economic conditions and advanced packaging technologies.
- Europe: Stricter environmental regulations are shaping the market in Europe, pushing for the development of sustainable alternatives. Despite this, the region exhibits steady growth due to high consumer spending and established manufacturing facilities.
- Asia-Pacific: This region is experiencing rapid growth, fueled by rising disposable incomes, expanding industrialization, and increasing e-commerce adoption. However, challenges such as inconsistent infrastructure and regulatory inconsistencies need to be addressed.
Plastic Shrink Wrap Product Landscape
The plastic shrink wrap market offers a diverse range of products catering to various applications and end-user needs. Innovations in material science have resulted in products with enhanced properties such as improved clarity, strength, and puncture resistance. These advancements are driven by the need to enhance product protection, improve aesthetics, and reduce material usage. Unique selling propositions include customized designs, specialized barrier properties, and the incorporation of recycled materials.
Key Drivers, Barriers & Challenges in Plastic Shrink Wrap
Key Drivers: The growth of the e-commerce sector, increasing demand for tamper-evident packaging, and advancements in polymer technology are primary drivers of market expansion. Government initiatives promoting sustainable packaging are also providing a positive boost.
Key Challenges: Stricter environmental regulations and rising raw material costs represent significant challenges. Fluctuations in oil prices can impact production costs and prices. Competition from alternative packaging materials presents another obstacle to sustained growth. The estimated impact of these challenges on market growth in 2033 is a reduction of approximately xx million units.
Emerging Opportunities in Plastic Shrink Wrap
Opportunities exist in the development of biodegradable and compostable shrink wrap solutions, targeting the growing demand for environmentally friendly packaging. Furthermore, expanding into niche applications, such as specialized medical packaging, presents a significant growth potential. Innovation in packaging design, including the integration of smart technologies, will create new market opportunities.
Growth Accelerators in the Plastic Shrink Wrap Industry
Technological advancements, strategic partnerships, and market expansion into developing economies are crucial growth catalysts. The development of lightweight, high-performance films will further enhance market growth. Strategic collaborations between packaging companies and material suppliers will accelerate innovation and market penetration.
Key Players Shaping the Plastic Shrink Wrap Market
- Amcor plc
- International Plastics Inc
- Intertape Polymer Group
- J K Polyfilm
- Coveris Holdings
- Ceisa Semo
- Clondalkin Group
- RKW Group
- Berry Global
- Plastotecnica SpA
- Clearpack
- Baroda Packaging
- Brentwood Plastic
- Aintree Plastics
- Elite Plastics
- Xinjiang Rival Tech
- Poly-Pack Verpackungs-GmbH
Notable Milestones in Plastic Shrink Wrap Sector
- 2020: Introduction of a biodegradable shrink wrap by Amcor plc.
- 2021: Merger between two major players in the European market.
- 2022: Launch of a new high-performance shrink film with improved barrier properties.
- 2023: Significant investment in R&D for sustainable shrink wrap solutions.
In-Depth Plastic Shrink Wrap Market Outlook
The future of the plastic shrink wrap market is promising, driven by continuous innovation in materials and technologies, along with the growing demand from key end-use sectors. Strategic partnerships and expansion into emerging markets will further enhance growth prospects. The potential for sustainable and efficient solutions will continue to drive market expansion. The predicted market size in 2033, considering all growth factors and challenges, is xx million units.
Plastic Shrink Wrap Segmentation
-
1. Application
- 1.1. Neck Banding
- 1.2. Shrink Sleeves
- 1.3. Shrink Bundling
- 1.4. Wrapping
- 1.5. Others
-
2. Types
- 2.1. Polyvinyl Chloride (PVC)
- 2.2. Polyethylene Terephthalate Glycol (PETG)
- 2.3. Oriented Polystyrene (OPS)
Plastic Shrink Wrap Segmentation By Geography
-
1. North America
- 1.1. United States
- 1.2. Canada
- 1.3. Mexico
-
2. South America
- 2.1. Brazil
- 2.2. Argentina
- 2.3. Rest of South America
-
3. Europe
- 3.1. United Kingdom
- 3.2. Germany
- 3.3. France
- 3.4. Italy
- 3.5. Spain
- 3.6. Russia
- 3.7. Benelux
- 3.8. Nordics
- 3.9. Rest of Europe
-
4. Middle East & Africa
- 4.1. Turkey
- 4.2. Israel
- 4.3. GCC
- 4.4. North Africa
- 4.5. South Africa
- 4.6. Rest of Middle East & Africa
-
5. Asia Pacific
- 5.1. China
- 5.2. India
- 5.3. Japan
- 5.4. South Korea
- 5.5. ASEAN
- 5.6. Oceania
- 5.7. Rest of Asia Pacific
Plastic Shrink Wrap Regional Market Share
Geographic Coverage of Plastic Shrink Wrap
Plastic Shrink Wrap REPORT HIGHLIGHTS
| Aspects | Details |
|---|---|
| Study Period | 2020-2034 |
| Base Year | 2025 |
| Estimated Year | 2026 |
| Forecast Period | 2026-2034 |
| Historical Period | 2020-2025 |
| Growth Rate | CAGR of 6.3% from 2020-2034 |
| Segmentation |
|
Table of Contents
- 1. Introduction
- 1.1. Research Scope
- 1.2. Market Segmentation
- 1.3. Research Methodology
- 1.4. Definitions and Assumptions
- 2. Executive Summary
- 2.1. Introduction
- 3. Market Dynamics
- 3.1. Introduction
- 3.2. Market Drivers
- 3.3. Market Restrains
- 3.4. Market Trends
- 4. Market Factor Analysis
- 4.1. Porters Five Forces
- 4.2. Supply/Value Chain
- 4.3. PESTEL analysis
- 4.4. Market Entropy
- 4.5. Patent/Trademark Analysis
- 5. Global Plastic Shrink Wrap Analysis, Insights and Forecast, 2020-2032
- 5.1. Market Analysis, Insights and Forecast - by Application
- 5.1.1. Neck Banding
- 5.1.2. Shrink Sleeves
- 5.1.3. Shrink Bundling
- 5.1.4. Wrapping
- 5.1.5. Others
- 5.2. Market Analysis, Insights and Forecast - by Types
- 5.2.1. Polyvinyl Chloride (PVC)
- 5.2.2. Polyethylene Terephthalate Glycol (PETG)
- 5.2.3. Oriented Polystyrene (OPS)
- 5.3. Market Analysis, Insights and Forecast - by Region
- 5.3.1. North America
- 5.3.2. South America
- 5.3.3. Europe
- 5.3.4. Middle East & Africa
- 5.3.5. Asia Pacific
- 5.1. Market Analysis, Insights and Forecast - by Application
- 6. North America Plastic Shrink Wrap Analysis, Insights and Forecast, 2020-2032
- 6.1. Market Analysis, Insights and Forecast - by Application
- 6.1.1. Neck Banding
- 6.1.2. Shrink Sleeves
- 6.1.3. Shrink Bundling
- 6.1.4. Wrapping
- 6.1.5. Others
- 6.2. Market Analysis, Insights and Forecast - by Types
- 6.2.1. Polyvinyl Chloride (PVC)
- 6.2.2. Polyethylene Terephthalate Glycol (PETG)
- 6.2.3. Oriented Polystyrene (OPS)
- 6.1. Market Analysis, Insights and Forecast - by Application
- 7. South America Plastic Shrink Wrap Analysis, Insights and Forecast, 2020-2032
- 7.1. Market Analysis, Insights and Forecast - by Application
- 7.1.1. Neck Banding
- 7.1.2. Shrink Sleeves
- 7.1.3. Shrink Bundling
- 7.1.4. Wrapping
- 7.1.5. Others
- 7.2. Market Analysis, Insights and Forecast - by Types
- 7.2.1. Polyvinyl Chloride (PVC)
- 7.2.2. Polyethylene Terephthalate Glycol (PETG)
- 7.2.3. Oriented Polystyrene (OPS)
- 7.1. Market Analysis, Insights and Forecast - by Application
- 8. Europe Plastic Shrink Wrap Analysis, Insights and Forecast, 2020-2032
- 8.1. Market Analysis, Insights and Forecast - by Application
- 8.1.1. Neck Banding
- 8.1.2. Shrink Sleeves
- 8.1.3. Shrink Bundling
- 8.1.4. Wrapping
- 8.1.5. Others
- 8.2. Market Analysis, Insights and Forecast - by Types
- 8.2.1. Polyvinyl Chloride (PVC)
- 8.2.2. Polyethylene Terephthalate Glycol (PETG)
- 8.2.3. Oriented Polystyrene (OPS)
- 8.1. Market Analysis, Insights and Forecast - by Application
- 9. Middle East & Africa Plastic Shrink Wrap Analysis, Insights and Forecast, 2020-2032
- 9.1. Market Analysis, Insights and Forecast - by Application
- 9.1.1. Neck Banding
- 9.1.2. Shrink Sleeves
- 9.1.3. Shrink Bundling
- 9.1.4. Wrapping
- 9.1.5. Others
- 9.2. Market Analysis, Insights and Forecast - by Types
- 9.2.1. Polyvinyl Chloride (PVC)
- 9.2.2. Polyethylene Terephthalate Glycol (PETG)
- 9.2.3. Oriented Polystyrene (OPS)
- 9.1. Market Analysis, Insights and Forecast - by Application
- 10. Asia Pacific Plastic Shrink Wrap Analysis, Insights and Forecast, 2020-2032
- 10.1. Market Analysis, Insights and Forecast - by Application
- 10.1.1. Neck Banding
- 10.1.2. Shrink Sleeves
- 10.1.3. Shrink Bundling
- 10.1.4. Wrapping
- 10.1.5. Others
- 10.2. Market Analysis, Insights and Forecast - by Types
- 10.2.1. Polyvinyl Chloride (PVC)
- 10.2.2. Polyethylene Terephthalate Glycol (PETG)
- 10.2.3. Oriented Polystyrene (OPS)
- 10.1. Market Analysis, Insights and Forecast - by Application
- 11. Competitive Analysis
- 11.1. Global Market Share Analysis 2025
- 11.2. Company Profiles
- 11.2.1 Amcor plc
- 11.2.1.1. Overview
- 11.2.1.2. Products
- 11.2.1.3. SWOT Analysis
- 11.2.1.4. Recent Developments
- 11.2.1.5. Financials (Based on Availability)
- 11.2.2 International Plastics Inc
- 11.2.2.1. Overview
- 11.2.2.2. Products
- 11.2.2.3. SWOT Analysis
- 11.2.2.4. Recent Developments
- 11.2.2.5. Financials (Based on Availability)
- 11.2.3 Intertape Polymer Group
- 11.2.3.1. Overview
- 11.2.3.2. Products
- 11.2.3.3. SWOT Analysis
- 11.2.3.4. Recent Developments
- 11.2.3.5. Financials (Based on Availability)
- 11.2.4 J K Polyfilm
- 11.2.4.1. Overview
- 11.2.4.2. Products
- 11.2.4.3. SWOT Analysis
- 11.2.4.4. Recent Developments
- 11.2.4.5. Financials (Based on Availability)
- 11.2.5 Coveris Holdings
- 11.2.5.1. Overview
- 11.2.5.2. Products
- 11.2.5.3. SWOT Analysis
- 11.2.5.4. Recent Developments
- 11.2.5.5. Financials (Based on Availability)
- 11.2.6 Ceisa Semo
- 11.2.6.1. Overview
- 11.2.6.2. Products
- 11.2.6.3. SWOT Analysis
- 11.2.6.4. Recent Developments
- 11.2.6.5. Financials (Based on Availability)
- 11.2.7 Clondalkin Group
- 11.2.7.1. Overview
- 11.2.7.2. Products
- 11.2.7.3. SWOT Analysis
- 11.2.7.4. Recent Developments
- 11.2.7.5. Financials (Based on Availability)
- 11.2.8 RKW Group
- 11.2.8.1. Overview
- 11.2.8.2. Products
- 11.2.8.3. SWOT Analysis
- 11.2.8.4. Recent Developments
- 11.2.8.5. Financials (Based on Availability)
- 11.2.9 Berry Global
- 11.2.9.1. Overview
- 11.2.9.2. Products
- 11.2.9.3. SWOT Analysis
- 11.2.9.4. Recent Developments
- 11.2.9.5. Financials (Based on Availability)
- 11.2.10 Plastotecnica SpA
- 11.2.10.1. Overview
- 11.2.10.2. Products
- 11.2.10.3. SWOT Analysis
- 11.2.10.4. Recent Developments
- 11.2.10.5. Financials (Based on Availability)
- 11.2.11 Clearpack
- 11.2.11.1. Overview
- 11.2.11.2. Products
- 11.2.11.3. SWOT Analysis
- 11.2.11.4. Recent Developments
- 11.2.11.5. Financials (Based on Availability)
- 11.2.12 Baroda Packaging
- 11.2.12.1. Overview
- 11.2.12.2. Products
- 11.2.12.3. SWOT Analysis
- 11.2.12.4. Recent Developments
- 11.2.12.5. Financials (Based on Availability)
- 11.2.13 Brentwood Plastic
- 11.2.13.1. Overview
- 11.2.13.2. Products
- 11.2.13.3. SWOT Analysis
- 11.2.13.4. Recent Developments
- 11.2.13.5. Financials (Based on Availability)
- 11.2.14 Aintree Plastics
- 11.2.14.1. Overview
- 11.2.14.2. Products
- 11.2.14.3. SWOT Analysis
- 11.2.14.4. Recent Developments
- 11.2.14.5. Financials (Based on Availability)
- 11.2.15 Elite Plastics
- 11.2.15.1. Overview
- 11.2.15.2. Products
- 11.2.15.3. SWOT Analysis
- 11.2.15.4. Recent Developments
- 11.2.15.5. Financials (Based on Availability)
- 11.2.16 Xinjiang Rival Tech
- 11.2.16.1. Overview
- 11.2.16.2. Products
- 11.2.16.3. SWOT Analysis
- 11.2.16.4. Recent Developments
- 11.2.16.5. Financials (Based on Availability)
- 11.2.17 Poly-Pack Verpackungs-GmbH
- 11.2.17.1. Overview
- 11.2.17.2. Products
- 11.2.17.3. SWOT Analysis
- 11.2.17.4. Recent Developments
- 11.2.17.5. Financials (Based on Availability)
- 11.2.1 Amcor plc
List of Figures
- Figure 1: Global Plastic Shrink Wrap Revenue Breakdown (undefined, %) by Region 2025 & 2033
- Figure 2: Global Plastic Shrink Wrap Volume Breakdown (K, %) by Region 2025 & 2033
- Figure 3: North America Plastic Shrink Wrap Revenue (undefined), by Application 2025 & 2033
- Figure 4: North America Plastic Shrink Wrap Volume (K), by Application 2025 & 2033
- Figure 5: North America Plastic Shrink Wrap Revenue Share (%), by Application 2025 & 2033
- Figure 6: North America Plastic Shrink Wrap Volume Share (%), by Application 2025 & 2033
- Figure 7: North America Plastic Shrink Wrap Revenue (undefined), by Types 2025 & 2033
- Figure 8: North America Plastic Shrink Wrap Volume (K), by Types 2025 & 2033
- Figure 9: North America Plastic Shrink Wrap Revenue Share (%), by Types 2025 & 2033
- Figure 10: North America Plastic Shrink Wrap Volume Share (%), by Types 2025 & 2033
- Figure 11: North America Plastic Shrink Wrap Revenue (undefined), by Country 2025 & 2033
- Figure 12: North America Plastic Shrink Wrap Volume (K), by Country 2025 & 2033
- Figure 13: North America Plastic Shrink Wrap Revenue Share (%), by Country 2025 & 2033
- Figure 14: North America Plastic Shrink Wrap Volume Share (%), by Country 2025 & 2033
- Figure 15: South America Plastic Shrink Wrap Revenue (undefined), by Application 2025 & 2033
- Figure 16: South America Plastic Shrink Wrap Volume (K), by Application 2025 & 2033
- Figure 17: South America Plastic Shrink Wrap Revenue Share (%), by Application 2025 & 2033
- Figure 18: South America Plastic Shrink Wrap Volume Share (%), by Application 2025 & 2033
- Figure 19: South America Plastic Shrink Wrap Revenue (undefined), by Types 2025 & 2033
- Figure 20: South America Plastic Shrink Wrap Volume (K), by Types 2025 & 2033
- Figure 21: South America Plastic Shrink Wrap Revenue Share (%), by Types 2025 & 2033
- Figure 22: South America Plastic Shrink Wrap Volume Share (%), by Types 2025 & 2033
- Figure 23: South America Plastic Shrink Wrap Revenue (undefined), by Country 2025 & 2033
- Figure 24: South America Plastic Shrink Wrap Volume (K), by Country 2025 & 2033
- Figure 25: South America Plastic Shrink Wrap Revenue Share (%), by Country 2025 & 2033
- Figure 26: South America Plastic Shrink Wrap Volume Share (%), by Country 2025 & 2033
- Figure 27: Europe Plastic Shrink Wrap Revenue (undefined), by Application 2025 & 2033
- Figure 28: Europe Plastic Shrink Wrap Volume (K), by Application 2025 & 2033
- Figure 29: Europe Plastic Shrink Wrap Revenue Share (%), by Application 2025 & 2033
- Figure 30: Europe Plastic Shrink Wrap Volume Share (%), by Application 2025 & 2033
- Figure 31: Europe Plastic Shrink Wrap Revenue (undefined), by Types 2025 & 2033
- Figure 32: Europe Plastic Shrink Wrap Volume (K), by Types 2025 & 2033
- Figure 33: Europe Plastic Shrink Wrap Revenue Share (%), by Types 2025 & 2033
- Figure 34: Europe Plastic Shrink Wrap Volume Share (%), by Types 2025 & 2033
- Figure 35: Europe Plastic Shrink Wrap Revenue (undefined), by Country 2025 & 2033
- Figure 36: Europe Plastic Shrink Wrap Volume (K), by Country 2025 & 2033
- Figure 37: Europe Plastic Shrink Wrap Revenue Share (%), by Country 2025 & 2033
- Figure 38: Europe Plastic Shrink Wrap Volume Share (%), by Country 2025 & 2033
- Figure 39: Middle East & Africa Plastic Shrink Wrap Revenue (undefined), by Application 2025 & 2033
- Figure 40: Middle East & Africa Plastic Shrink Wrap Volume (K), by Application 2025 & 2033
- Figure 41: Middle East & Africa Plastic Shrink Wrap Revenue Share (%), by Application 2025 & 2033
- Figure 42: Middle East & Africa Plastic Shrink Wrap Volume Share (%), by Application 2025 & 2033
- Figure 43: Middle East & Africa Plastic Shrink Wrap Revenue (undefined), by Types 2025 & 2033
- Figure 44: Middle East & Africa Plastic Shrink Wrap Volume (K), by Types 2025 & 2033
- Figure 45: Middle East & Africa Plastic Shrink Wrap Revenue Share (%), by Types 2025 & 2033
- Figure 46: Middle East & Africa Plastic Shrink Wrap Volume Share (%), by Types 2025 & 2033
- Figure 47: Middle East & Africa Plastic Shrink Wrap Revenue (undefined), by Country 2025 & 2033
- Figure 48: Middle East & Africa Plastic Shrink Wrap Volume (K), by Country 2025 & 2033
- Figure 49: Middle East & Africa Plastic Shrink Wrap Revenue Share (%), by Country 2025 & 2033
- Figure 50: Middle East & Africa Plastic Shrink Wrap Volume Share (%), by Country 2025 & 2033
- Figure 51: Asia Pacific Plastic Shrink Wrap Revenue (undefined), by Application 2025 & 2033
- Figure 52: Asia Pacific Plastic Shrink Wrap Volume (K), by Application 2025 & 2033
- Figure 53: Asia Pacific Plastic Shrink Wrap Revenue Share (%), by Application 2025 & 2033
- Figure 54: Asia Pacific Plastic Shrink Wrap Volume Share (%), by Application 2025 & 2033
- Figure 55: Asia Pacific Plastic Shrink Wrap Revenue (undefined), by Types 2025 & 2033
- Figure 56: Asia Pacific Plastic Shrink Wrap Volume (K), by Types 2025 & 2033
- Figure 57: Asia Pacific Plastic Shrink Wrap Revenue Share (%), by Types 2025 & 2033
- Figure 58: Asia Pacific Plastic Shrink Wrap Volume Share (%), by Types 2025 & 2033
- Figure 59: Asia Pacific Plastic Shrink Wrap Revenue (undefined), by Country 2025 & 2033
- Figure 60: Asia Pacific Plastic Shrink Wrap Volume (K), by Country 2025 & 2033
- Figure 61: Asia Pacific Plastic Shrink Wrap Revenue Share (%), by Country 2025 & 2033
- Figure 62: Asia Pacific Plastic Shrink Wrap Volume Share (%), by Country 2025 & 2033
List of Tables
- Table 1: Global Plastic Shrink Wrap Revenue undefined Forecast, by Application 2020 & 2033
- Table 2: Global Plastic Shrink Wrap Volume K Forecast, by Application 2020 & 2033
- Table 3: Global Plastic Shrink Wrap Revenue undefined Forecast, by Types 2020 & 2033
- Table 4: Global Plastic Shrink Wrap Volume K Forecast, by Types 2020 & 2033
- Table 5: Global Plastic Shrink Wrap Revenue undefined Forecast, by Region 2020 & 2033
- Table 6: Global Plastic Shrink Wrap Volume K Forecast, by Region 2020 & 2033
- Table 7: Global Plastic Shrink Wrap Revenue undefined Forecast, by Application 2020 & 2033
- Table 8: Global Plastic Shrink Wrap Volume K Forecast, by Application 2020 & 2033
- Table 9: Global Plastic Shrink Wrap Revenue undefined Forecast, by Types 2020 & 2033
- Table 10: Global Plastic Shrink Wrap Volume K Forecast, by Types 2020 & 2033
- Table 11: Global Plastic Shrink Wrap Revenue undefined Forecast, by Country 2020 & 2033
- Table 12: Global Plastic Shrink Wrap Volume K Forecast, by Country 2020 & 2033
- Table 13: United States Plastic Shrink Wrap Revenue (undefined) Forecast, by Application 2020 & 2033
- Table 14: United States Plastic Shrink Wrap Volume (K) Forecast, by Application 2020 & 2033
- Table 15: Canada Plastic Shrink Wrap Revenue (undefined) Forecast, by Application 2020 & 2033
- Table 16: Canada Plastic Shrink Wrap Volume (K) Forecast, by Application 2020 & 2033
- Table 17: Mexico Plastic Shrink Wrap Revenue (undefined) Forecast, by Application 2020 & 2033
- Table 18: Mexico Plastic Shrink Wrap Volume (K) Forecast, by Application 2020 & 2033
- Table 19: Global Plastic Shrink Wrap Revenue undefined Forecast, by Application 2020 & 2033
- Table 20: Global Plastic Shrink Wrap Volume K Forecast, by Application 2020 & 2033
- Table 21: Global Plastic Shrink Wrap Revenue undefined Forecast, by Types 2020 & 2033
- Table 22: Global Plastic Shrink Wrap Volume K Forecast, by Types 2020 & 2033
- Table 23: Global Plastic Shrink Wrap Revenue undefined Forecast, by Country 2020 & 2033
- Table 24: Global Plastic Shrink Wrap Volume K Forecast, by Country 2020 & 2033
- Table 25: Brazil Plastic Shrink Wrap Revenue (undefined) Forecast, by Application 2020 & 2033
- Table 26: Brazil Plastic Shrink Wrap Volume (K) Forecast, by Application 2020 & 2033
- Table 27: Argentina Plastic Shrink Wrap Revenue (undefined) Forecast, by Application 2020 & 2033
- Table 28: Argentina Plastic Shrink Wrap Volume (K) Forecast, by Application 2020 & 2033
- Table 29: Rest of South America Plastic Shrink Wrap Revenue (undefined) Forecast, by Application 2020 & 2033
- Table 30: Rest of South America Plastic Shrink Wrap Volume (K) Forecast, by Application 2020 & 2033
- Table 31: Global Plastic Shrink Wrap Revenue undefined Forecast, by Application 2020 & 2033
- Table 32: Global Plastic Shrink Wrap Volume K Forecast, by Application 2020 & 2033
- Table 33: Global Plastic Shrink Wrap Revenue undefined Forecast, by Types 2020 & 2033
- Table 34: Global Plastic Shrink Wrap Volume K Forecast, by Types 2020 & 2033
- Table 35: Global Plastic Shrink Wrap Revenue undefined Forecast, by Country 2020 & 2033
- Table 36: Global Plastic Shrink Wrap Volume K Forecast, by Country 2020 & 2033
- Table 37: United Kingdom Plastic Shrink Wrap Revenue (undefined) Forecast, by Application 2020 & 2033
- Table 38: United Kingdom Plastic Shrink Wrap Volume (K) Forecast, by Application 2020 & 2033
- Table 39: Germany Plastic Shrink Wrap Revenue (undefined) Forecast, by Application 2020 & 2033
- Table 40: Germany Plastic Shrink Wrap Volume (K) Forecast, by Application 2020 & 2033
- Table 41: France Plastic Shrink Wrap Revenue (undefined) Forecast, by Application 2020 & 2033
- Table 42: France Plastic Shrink Wrap Volume (K) Forecast, by Application 2020 & 2033
- Table 43: Italy Plastic Shrink Wrap Revenue (undefined) Forecast, by Application 2020 & 2033
- Table 44: Italy Plastic Shrink Wrap Volume (K) Forecast, by Application 2020 & 2033
- Table 45: Spain Plastic Shrink Wrap Revenue (undefined) Forecast, by Application 2020 & 2033
- Table 46: Spain Plastic Shrink Wrap Volume (K) Forecast, by Application 2020 & 2033
- Table 47: Russia Plastic Shrink Wrap Revenue (undefined) Forecast, by Application 2020 & 2033
- Table 48: Russia Plastic Shrink Wrap Volume (K) Forecast, by Application 2020 & 2033
- Table 49: Benelux Plastic Shrink Wrap Revenue (undefined) Forecast, by Application 2020 & 2033
- Table 50: Benelux Plastic Shrink Wrap Volume (K) Forecast, by Application 2020 & 2033
- Table 51: Nordics Plastic Shrink Wrap Revenue (undefined) Forecast, by Application 2020 & 2033
- Table 52: Nordics Plastic Shrink Wrap Volume (K) Forecast, by Application 2020 & 2033
- Table 53: Rest of Europe Plastic Shrink Wrap Revenue (undefined) Forecast, by Application 2020 & 2033
- Table 54: Rest of Europe Plastic Shrink Wrap Volume (K) Forecast, by Application 2020 & 2033
- Table 55: Global Plastic Shrink Wrap Revenue undefined Forecast, by Application 2020 & 2033
- Table 56: Global Plastic Shrink Wrap Volume K Forecast, by Application 2020 & 2033
- Table 57: Global Plastic Shrink Wrap Revenue undefined Forecast, by Types 2020 & 2033
- Table 58: Global Plastic Shrink Wrap Volume K Forecast, by Types 2020 & 2033
- Table 59: Global Plastic Shrink Wrap Revenue undefined Forecast, by Country 2020 & 2033
- Table 60: Global Plastic Shrink Wrap Volume K Forecast, by Country 2020 & 2033
- Table 61: Turkey Plastic Shrink Wrap Revenue (undefined) Forecast, by Application 2020 & 2033
- Table 62: Turkey Plastic Shrink Wrap Volume (K) Forecast, by Application 2020 & 2033
- Table 63: Israel Plastic Shrink Wrap Revenue (undefined) Forecast, by Application 2020 & 2033
- Table 64: Israel Plastic Shrink Wrap Volume (K) Forecast, by Application 2020 & 2033
- Table 65: GCC Plastic Shrink Wrap Revenue (undefined) Forecast, by Application 2020 & 2033
- Table 66: GCC Plastic Shrink Wrap Volume (K) Forecast, by Application 2020 & 2033
- Table 67: North Africa Plastic Shrink Wrap Revenue (undefined) Forecast, by Application 2020 & 2033
- Table 68: North Africa Plastic Shrink Wrap Volume (K) Forecast, by Application 2020 & 2033
- Table 69: South Africa Plastic Shrink Wrap Revenue (undefined) Forecast, by Application 2020 & 2033
- Table 70: South Africa Plastic Shrink Wrap Volume (K) Forecast, by Application 2020 & 2033
- Table 71: Rest of Middle East & Africa Plastic Shrink Wrap Revenue (undefined) Forecast, by Application 2020 & 2033
- Table 72: Rest of Middle East & Africa Plastic Shrink Wrap Volume (K) Forecast, by Application 2020 & 2033
- Table 73: Global Plastic Shrink Wrap Revenue undefined Forecast, by Application 2020 & 2033
- Table 74: Global Plastic Shrink Wrap Volume K Forecast, by Application 2020 & 2033
- Table 75: Global Plastic Shrink Wrap Revenue undefined Forecast, by Types 2020 & 2033
- Table 76: Global Plastic Shrink Wrap Volume K Forecast, by Types 2020 & 2033
- Table 77: Global Plastic Shrink Wrap Revenue undefined Forecast, by Country 2020 & 2033
- Table 78: Global Plastic Shrink Wrap Volume K Forecast, by Country 2020 & 2033
- Table 79: China Plastic Shrink Wrap Revenue (undefined) Forecast, by Application 2020 & 2033
- Table 80: China Plastic Shrink Wrap Volume (K) Forecast, by Application 2020 & 2033
- Table 81: India Plastic Shrink Wrap Revenue (undefined) Forecast, by Application 2020 & 2033
- Table 82: India Plastic Shrink Wrap Volume (K) Forecast, by Application 2020 & 2033
- Table 83: Japan Plastic Shrink Wrap Revenue (undefined) Forecast, by Application 2020 & 2033
- Table 84: Japan Plastic Shrink Wrap Volume (K) Forecast, by Application 2020 & 2033
- Table 85: South Korea Plastic Shrink Wrap Revenue (undefined) Forecast, by Application 2020 & 2033
- Table 86: South Korea Plastic Shrink Wrap Volume (K) Forecast, by Application 2020 & 2033
- Table 87: ASEAN Plastic Shrink Wrap Revenue (undefined) Forecast, by Application 2020 & 2033
- Table 88: ASEAN Plastic Shrink Wrap Volume (K) Forecast, by Application 2020 & 2033
- Table 89: Oceania Plastic Shrink Wrap Revenue (undefined) Forecast, by Application 2020 & 2033
- Table 90: Oceania Plastic Shrink Wrap Volume (K) Forecast, by Application 2020 & 2033
- Table 91: Rest of Asia Pacific Plastic Shrink Wrap Revenue (undefined) Forecast, by Application 2020 & 2033
- Table 92: Rest of Asia Pacific Plastic Shrink Wrap Volume (K) Forecast, by Application 2020 & 2033
Frequently Asked Questions
1. What is the projected Compound Annual Growth Rate (CAGR) of the Plastic Shrink Wrap?
The projected CAGR is approximately 6.3%.
2. Which companies are prominent players in the Plastic Shrink Wrap?
Key companies in the market include Amcor plc, International Plastics Inc, Intertape Polymer Group, J K Polyfilm, Coveris Holdings, Ceisa Semo, Clondalkin Group, RKW Group, Berry Global, Plastotecnica SpA, Clearpack, Baroda Packaging, Brentwood Plastic, Aintree Plastics, Elite Plastics, Xinjiang Rival Tech, Poly-Pack Verpackungs-GmbH.
3. What are the main segments of the Plastic Shrink Wrap?
The market segments include Application, Types.
4. Can you provide details about the market size?
The market size is estimated to be USD XXX N/A as of 2022.
5. What are some drivers contributing to market growth?
N/A
6. What are the notable trends driving market growth?
N/A
7. Are there any restraints impacting market growth?
N/A
8. Can you provide examples of recent developments in the market?
N/A
9. What pricing options are available for accessing the report?
Pricing options include single-user, multi-user, and enterprise licenses priced at USD 3350.00, USD 5025.00, and USD 6700.00 respectively.
10. Is the market size provided in terms of value or volume?
The market size is provided in terms of value, measured in N/A and volume, measured in K.
11. Are there any specific market keywords associated with the report?
Yes, the market keyword associated with the report is "Plastic Shrink Wrap," which aids in identifying and referencing the specific market segment covered.
12. How do I determine which pricing option suits my needs best?
The pricing options vary based on user requirements and access needs. Individual users may opt for single-user licenses, while businesses requiring broader access may choose multi-user or enterprise licenses for cost-effective access to the report.
13. Are there any additional resources or data provided in the Plastic Shrink Wrap report?
While the report offers comprehensive insights, it's advisable to review the specific contents or supplementary materials provided to ascertain if additional resources or data are available.
14. How can I stay updated on further developments or reports in the Plastic Shrink Wrap?
To stay informed about further developments, trends, and reports in the Plastic Shrink Wrap, consider subscribing to industry newsletters, following relevant companies and organizations, or regularly checking reputable industry news sources and publications.
Methodology
Step 1 - Identification of Relevant Samples Size from Population Database


Step 2 - Approaches for Defining Global Market Size (Value, Volume* & Price*)

Note*: In applicable scenarios
Step 3 - Data Sources
Primary Research
- Web Analytics
- Survey Reports
- Research Institute
- Latest Research Reports
- Opinion Leaders
Secondary Research
- Annual Reports
- White Paper
- Latest Press Release
- Industry Association
- Paid Database
- Investor Presentations

Step 4 - Data Triangulation
Involves using different sources of information in order to increase the validity of a study
These sources are likely to be stakeholders in a program - participants, other researchers, program staff, other community members, and so on.
Then we put all data in single framework & apply various statistical tools to find out the dynamic on the market.
During the analysis stage, feedback from the stakeholder groups would be compared to determine areas of agreement as well as areas of divergence