

Key Insights
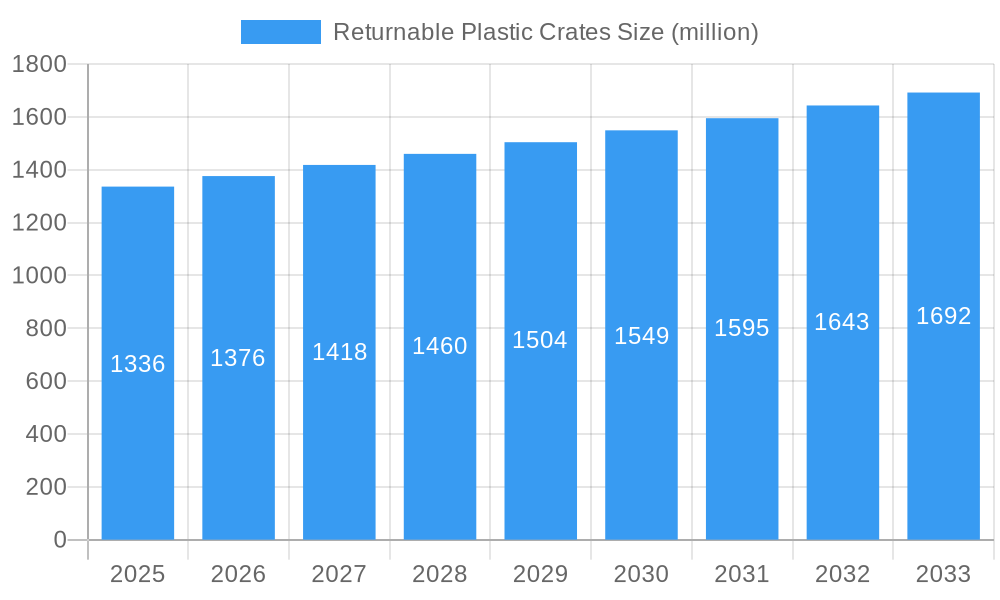
The global market for Returnable Plastic Crates is poised for steady expansion, projected to reach approximately USD 1336 million by 2025, growing at a Compound Annual Growth Rate (CAGR) of 3% over the forecast period extending to 2033. This growth is underpinned by a robust demand from key sectors like Food & Beverages and Pharmaceuticals, driven by increasing consumer awareness regarding sustainability and the inherent efficiency benefits of reusable packaging solutions. The shift away from single-use plastics and the imperative for streamlined supply chains are significant tailwinds, encouraging businesses to invest in durable and cost-effective returnable crate systems. Furthermore, advancements in plastic material science are leading to the development of lighter, stronger, and more eco-friendly crates, enhancing their appeal across various industrial applications. The Food & Beverages sector, in particular, is a major consumer due to stringent hygiene requirements and the need for efficient product handling from farm to fork. Similarly, the pharmaceutical industry leverages these crates for secure and traceable transport of temperature-sensitive and high-value medications.
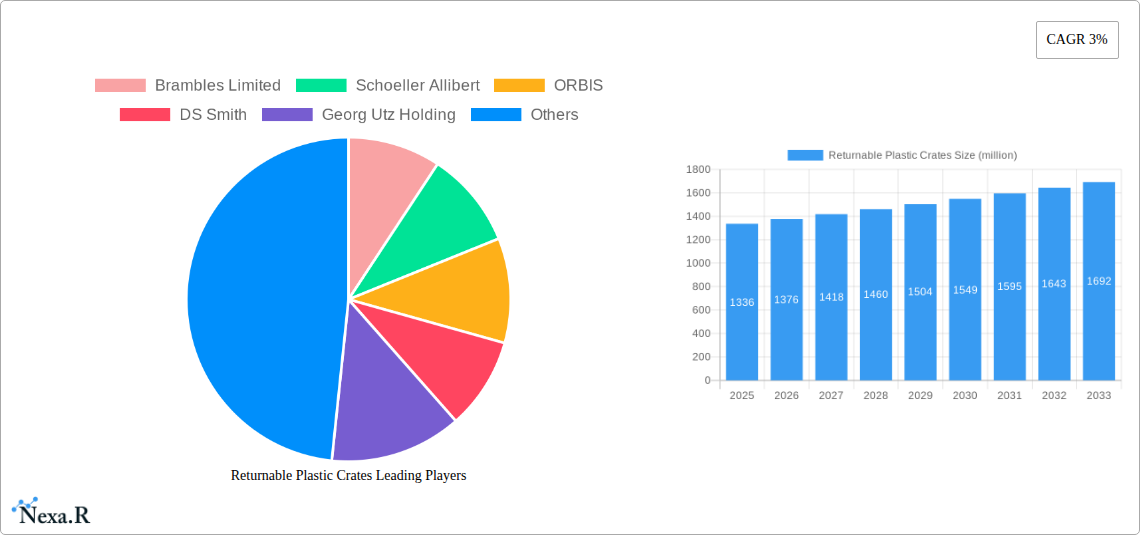
Returnable Plastic Crates Market Size (In Billion)
The market is characterized by a dynamic competitive landscape, with prominent players like Brambles Limited, Schoeller Allibert, and ORBIS actively innovating and expanding their product portfolios. The integration of smart technologies, such as RFID tagging for enhanced inventory management and traceability, is emerging as a key trend. However, the market faces certain restraints, including initial capital investment costs for acquiring large volumes of crates and the logistical challenges associated with managing reverse logistics and crate pooling systems. Nonetheless, the long-term cost savings and environmental advantages are increasingly outweighing these hurdles. Geographically, Asia Pacific, led by China and India, is expected to witness significant growth due to rapid industrialization and a burgeoning e-commerce sector. North America and Europe continue to be mature markets with a strong emphasis on sustainable packaging practices, contributing to consistent demand. The increasing focus on circular economy principles globally will further propel the adoption of returnable plastic crates in the coming years.
Returnable Plastic Crates Company Market Share
Returnable Plastic Crates Market Dynamics & Structure
The global returnable plastic crates market exhibits a moderately concentrated structure, driven by a few major global players and a significant number of regional and specialized manufacturers. Technological innovation is primarily focused on material science for enhanced durability and recyclability, automated handling integration, and smart tracking capabilities. Regulatory frameworks, particularly concerning food safety, environmental sustainability, and waste management, significantly influence market adoption and material choices. Competitive product substitutes include single-use packaging, wooden crates, and metal containers, each with distinct cost and performance profiles. End-user demographics are increasingly favoring reusable solutions due to growing environmental consciousness and stringent regulations. Mergers and acquisitions (M&A) trends are observed as companies seek to expand their geographic reach, product portfolios, and gain economies of scale.
- Market Concentration: Dominated by key players like Brambles Limited and Schoeller Allibert, with a substantial presence of regional manufacturers.
- Technological Innovation Drivers: Development of lightweight, high-strength plastics (e.g., advanced PE, PP formulations), RFID integration for inventory management, and eco-friendly material sourcing.
- Regulatory Frameworks: Compliance with food-grade certifications, Extended Producer Responsibility (EPR) schemes, and international shipping standards.
- Competitive Product Substitutes: Wooden pallets and crates, cardboard boxes, metal containers, and single-use plastic packaging.
- End-User Demographics: Growing demand from e-commerce logistics, sustainable supply chain initiatives, and industries with high product turnover.
- M&A Trends: Strategic acquisitions to broaden service offerings, enter new markets, and enhance technological capabilities.
Returnable Plastic Crates Growth Trends & Insights
The returnable plastic crates market is poised for robust expansion, driven by a confluence of escalating environmental concerns, increasing regulatory pressures for sustainable packaging solutions, and the inherent economic advantages of reusability. This market has witnessed a significant evolution from its traditional usage to becoming an integral component of modern, efficient supply chains. The base year of 2025 signifies a pivotal point where established trends are solidifying, and new growth avenues are emerging. The market size in 2025 is estimated to reach approximately $16.5 billion units, with a projected Compound Annual Growth Rate (CAGR) of 6.8% from 2025 to 2033. This growth is underpinned by the increasing adoption of pool-based systems and the demand for customized crate solutions tailored to specific product dimensions and handling requirements.
Technological advancements are playing a crucial role in shaping market dynamics. The integration of smart technologies, such as RFID tags and IoT sensors, is enhancing traceability, inventory management, and overall supply chain visibility. This not only minimizes losses and optimizes logistics but also provides valuable data for performance analysis and process improvement. Furthermore, material innovation is leading to the development of more durable, lighter, and environmentally friendly plastic formulations, such as those derived from recycled content or bio-based polymers, further enhancing the appeal of returnable crates.
Consumer behavior shifts, particularly among B2B clients, are increasingly prioritizing sustainability and cost-efficiency. Businesses are recognizing the long-term cost savings associated with reduced packaging waste, lower disposal fees, and enhanced product protection offered by returnable crates. The rising prominence of e-commerce has further amplified the demand for robust and standardized packaging that can withstand the rigors of multi-modal transportation. Adoption rates are particularly high in sectors like Food & Beverages and Pharmaceuticals, where hygiene, product integrity, and traceability are paramount. The Food & Beverages segment, representing an estimated 35% of the market in 2025, is a primary driver, followed closely by Retail (approx. 28%) and Industrial (approx. 22%) applications. The shift from single-use packaging to durable, reusable alternatives is not just an environmental imperative but also a strategic business decision for many organizations aiming to optimize their operational efficiency and environmental footprint. The market penetration of returnable plastic crates is expected to deepen significantly across various industries as the benefits of a circular economy become more widely recognized and adopted.
Dominant Regions, Countries, or Segments in Returnable Plastic Crates
The global returnable plastic crates market is experiencing dynamic growth, with significant regional variations in adoption and market share. North America and Europe currently lead this market, driven by mature industrial sectors, stringent environmental regulations, and advanced logistics infrastructure. North America, with an estimated market share of 30% in 2025, is a significant consumer, fueled by its extensive retail and food & beverage industries, alongside a growing emphasis on supply chain optimization and sustainability initiatives. Countries like the United States and Canada are prominent adopters, with companies such as ORBIS and Rehrig Pacific Company playing key roles in shaping the regional landscape.
Europe, accounting for approximately 28% of the global market in 2025, is characterized by a strong regulatory push towards circular economy principles and a well-established network of crate pooling services. Germany, France, and the UK are key markets, with a high concentration of reusable packaging solutions in sectors like food, automotive, and pharmaceuticals. Schoeller Allibert and Georg Utz Holding are significant players in this region, contributing to the widespread use of returnable plastic crates.
Asia-Pacific is emerging as a high-growth region, with an estimated market share of 25% in 2025 and a projected CAGR of 8.5% during the forecast period. This surge is attributed to rapid industrialization, expanding e-commerce penetration, and increasing government focus on sustainable waste management. China, in particular, is a dominant force within the region, driven by its massive manufacturing output and growing consumer market. Companies like Suzhou Dasen Plastic, Jiangsu Yujia, and Suzhou First Plastic are instrumental in catering to this burgeoning demand. India is also a significant contributor, with Nilkamal and Supreme Industries leading the charge in providing returnable packaging solutions for various industries.
Dominant Region: North America
- Key Drivers: Advanced logistics, strong retail and food & beverage sectors, environmental regulations, and supply chain efficiency focus.
- Market Share (2025): Approximately 30%
- Prominent Countries: United States, Canada
- Key Players: ORBIS, Rehrig Pacific Company
Strong Contender: Europe
- Key Drivers: Circular economy initiatives, strict environmental policies, developed industrial base, and extensive crate pooling services.
- Market Share (2025): Approximately 28%
- Prominent Countries: Germany, France, United Kingdom
- Key Players: Schoeller Allibert, Georg Utz Holding
High Growth Region: Asia-Pacific
- Key Drivers: Rapid industrialization, booming e-commerce, government sustainability focus, and increasing disposable income.
- Market Share (2025): Approximately 25%
- Projected CAGR (2025-2033): 8.5%
- Prominent Countries: China, India
- Key Players (China): Suzhou Dasen Plastic, Jiangsu Yujia, Suzhou First Plastic, Shenzhen Xingfeng Plastic
- Key Players (India): Supreme Industries, Nilkamal
Within the segments, Food & Beverages is the leading application, accounting for an estimated 35% of the market in 2025. This is due to the critical need for hygiene, product integrity, and efficient handling in the food supply chain, from farm to fork. Retail follows closely with a 28% market share, driven by the demands of in-store logistics, omnichannel fulfillment, and the reduction of packaging waste. The Industrial segment, holding approximately 22%, benefits from the durability and protective qualities of plastic crates in manufacturing, automotive, and general logistics. In terms of material type, Polypropylene (PP) dominates, representing an estimated 60% of the market in 2025, owing to its excellent balance of strength, durability, chemical resistance, and cost-effectiveness. Polyethylene (PE), particularly HDPE, is also a significant material, accounting for around 30%, valued for its impact resistance and flexibility.
Dominant Application Segment: Food & Beverages
- Market Share (2025): Approximately 35%
- Key Factors: Hygiene requirements, product preservation, efficient handling, and regulatory compliance.
Significant Application Segment: Retail
- Market Share (2025): Approximately 28%
- Key Factors: E-commerce fulfillment, in-store logistics, omnichannel strategies, waste reduction.
Dominant Material Type: PP (Polypropylene)
- Market Share (2025): Approximately 60%
- Key Factors: High durability, chemical resistance, cost-effectiveness, impact strength.
Significant Material Type: PE (Polyethylene)
- Market Share (2025): Approximately 30%
- Key Factors: Impact resistance, flexibility, moisture resistance.
Returnable Plastic Crates Product Landscape
The returnable plastic crates market is characterized by continuous product innovation aimed at enhancing efficiency, durability, and sustainability. Manufacturers are developing crates with optimized dimensions for improved stacking density and compatibility with automated handling systems. Advanced material formulations, such as high-impact Polypropylene (PP) and specialized Polyethylene (PE) blends, offer superior resistance to extreme temperatures, chemicals, and physical stress, extending product lifespan. Innovations include integrated RFID or QR code capabilities for real-time tracking and inventory management, foldable designs for space-saving return logistics, and specialized venting or insulation features for sensitive goods. The market also sees a growing trend towards crates made from recycled plastics or bio-based materials, aligning with global sustainability goals. Unique selling propositions often revolve around customizability, load-bearing capacity, and adherence to stringent industry-specific certifications, such as food-grade compliance.
Key Drivers, Barriers & Challenges in Returnable Plastic Crates
Key Drivers:
- Environmental Sustainability: Growing global awareness and regulatory push for reducing single-use packaging waste, driving demand for reusable solutions.
- Cost-Effectiveness: Long-term savings through reduced packaging expenditure, lower disposal costs, and minimized product damage.
- Supply Chain Efficiency: Enhanced traceability, optimized logistics, and improved product handling facilitated by standardized and durable crates.
- Regulatory Compliance: Increasingly stringent regulations regarding packaging waste and food safety in sectors like Food & Beverages and Pharmaceuticals.
- Growth of E-commerce: The need for robust, reusable packaging that can withstand the demands of online order fulfillment and delivery.
Key Barriers & Challenges:
- Initial Investment Cost: Higher upfront purchase price compared to single-use alternatives can be a deterrent for some businesses.
- Logistics Complexity: Managing the return, cleaning, and redistribution of crates requires efficient reverse logistics systems.
- Competition from Existing Infrastructure: Inertia in adopting new systems and reliance on established single-use packaging supply chains.
- Material Contamination & Cleaning: Ensuring hygiene and preventing cross-contamination, particularly in food and pharmaceutical applications.
- Theft and Loss: Ensuring crate security and minimizing loss during transit and storage.
- Supply Chain Disruptions: Volatility in raw material prices (e.g., virgin plastic resins) and global shipping delays can impact availability and cost. The estimated impact of supply chain disruptions on the market could be in the range of 5-7% of projected growth in any given year.
Emerging Opportunities in Returnable Plastic Crates
Emerging opportunities in the returnable plastic crates market lie in the expansion of pooling services, particularly in developing economies and specific niche industries. The integration of IoT and AI for predictive maintenance of crates and optimized fleet management presents a significant avenue. There is also a growing demand for highly specialized crates designed for the unique requirements of industries like the burgeoning electric vehicle battery logistics or the complex pharmaceutical cold chain. Furthermore, the development of "smart crates" with embedded sensors for monitoring temperature, humidity, and shock events offers enhanced value propositions for high-value or sensitive goods. The circular economy model also opens doors for innovative crate-as-a-service (CaaS) business models, where companies offer crate management as a complete solution rather than just selling the product.
Growth Accelerators in the Returnable Plastic Crates Industry
Several factors are accelerating the growth of the returnable plastic crates industry. Technological breakthroughs in material science are yielding lighter, stronger, and more sustainable crate options, appealing to a broader range of applications. Strategic partnerships between crate manufacturers and logistics providers are creating integrated solutions that streamline supply chains and offer enhanced value to end-users. Furthermore, the increasing adoption of crate-sharing platforms and standardization initiatives across industries are lowering barriers to entry and fostering greater efficiency in reusable packaging systems. Government incentives promoting sustainability and waste reduction are also playing a crucial role in driving market adoption and innovation. The continued expansion of the e-commerce sector and the increasing focus on corporate social responsibility are powerful market expansion strategies that fuel long-term growth.
Key Players Shaping the Returnable Plastic Crates Market
Brambles Limited Schoeller Allibert ORBIS DS Smith Georg Utz Holding Didak Injection TEPSA TranPak Inc. Gamma-Wopla NV Ravensbourn Limited Enko Plastics Suzhou Dasen Plastic Jiangsu Yujia Suzhou First Plastic Shenzhen Xingfeng Plastic Supreme Industries Nilkamal Mpact Limited Rehrig Pacific Company Delbrouck Myers Industries Zhejiang Zhengji Plastic
Notable Milestones in Returnable Plastic Crates Sector
- 2019: Increased global regulatory focus on single-use plastic reduction initiatives, boosting interest in reusable packaging.
- 2020: Surge in e-commerce demand due to the pandemic, highlighting the need for durable and efficient logistics packaging like returnable crates.
- 2021: Advancements in smart crate technology with integrated RFID and IoT capabilities gaining traction for improved traceability.
- 2022: Growing emphasis on incorporating recycled content into plastic crates, aligning with circular economy principles.
- 2023: Expansion of crate pooling services in emerging markets, making reusable solutions more accessible.
- 2024: Increased investment in sustainable manufacturing processes by key players to reduce carbon footprint.
In-Depth Returnable Plastic Crates Market Outlook
The future outlook for the returnable plastic crates market is exceptionally positive, driven by a sustained global shift towards sustainable business practices and highly efficient supply chain management. Growth accelerators such as ongoing material innovations, leading to lighter and more robust crate designs, and the widespread adoption of smart technologies for enhanced tracking and inventory control, will continue to propel the market forward. Strategic collaborations between manufacturers, logistics providers, and end-users will foster integrated solutions, further optimizing operational efficiency. The increasing enforcement of environmental regulations worldwide will solidify the competitive advantage of reusable packaging over single-use alternatives. Furthermore, the burgeoning e-commerce sector and the expanding global manufacturing base present significant untapped markets for robust and reliable returnable plastic crate solutions. The market is expected to witness substantial growth in emerging economies as awareness of sustainability benefits and cost efficiencies increases.
Returnable Plastic Crates Segmentation
-
1. Application
- 1.1. Food & Beverages
- 1.2. Pharmaceuticals
- 1.3. Retail
- 1.4. Industrial
- 1.5. Others
-
2. Types
- 2.1. PE
- 2.2. PP
- 2.3. PVC
- 2.4. Others
Returnable Plastic Crates Segmentation By Geography
-
1. North America
- 1.1. United States
- 1.2. Canada
- 1.3. Mexico
-
2. South America
- 2.1. Brazil
- 2.2. Argentina
- 2.3. Rest of South America
-
3. Europe
- 3.1. United Kingdom
- 3.2. Germany
- 3.3. France
- 3.4. Italy
- 3.5. Spain
- 3.6. Russia
- 3.7. Benelux
- 3.8. Nordics
- 3.9. Rest of Europe
-
4. Middle East & Africa
- 4.1. Turkey
- 4.2. Israel
- 4.3. GCC
- 4.4. North Africa
- 4.5. South Africa
- 4.6. Rest of Middle East & Africa
-
5. Asia Pacific
- 5.1. China
- 5.2. India
- 5.3. Japan
- 5.4. South Korea
- 5.5. ASEAN
- 5.6. Oceania
- 5.7. Rest of Asia Pacific
Returnable Plastic Crates Regional Market Share
Geographic Coverage of Returnable Plastic Crates
Returnable Plastic Crates REPORT HIGHLIGHTS
| Aspects | Details |
|---|---|
| Study Period | 2020-2034 |
| Base Year | 2025 |
| Estimated Year | 2026 |
| Forecast Period | 2026-2034 |
| Historical Period | 2020-2025 |
| Growth Rate | CAGR of 3% from 2020-2034 |
| Segmentation |
|
Table of Contents
- 1. Introduction
- 1.1. Research Scope
- 1.2. Market Segmentation
- 1.3. Research Methodology
- 1.4. Definitions and Assumptions
- 2. Executive Summary
- 2.1. Introduction
- 3. Market Dynamics
- 3.1. Introduction
- 3.2. Market Drivers
- 3.3. Market Restrains
- 3.4. Market Trends
- 4. Market Factor Analysis
- 4.1. Porters Five Forces
- 4.2. Supply/Value Chain
- 4.3. PESTEL analysis
- 4.4. Market Entropy
- 4.5. Patent/Trademark Analysis
- 5. Global Returnable Plastic Crates Analysis, Insights and Forecast, 2020-2032
- 5.1. Market Analysis, Insights and Forecast - by Application
- 5.1.1. Food & Beverages
- 5.1.2. Pharmaceuticals
- 5.1.3. Retail
- 5.1.4. Industrial
- 5.1.5. Others
- 5.2. Market Analysis, Insights and Forecast - by Types
- 5.2.1. PE
- 5.2.2. PP
- 5.2.3. PVC
- 5.2.4. Others
- 5.3. Market Analysis, Insights and Forecast - by Region
- 5.3.1. North America
- 5.3.2. South America
- 5.3.3. Europe
- 5.3.4. Middle East & Africa
- 5.3.5. Asia Pacific
- 5.1. Market Analysis, Insights and Forecast - by Application
- 6. North America Returnable Plastic Crates Analysis, Insights and Forecast, 2020-2032
- 6.1. Market Analysis, Insights and Forecast - by Application
- 6.1.1. Food & Beverages
- 6.1.2. Pharmaceuticals
- 6.1.3. Retail
- 6.1.4. Industrial
- 6.1.5. Others
- 6.2. Market Analysis, Insights and Forecast - by Types
- 6.2.1. PE
- 6.2.2. PP
- 6.2.3. PVC
- 6.2.4. Others
- 6.1. Market Analysis, Insights and Forecast - by Application
- 7. South America Returnable Plastic Crates Analysis, Insights and Forecast, 2020-2032
- 7.1. Market Analysis, Insights and Forecast - by Application
- 7.1.1. Food & Beverages
- 7.1.2. Pharmaceuticals
- 7.1.3. Retail
- 7.1.4. Industrial
- 7.1.5. Others
- 7.2. Market Analysis, Insights and Forecast - by Types
- 7.2.1. PE
- 7.2.2. PP
- 7.2.3. PVC
- 7.2.4. Others
- 7.1. Market Analysis, Insights and Forecast - by Application
- 8. Europe Returnable Plastic Crates Analysis, Insights and Forecast, 2020-2032
- 8.1. Market Analysis, Insights and Forecast - by Application
- 8.1.1. Food & Beverages
- 8.1.2. Pharmaceuticals
- 8.1.3. Retail
- 8.1.4. Industrial
- 8.1.5. Others
- 8.2. Market Analysis, Insights and Forecast - by Types
- 8.2.1. PE
- 8.2.2. PP
- 8.2.3. PVC
- 8.2.4. Others
- 8.1. Market Analysis, Insights and Forecast - by Application
- 9. Middle East & Africa Returnable Plastic Crates Analysis, Insights and Forecast, 2020-2032
- 9.1. Market Analysis, Insights and Forecast - by Application
- 9.1.1. Food & Beverages
- 9.1.2. Pharmaceuticals
- 9.1.3. Retail
- 9.1.4. Industrial
- 9.1.5. Others
- 9.2. Market Analysis, Insights and Forecast - by Types
- 9.2.1. PE
- 9.2.2. PP
- 9.2.3. PVC
- 9.2.4. Others
- 9.1. Market Analysis, Insights and Forecast - by Application
- 10. Asia Pacific Returnable Plastic Crates Analysis, Insights and Forecast, 2020-2032
- 10.1. Market Analysis, Insights and Forecast - by Application
- 10.1.1. Food & Beverages
- 10.1.2. Pharmaceuticals
- 10.1.3. Retail
- 10.1.4. Industrial
- 10.1.5. Others
- 10.2. Market Analysis, Insights and Forecast - by Types
- 10.2.1. PE
- 10.2.2. PP
- 10.2.3. PVC
- 10.2.4. Others
- 10.1. Market Analysis, Insights and Forecast - by Application
- 11. Competitive Analysis
- 11.1. Global Market Share Analysis 2025
- 11.2. Company Profiles
- 11.2.1 Brambles Limited
- 11.2.1.1. Overview
- 11.2.1.2. Products
- 11.2.1.3. SWOT Analysis
- 11.2.1.4. Recent Developments
- 11.2.1.5. Financials (Based on Availability)
- 11.2.2 Schoeller Allibert
- 11.2.2.1. Overview
- 11.2.2.2. Products
- 11.2.2.3. SWOT Analysis
- 11.2.2.4. Recent Developments
- 11.2.2.5. Financials (Based on Availability)
- 11.2.3 ORBIS
- 11.2.3.1. Overview
- 11.2.3.2. Products
- 11.2.3.3. SWOT Analysis
- 11.2.3.4. Recent Developments
- 11.2.3.5. Financials (Based on Availability)
- 11.2.4 DS Smith
- 11.2.4.1. Overview
- 11.2.4.2. Products
- 11.2.4.3. SWOT Analysis
- 11.2.4.4. Recent Developments
- 11.2.4.5. Financials (Based on Availability)
- 11.2.5 Georg Utz Holding
- 11.2.5.1. Overview
- 11.2.5.2. Products
- 11.2.5.3. SWOT Analysis
- 11.2.5.4. Recent Developments
- 11.2.5.5. Financials (Based on Availability)
- 11.2.6 Didak Injection
- 11.2.6.1. Overview
- 11.2.6.2. Products
- 11.2.6.3. SWOT Analysis
- 11.2.6.4. Recent Developments
- 11.2.6.5. Financials (Based on Availability)
- 11.2.7 TEPSA
- 11.2.7.1. Overview
- 11.2.7.2. Products
- 11.2.7.3. SWOT Analysis
- 11.2.7.4. Recent Developments
- 11.2.7.5. Financials (Based on Availability)
- 11.2.8 TranPak Inc.
- 11.2.8.1. Overview
- 11.2.8.2. Products
- 11.2.8.3. SWOT Analysis
- 11.2.8.4. Recent Developments
- 11.2.8.5. Financials (Based on Availability)
- 11.2.9 Gamma-Wopla NV
- 11.2.9.1. Overview
- 11.2.9.2. Products
- 11.2.9.3. SWOT Analysis
- 11.2.9.4. Recent Developments
- 11.2.9.5. Financials (Based on Availability)
- 11.2.10 Ravensbourn Limited
- 11.2.10.1. Overview
- 11.2.10.2. Products
- 11.2.10.3. SWOT Analysis
- 11.2.10.4. Recent Developments
- 11.2.10.5. Financials (Based on Availability)
- 11.2.11 Enko Plastics
- 11.2.11.1. Overview
- 11.2.11.2. Products
- 11.2.11.3. SWOT Analysis
- 11.2.11.4. Recent Developments
- 11.2.11.5. Financials (Based on Availability)
- 11.2.12 Suzhou Dasen Plastic
- 11.2.12.1. Overview
- 11.2.12.2. Products
- 11.2.12.3. SWOT Analysis
- 11.2.12.4. Recent Developments
- 11.2.12.5. Financials (Based on Availability)
- 11.2.13 Jiangsu Yujia
- 11.2.13.1. Overview
- 11.2.13.2. Products
- 11.2.13.3. SWOT Analysis
- 11.2.13.4. Recent Developments
- 11.2.13.5. Financials (Based on Availability)
- 11.2.14 Suzhou First Plastic
- 11.2.14.1. Overview
- 11.2.14.2. Products
- 11.2.14.3. SWOT Analysis
- 11.2.14.4. Recent Developments
- 11.2.14.5. Financials (Based on Availability)
- 11.2.15 Shenzhen Xingfeng Plastic
- 11.2.15.1. Overview
- 11.2.15.2. Products
- 11.2.15.3. SWOT Analysis
- 11.2.15.4. Recent Developments
- 11.2.15.5. Financials (Based on Availability)
- 11.2.16 Supreme Industries
- 11.2.16.1. Overview
- 11.2.16.2. Products
- 11.2.16.3. SWOT Analysis
- 11.2.16.4. Recent Developments
- 11.2.16.5. Financials (Based on Availability)
- 11.2.17 Nilkamal
- 11.2.17.1. Overview
- 11.2.17.2. Products
- 11.2.17.3. SWOT Analysis
- 11.2.17.4. Recent Developments
- 11.2.17.5. Financials (Based on Availability)
- 11.2.18 Mpact Limited
- 11.2.18.1. Overview
- 11.2.18.2. Products
- 11.2.18.3. SWOT Analysis
- 11.2.18.4. Recent Developments
- 11.2.18.5. Financials (Based on Availability)
- 11.2.19 Rehrig Pacific Company
- 11.2.19.1. Overview
- 11.2.19.2. Products
- 11.2.19.3. SWOT Analysis
- 11.2.19.4. Recent Developments
- 11.2.19.5. Financials (Based on Availability)
- 11.2.20 Delbrouck
- 11.2.20.1. Overview
- 11.2.20.2. Products
- 11.2.20.3. SWOT Analysis
- 11.2.20.4. Recent Developments
- 11.2.20.5. Financials (Based on Availability)
- 11.2.21 Myers Industries
- 11.2.21.1. Overview
- 11.2.21.2. Products
- 11.2.21.3. SWOT Analysis
- 11.2.21.4. Recent Developments
- 11.2.21.5. Financials (Based on Availability)
- 11.2.22 Zhejiang Zhengji Plastic
- 11.2.22.1. Overview
- 11.2.22.2. Products
- 11.2.22.3. SWOT Analysis
- 11.2.22.4. Recent Developments
- 11.2.22.5. Financials (Based on Availability)
- 11.2.1 Brambles Limited
List of Figures
- Figure 1: Global Returnable Plastic Crates Revenue Breakdown (million, %) by Region 2025 & 2033
- Figure 2: North America Returnable Plastic Crates Revenue (million), by Application 2025 & 2033
- Figure 3: North America Returnable Plastic Crates Revenue Share (%), by Application 2025 & 2033
- Figure 4: North America Returnable Plastic Crates Revenue (million), by Types 2025 & 2033
- Figure 5: North America Returnable Plastic Crates Revenue Share (%), by Types 2025 & 2033
- Figure 6: North America Returnable Plastic Crates Revenue (million), by Country 2025 & 2033
- Figure 7: North America Returnable Plastic Crates Revenue Share (%), by Country 2025 & 2033
- Figure 8: South America Returnable Plastic Crates Revenue (million), by Application 2025 & 2033
- Figure 9: South America Returnable Plastic Crates Revenue Share (%), by Application 2025 & 2033
- Figure 10: South America Returnable Plastic Crates Revenue (million), by Types 2025 & 2033
- Figure 11: South America Returnable Plastic Crates Revenue Share (%), by Types 2025 & 2033
- Figure 12: South America Returnable Plastic Crates Revenue (million), by Country 2025 & 2033
- Figure 13: South America Returnable Plastic Crates Revenue Share (%), by Country 2025 & 2033
- Figure 14: Europe Returnable Plastic Crates Revenue (million), by Application 2025 & 2033
- Figure 15: Europe Returnable Plastic Crates Revenue Share (%), by Application 2025 & 2033
- Figure 16: Europe Returnable Plastic Crates Revenue (million), by Types 2025 & 2033
- Figure 17: Europe Returnable Plastic Crates Revenue Share (%), by Types 2025 & 2033
- Figure 18: Europe Returnable Plastic Crates Revenue (million), by Country 2025 & 2033
- Figure 19: Europe Returnable Plastic Crates Revenue Share (%), by Country 2025 & 2033
- Figure 20: Middle East & Africa Returnable Plastic Crates Revenue (million), by Application 2025 & 2033
- Figure 21: Middle East & Africa Returnable Plastic Crates Revenue Share (%), by Application 2025 & 2033
- Figure 22: Middle East & Africa Returnable Plastic Crates Revenue (million), by Types 2025 & 2033
- Figure 23: Middle East & Africa Returnable Plastic Crates Revenue Share (%), by Types 2025 & 2033
- Figure 24: Middle East & Africa Returnable Plastic Crates Revenue (million), by Country 2025 & 2033
- Figure 25: Middle East & Africa Returnable Plastic Crates Revenue Share (%), by Country 2025 & 2033
- Figure 26: Asia Pacific Returnable Plastic Crates Revenue (million), by Application 2025 & 2033
- Figure 27: Asia Pacific Returnable Plastic Crates Revenue Share (%), by Application 2025 & 2033
- Figure 28: Asia Pacific Returnable Plastic Crates Revenue (million), by Types 2025 & 2033
- Figure 29: Asia Pacific Returnable Plastic Crates Revenue Share (%), by Types 2025 & 2033
- Figure 30: Asia Pacific Returnable Plastic Crates Revenue (million), by Country 2025 & 2033
- Figure 31: Asia Pacific Returnable Plastic Crates Revenue Share (%), by Country 2025 & 2033
List of Tables
- Table 1: Global Returnable Plastic Crates Revenue million Forecast, by Application 2020 & 2033
- Table 2: Global Returnable Plastic Crates Revenue million Forecast, by Types 2020 & 2033
- Table 3: Global Returnable Plastic Crates Revenue million Forecast, by Region 2020 & 2033
- Table 4: Global Returnable Plastic Crates Revenue million Forecast, by Application 2020 & 2033
- Table 5: Global Returnable Plastic Crates Revenue million Forecast, by Types 2020 & 2033
- Table 6: Global Returnable Plastic Crates Revenue million Forecast, by Country 2020 & 2033
- Table 7: United States Returnable Plastic Crates Revenue (million) Forecast, by Application 2020 & 2033
- Table 8: Canada Returnable Plastic Crates Revenue (million) Forecast, by Application 2020 & 2033
- Table 9: Mexico Returnable Plastic Crates Revenue (million) Forecast, by Application 2020 & 2033
- Table 10: Global Returnable Plastic Crates Revenue million Forecast, by Application 2020 & 2033
- Table 11: Global Returnable Plastic Crates Revenue million Forecast, by Types 2020 & 2033
- Table 12: Global Returnable Plastic Crates Revenue million Forecast, by Country 2020 & 2033
- Table 13: Brazil Returnable Plastic Crates Revenue (million) Forecast, by Application 2020 & 2033
- Table 14: Argentina Returnable Plastic Crates Revenue (million) Forecast, by Application 2020 & 2033
- Table 15: Rest of South America Returnable Plastic Crates Revenue (million) Forecast, by Application 2020 & 2033
- Table 16: Global Returnable Plastic Crates Revenue million Forecast, by Application 2020 & 2033
- Table 17: Global Returnable Plastic Crates Revenue million Forecast, by Types 2020 & 2033
- Table 18: Global Returnable Plastic Crates Revenue million Forecast, by Country 2020 & 2033
- Table 19: United Kingdom Returnable Plastic Crates Revenue (million) Forecast, by Application 2020 & 2033
- Table 20: Germany Returnable Plastic Crates Revenue (million) Forecast, by Application 2020 & 2033
- Table 21: France Returnable Plastic Crates Revenue (million) Forecast, by Application 2020 & 2033
- Table 22: Italy Returnable Plastic Crates Revenue (million) Forecast, by Application 2020 & 2033
- Table 23: Spain Returnable Plastic Crates Revenue (million) Forecast, by Application 2020 & 2033
- Table 24: Russia Returnable Plastic Crates Revenue (million) Forecast, by Application 2020 & 2033
- Table 25: Benelux Returnable Plastic Crates Revenue (million) Forecast, by Application 2020 & 2033
- Table 26: Nordics Returnable Plastic Crates Revenue (million) Forecast, by Application 2020 & 2033
- Table 27: Rest of Europe Returnable Plastic Crates Revenue (million) Forecast, by Application 2020 & 2033
- Table 28: Global Returnable Plastic Crates Revenue million Forecast, by Application 2020 & 2033
- Table 29: Global Returnable Plastic Crates Revenue million Forecast, by Types 2020 & 2033
- Table 30: Global Returnable Plastic Crates Revenue million Forecast, by Country 2020 & 2033
- Table 31: Turkey Returnable Plastic Crates Revenue (million) Forecast, by Application 2020 & 2033
- Table 32: Israel Returnable Plastic Crates Revenue (million) Forecast, by Application 2020 & 2033
- Table 33: GCC Returnable Plastic Crates Revenue (million) Forecast, by Application 2020 & 2033
- Table 34: North Africa Returnable Plastic Crates Revenue (million) Forecast, by Application 2020 & 2033
- Table 35: South Africa Returnable Plastic Crates Revenue (million) Forecast, by Application 2020 & 2033
- Table 36: Rest of Middle East & Africa Returnable Plastic Crates Revenue (million) Forecast, by Application 2020 & 2033
- Table 37: Global Returnable Plastic Crates Revenue million Forecast, by Application 2020 & 2033
- Table 38: Global Returnable Plastic Crates Revenue million Forecast, by Types 2020 & 2033
- Table 39: Global Returnable Plastic Crates Revenue million Forecast, by Country 2020 & 2033
- Table 40: China Returnable Plastic Crates Revenue (million) Forecast, by Application 2020 & 2033
- Table 41: India Returnable Plastic Crates Revenue (million) Forecast, by Application 2020 & 2033
- Table 42: Japan Returnable Plastic Crates Revenue (million) Forecast, by Application 2020 & 2033
- Table 43: South Korea Returnable Plastic Crates Revenue (million) Forecast, by Application 2020 & 2033
- Table 44: ASEAN Returnable Plastic Crates Revenue (million) Forecast, by Application 2020 & 2033
- Table 45: Oceania Returnable Plastic Crates Revenue (million) Forecast, by Application 2020 & 2033
- Table 46: Rest of Asia Pacific Returnable Plastic Crates Revenue (million) Forecast, by Application 2020 & 2033
Frequently Asked Questions
1. What is the projected Compound Annual Growth Rate (CAGR) of the Returnable Plastic Crates?
The projected CAGR is approximately 3%.
2. Which companies are prominent players in the Returnable Plastic Crates?
Key companies in the market include Brambles Limited, Schoeller Allibert, ORBIS, DS Smith, Georg Utz Holding, Didak Injection, TEPSA, TranPak Inc., Gamma-Wopla NV, Ravensbourn Limited, Enko Plastics, Suzhou Dasen Plastic, Jiangsu Yujia, Suzhou First Plastic, Shenzhen Xingfeng Plastic, Supreme Industries, Nilkamal, Mpact Limited, Rehrig Pacific Company, Delbrouck, Myers Industries, Zhejiang Zhengji Plastic.
3. What are the main segments of the Returnable Plastic Crates?
The market segments include Application, Types.
4. Can you provide details about the market size?
The market size is estimated to be USD 10020 million as of 2022.
5. What are some drivers contributing to market growth?
N/A
6. What are the notable trends driving market growth?
N/A
7. Are there any restraints impacting market growth?
N/A
8. Can you provide examples of recent developments in the market?
N/A
9. What pricing options are available for accessing the report?
Pricing options include single-user, multi-user, and enterprise licenses priced at USD 2900.00, USD 4350.00, and USD 5800.00 respectively.
10. Is the market size provided in terms of value or volume?
The market size is provided in terms of value, measured in million.
11. Are there any specific market keywords associated with the report?
Yes, the market keyword associated with the report is "Returnable Plastic Crates," which aids in identifying and referencing the specific market segment covered.
12. How do I determine which pricing option suits my needs best?
The pricing options vary based on user requirements and access needs. Individual users may opt for single-user licenses, while businesses requiring broader access may choose multi-user or enterprise licenses for cost-effective access to the report.
13. Are there any additional resources or data provided in the Returnable Plastic Crates report?
While the report offers comprehensive insights, it's advisable to review the specific contents or supplementary materials provided to ascertain if additional resources or data are available.
14. How can I stay updated on further developments or reports in the Returnable Plastic Crates?
To stay informed about further developments, trends, and reports in the Returnable Plastic Crates, consider subscribing to industry newsletters, following relevant companies and organizations, or regularly checking reputable industry news sources and publications.
Methodology
Step 1 - Identification of Relevant Samples Size from Population Database


Step 2 - Approaches for Defining Global Market Size (Value, Volume* & Price*)

Note*: In applicable scenarios
Step 3 - Data Sources
Primary Research
- Web Analytics
- Survey Reports
- Research Institute
- Latest Research Reports
- Opinion Leaders
Secondary Research
- Annual Reports
- White Paper
- Latest Press Release
- Industry Association
- Paid Database
- Investor Presentations

Step 4 - Data Triangulation
Involves using different sources of information in order to increase the validity of a study
These sources are likely to be stakeholders in a program - participants, other researchers, program staff, other community members, and so on.
Then we put all data in single framework & apply various statistical tools to find out the dynamic on the market.
During the analysis stage, feedback from the stakeholder groups would be compared to determine areas of agreement as well as areas of divergence