

Key Insights
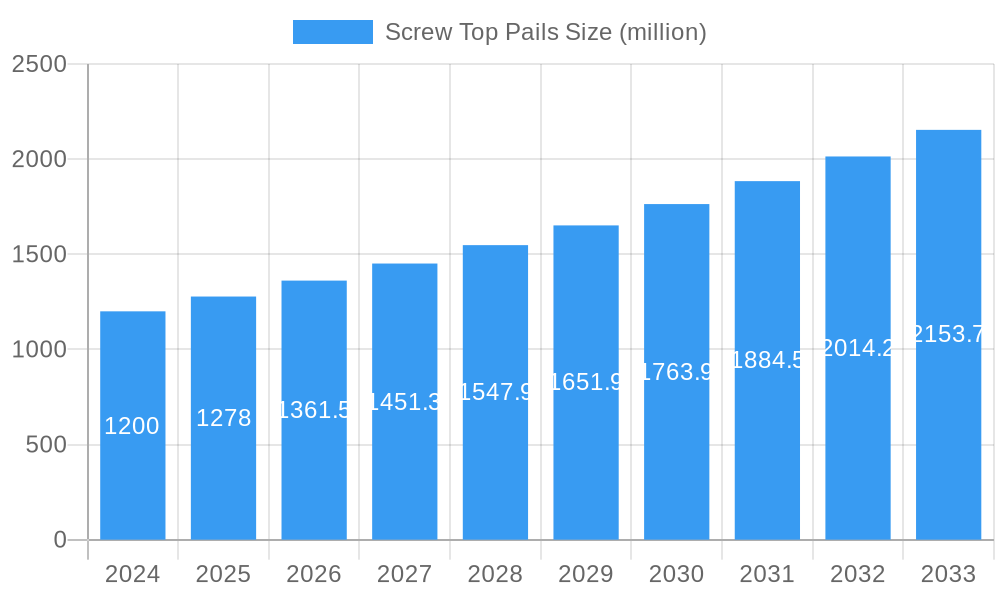
The global screw top pail market is experiencing robust growth, driven by increasing demand across diverse industries. The market's expansion is fueled by the versatile nature of screw top pails, offering superior sealing and protection compared to other packaging options. This makes them ideal for various applications, including the storage and transportation of chemicals, food products, paints, and industrial materials. The convenience and ease of use, along with their cost-effectiveness, contribute significantly to their widespread adoption. Furthermore, advancements in material science have led to the development of more durable and sustainable screw top pails, catering to the growing environmental consciousness. We estimate the current market size to be approximately $5 billion, with a Compound Annual Growth Rate (CAGR) of around 5% – indicating a steady and sustained trajectory of growth over the forecast period (2025-2033). This growth is expected to be further propelled by expanding manufacturing sectors in developing economies and rising consumer demand for packaged goods.
Screw Top Pails Market Size (In Billion)
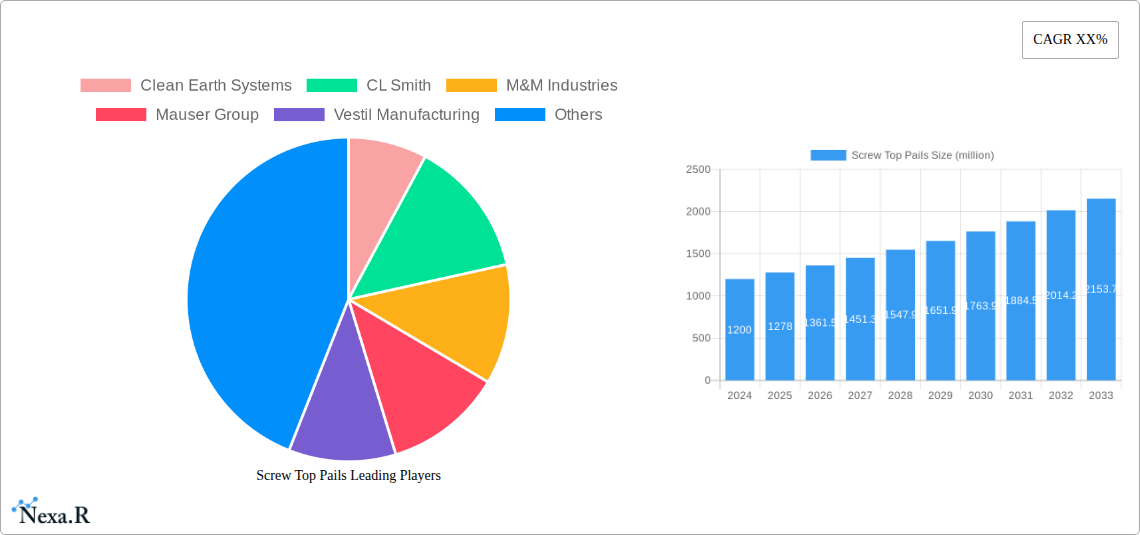
Major players in the market, including Clean Earth Systems, CL Smith, M&M Industries, Mauser Group, Vestil Manufacturing, Japan Pail Corporation, and RPC Letica Corporation, are constantly innovating to enhance product features and expand their market reach. Competitive pressures are driving improvements in manufacturing efficiency, leading to cost reductions and wider accessibility. However, potential restraints include fluctuating raw material prices and the increasing adoption of alternative packaging solutions. Nevertheless, the convenience, safety, and cost-effectiveness of screw top pails are expected to sustain their market dominance in the foreseeable future. The segment analysis reveals a strong presence across various industries, with the chemical and food sectors leading the way. Regional growth is expected to be particularly strong in Asia-Pacific, driven by industrialization and increasing consumer spending.
Screw Top Pails Company Market Share
Screw Top Pails Market Report: A Comprehensive Analysis (2019-2033)
This comprehensive report provides an in-depth analysis of the global screw top pails market, encompassing market dynamics, growth trends, regional segmentation, product landscape, and key players. The study period covers 2019-2033, with 2025 as the base and estimated year. The forecast period spans 2025-2033, and the historical period covers 2019-2024. This report is essential for industry professionals, investors, and businesses seeking to understand and capitalize on the opportunities within this dynamic market. The report segments the market into various end-use industries, providing detailed insights into each segment's growth drivers and challenges. The report projects a market size of xx million units by 2033.
Screw Top Pails Market Dynamics & Structure
This section analyzes the competitive landscape, technological advancements, regulatory influences, and market trends shaping the screw top pails industry. We delve into market concentration, examining the market share held by key players like Clean Earth Systems, CL Smith, M&M Industries, Mauser Group, Vestil Manufacturing, Japan Pail Corporation, and RPC Letica Corporation. The report also explores the impact of mergers and acquisitions (M&A) activity on market consolidation and innovation.
- Market Concentration: The market exhibits a [Insert Market Concentration Level, e.g., moderately concentrated] structure, with the top 5 players holding an estimated [Insert Percentage, e.g., 60%] market share in 2025.
- Technological Innovation: Advancements in material science (e.g., lighter, stronger plastics) and manufacturing processes are driving innovation. However, barriers to entry, including high capital investment requirements and stringent quality standards, limit the pace of innovation.
- Regulatory Framework: Regulations concerning material safety and recyclability significantly influence product design and manufacturing practices. Compliance costs represent a key challenge for smaller players.
- Competitive Product Substitutes: Alternative packaging solutions, such as flexible pouches and drums, pose a competitive threat, particularly in specific applications.
- End-User Demographics: The diverse end-user base spans various industries, including chemical, food, and industrial manufacturing. Market growth is influenced by the performance of these downstream sectors.
- M&A Trends: The past five years have witnessed [Insert Number, e.g., 15] significant M&A deals, primarily driven by consolidation efforts and expansion into new geographical markets.
Screw Top Pails Growth Trends & Insights
This section leverages proprietary data to analyze the evolution of the screw top pails market size, adoption rates across various sectors, and the influence of technological disruptions. The analysis explores shifts in consumer behavior and preferences, pinpointing factors driving market growth and potential future trends. The CAGR for the forecast period is projected at [Insert Percentage, e.g., 5%], indicating steady market expansion. The market penetration rate in [Insert Region, e.g., North America] is currently estimated at [Insert Percentage, e.g., 85%], suggesting further growth opportunities in other regions.
Dominant Regions, Countries, or Segments in Screw Top Pails
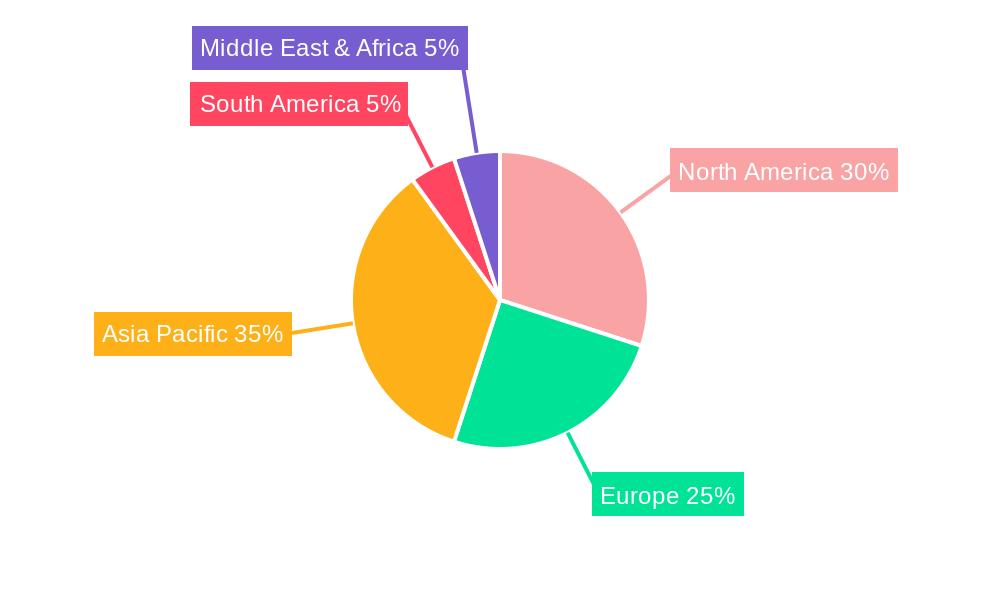
This section identifies the leading geographical regions and market segments driving market growth. We analyze factors contributing to their dominance, including economic conditions, infrastructure development, and regulatory policies. North America currently holds the largest market share, driven by strong industrial activity and established supply chains. However, Asia-Pacific is projected to witness the highest growth rate in the forecast period due to increasing industrialization and rising demand across various industries.
- North America: Strong industrial base, established infrastructure, and high consumer spending.
- Asia-Pacific: Rapid industrialization, growing demand from emerging economies (e.g., China, India).
- Europe: Mature market with focus on sustainability and environmental regulations.
Screw Top Pails Product Landscape
Screw top pails are available in various sizes, materials (e.g., plastic, metal), and designs, catering to diverse needs. Recent innovations include lightweight materials, improved seals for enhanced leak-proof performance, and tamper-evident closures. These improvements address customer demands for superior product protection, transportation efficiency, and environmental responsibility. Furthermore, customized printing and labeling options cater to brand building and product identification needs.
Key Drivers, Barriers & Challenges in Screw Top Pails
Key Drivers:
- Increasing demand from various industries (e.g., chemicals, food, pharmaceuticals).
- Growing focus on product safety and leak-proof packaging.
- Rising awareness of environmental concerns and sustainable packaging.
Challenges & Restraints:
- Fluctuations in raw material prices.
- Stringent regulatory compliance requirements.
- Intense competition from alternative packaging solutions. This competition leads to price pressure, impacting overall profitability.
Emerging Opportunities in Screw Top Pails
Emerging opportunities lie in specialized applications such as food-grade pails for the ready-to-eat food industry, customized pails with enhanced functionalities (e.g., integrated dispensing mechanisms), and sustainable and biodegradable pails made from recycled materials. Further expansion into developing economies with increasing industrialization offers significant potential.
Growth Accelerators in the Screw Top Pails Industry
Technological advancements in material science leading to lighter, stronger, and more sustainable pails are significant growth catalysts. Strategic partnerships between pail manufacturers and end-users for customized packaging solutions further boost market growth. Expanding into untapped markets and offering value-added services, such as packaging design and logistics, will also fuel market expansion.
Key Players Shaping the Screw Top Pails Market
- Clean Earth Systems
- CL Smith
- M&M Industries
- Mauser Group
- Vestil Manufacturing
- Japan Pail Corporation
- RPC Letica Corporation
Notable Milestones in Screw Top Pails Sector
- 2021 Q3: Mauser Group launched a new line of sustainable screw top pails made from recycled materials.
- 2022 Q1: Clean Earth Systems acquired a smaller competitor, expanding its market share.
- 2023 Q2: New regulations on plastic packaging came into effect in [Insert Region, e.g., Europe], impacting material choices for pail manufacturers.
In-Depth Screw Top Pails Market Outlook
The screw top pails market is poised for continued growth, driven by technological innovations, increasing demand from diverse industries, and a greater focus on sustainability. Strategic partnerships, market expansion into new geographic regions, and development of innovative packaging solutions will further fuel market expansion throughout the forecast period. The market is anticipated to witness a considerable expansion, providing significant opportunities for industry players to capitalize on this growing demand.
Screw Top Pails Segmentation
-
1. Application
- 1.1. Food & Beverage
- 1.2. Pharmaceutical
- 1.3. Chemical & Fertilizer
- 1.4. Others
-
2. Types
- 2.1. 0 Gallon to 1 Gallon
- 2.2. 1.1 Gallon to 2.5 Gallon
- 2.3. 2.51 Gallon to 5 Gallon
- 2.4. Above 5 Gallon
Screw Top Pails Segmentation By Geography
-
1. North America
- 1.1. United States
- 1.2. Canada
- 1.3. Mexico
-
2. South America
- 2.1. Brazil
- 2.2. Argentina
- 2.3. Rest of South America
-
3. Europe
- 3.1. United Kingdom
- 3.2. Germany
- 3.3. France
- 3.4. Italy
- 3.5. Spain
- 3.6. Russia
- 3.7. Benelux
- 3.8. Nordics
- 3.9. Rest of Europe
-
4. Middle East & Africa
- 4.1. Turkey
- 4.2. Israel
- 4.3. GCC
- 4.4. North Africa
- 4.5. South Africa
- 4.6. Rest of Middle East & Africa
-
5. Asia Pacific
- 5.1. China
- 5.2. India
- 5.3. Japan
- 5.4. South Korea
- 5.5. ASEAN
- 5.6. Oceania
- 5.7. Rest of Asia Pacific
Screw Top Pails Regional Market Share
Geographic Coverage of Screw Top Pails
Screw Top Pails REPORT HIGHLIGHTS
| Aspects | Details |
|---|---|
| Study Period | 2020-2034 |
| Base Year | 2025 |
| Estimated Year | 2026 |
| Forecast Period | 2026-2034 |
| Historical Period | 2020-2025 |
| Growth Rate | CAGR of 5% from 2020-2034 |
| Segmentation |
|
Table of Contents
- 1. Introduction
- 1.1. Research Scope
- 1.2. Market Segmentation
- 1.3. Research Methodology
- 1.4. Definitions and Assumptions
- 2. Executive Summary
- 2.1. Introduction
- 3. Market Dynamics
- 3.1. Introduction
- 3.2. Market Drivers
- 3.3. Market Restrains
- 3.4. Market Trends
- 4. Market Factor Analysis
- 4.1. Porters Five Forces
- 4.2. Supply/Value Chain
- 4.3. PESTEL analysis
- 4.4. Market Entropy
- 4.5. Patent/Trademark Analysis
- 5. Global Screw Top Pails Analysis, Insights and Forecast, 2020-2032
- 5.1. Market Analysis, Insights and Forecast - by Application
- 5.1.1. Food & Beverage
- 5.1.2. Pharmaceutical
- 5.1.3. Chemical & Fertilizer
- 5.1.4. Others
- 5.2. Market Analysis, Insights and Forecast - by Types
- 5.2.1. 0 Gallon to 1 Gallon
- 5.2.2. 1.1 Gallon to 2.5 Gallon
- 5.2.3. 2.51 Gallon to 5 Gallon
- 5.2.4. Above 5 Gallon
- 5.3. Market Analysis, Insights and Forecast - by Region
- 5.3.1. North America
- 5.3.2. South America
- 5.3.3. Europe
- 5.3.4. Middle East & Africa
- 5.3.5. Asia Pacific
- 5.1. Market Analysis, Insights and Forecast - by Application
- 6. North America Screw Top Pails Analysis, Insights and Forecast, 2020-2032
- 6.1. Market Analysis, Insights and Forecast - by Application
- 6.1.1. Food & Beverage
- 6.1.2. Pharmaceutical
- 6.1.3. Chemical & Fertilizer
- 6.1.4. Others
- 6.2. Market Analysis, Insights and Forecast - by Types
- 6.2.1. 0 Gallon to 1 Gallon
- 6.2.2. 1.1 Gallon to 2.5 Gallon
- 6.2.3. 2.51 Gallon to 5 Gallon
- 6.2.4. Above 5 Gallon
- 6.1. Market Analysis, Insights and Forecast - by Application
- 7. South America Screw Top Pails Analysis, Insights and Forecast, 2020-2032
- 7.1. Market Analysis, Insights and Forecast - by Application
- 7.1.1. Food & Beverage
- 7.1.2. Pharmaceutical
- 7.1.3. Chemical & Fertilizer
- 7.1.4. Others
- 7.2. Market Analysis, Insights and Forecast - by Types
- 7.2.1. 0 Gallon to 1 Gallon
- 7.2.2. 1.1 Gallon to 2.5 Gallon
- 7.2.3. 2.51 Gallon to 5 Gallon
- 7.2.4. Above 5 Gallon
- 7.1. Market Analysis, Insights and Forecast - by Application
- 8. Europe Screw Top Pails Analysis, Insights and Forecast, 2020-2032
- 8.1. Market Analysis, Insights and Forecast - by Application
- 8.1.1. Food & Beverage
- 8.1.2. Pharmaceutical
- 8.1.3. Chemical & Fertilizer
- 8.1.4. Others
- 8.2. Market Analysis, Insights and Forecast - by Types
- 8.2.1. 0 Gallon to 1 Gallon
- 8.2.2. 1.1 Gallon to 2.5 Gallon
- 8.2.3. 2.51 Gallon to 5 Gallon
- 8.2.4. Above 5 Gallon
- 8.1. Market Analysis, Insights and Forecast - by Application
- 9. Middle East & Africa Screw Top Pails Analysis, Insights and Forecast, 2020-2032
- 9.1. Market Analysis, Insights and Forecast - by Application
- 9.1.1. Food & Beverage
- 9.1.2. Pharmaceutical
- 9.1.3. Chemical & Fertilizer
- 9.1.4. Others
- 9.2. Market Analysis, Insights and Forecast - by Types
- 9.2.1. 0 Gallon to 1 Gallon
- 9.2.2. 1.1 Gallon to 2.5 Gallon
- 9.2.3. 2.51 Gallon to 5 Gallon
- 9.2.4. Above 5 Gallon
- 9.1. Market Analysis, Insights and Forecast - by Application
- 10. Asia Pacific Screw Top Pails Analysis, Insights and Forecast, 2020-2032
- 10.1. Market Analysis, Insights and Forecast - by Application
- 10.1.1. Food & Beverage
- 10.1.2. Pharmaceutical
- 10.1.3. Chemical & Fertilizer
- 10.1.4. Others
- 10.2. Market Analysis, Insights and Forecast - by Types
- 10.2.1. 0 Gallon to 1 Gallon
- 10.2.2. 1.1 Gallon to 2.5 Gallon
- 10.2.3. 2.51 Gallon to 5 Gallon
- 10.2.4. Above 5 Gallon
- 10.1. Market Analysis, Insights and Forecast - by Application
- 11. Competitive Analysis
- 11.1. Global Market Share Analysis 2025
- 11.2. Company Profiles
- 11.2.1 Clean Earth Systems
- 11.2.1.1. Overview
- 11.2.1.2. Products
- 11.2.1.3. SWOT Analysis
- 11.2.1.4. Recent Developments
- 11.2.1.5. Financials (Based on Availability)
- 11.2.2 CL Smith
- 11.2.2.1. Overview
- 11.2.2.2. Products
- 11.2.2.3. SWOT Analysis
- 11.2.2.4. Recent Developments
- 11.2.2.5. Financials (Based on Availability)
- 11.2.3 M&M Industries
- 11.2.3.1. Overview
- 11.2.3.2. Products
- 11.2.3.3. SWOT Analysis
- 11.2.3.4. Recent Developments
- 11.2.3.5. Financials (Based on Availability)
- 11.2.4 Mauser Group
- 11.2.4.1. Overview
- 11.2.4.2. Products
- 11.2.4.3. SWOT Analysis
- 11.2.4.4. Recent Developments
- 11.2.4.5. Financials (Based on Availability)
- 11.2.5 Vestil Manufacturing
- 11.2.5.1. Overview
- 11.2.5.2. Products
- 11.2.5.3. SWOT Analysis
- 11.2.5.4. Recent Developments
- 11.2.5.5. Financials (Based on Availability)
- 11.2.6 Japan Pail Corporation
- 11.2.6.1. Overview
- 11.2.6.2. Products
- 11.2.6.3. SWOT Analysis
- 11.2.6.4. Recent Developments
- 11.2.6.5. Financials (Based on Availability)
- 11.2.7 RPC Letica Corporation
- 11.2.7.1. Overview
- 11.2.7.2. Products
- 11.2.7.3. SWOT Analysis
- 11.2.7.4. Recent Developments
- 11.2.7.5. Financials (Based on Availability)
- 11.2.1 Clean Earth Systems
List of Figures
- Figure 1: Global Screw Top Pails Revenue Breakdown (undefined, %) by Region 2025 & 2033
- Figure 2: North America Screw Top Pails Revenue (undefined), by Application 2025 & 2033
- Figure 3: North America Screw Top Pails Revenue Share (%), by Application 2025 & 2033
- Figure 4: North America Screw Top Pails Revenue (undefined), by Types 2025 & 2033
- Figure 5: North America Screw Top Pails Revenue Share (%), by Types 2025 & 2033
- Figure 6: North America Screw Top Pails Revenue (undefined), by Country 2025 & 2033
- Figure 7: North America Screw Top Pails Revenue Share (%), by Country 2025 & 2033
- Figure 8: South America Screw Top Pails Revenue (undefined), by Application 2025 & 2033
- Figure 9: South America Screw Top Pails Revenue Share (%), by Application 2025 & 2033
- Figure 10: South America Screw Top Pails Revenue (undefined), by Types 2025 & 2033
- Figure 11: South America Screw Top Pails Revenue Share (%), by Types 2025 & 2033
- Figure 12: South America Screw Top Pails Revenue (undefined), by Country 2025 & 2033
- Figure 13: South America Screw Top Pails Revenue Share (%), by Country 2025 & 2033
- Figure 14: Europe Screw Top Pails Revenue (undefined), by Application 2025 & 2033
- Figure 15: Europe Screw Top Pails Revenue Share (%), by Application 2025 & 2033
- Figure 16: Europe Screw Top Pails Revenue (undefined), by Types 2025 & 2033
- Figure 17: Europe Screw Top Pails Revenue Share (%), by Types 2025 & 2033
- Figure 18: Europe Screw Top Pails Revenue (undefined), by Country 2025 & 2033
- Figure 19: Europe Screw Top Pails Revenue Share (%), by Country 2025 & 2033
- Figure 20: Middle East & Africa Screw Top Pails Revenue (undefined), by Application 2025 & 2033
- Figure 21: Middle East & Africa Screw Top Pails Revenue Share (%), by Application 2025 & 2033
- Figure 22: Middle East & Africa Screw Top Pails Revenue (undefined), by Types 2025 & 2033
- Figure 23: Middle East & Africa Screw Top Pails Revenue Share (%), by Types 2025 & 2033
- Figure 24: Middle East & Africa Screw Top Pails Revenue (undefined), by Country 2025 & 2033
- Figure 25: Middle East & Africa Screw Top Pails Revenue Share (%), by Country 2025 & 2033
- Figure 26: Asia Pacific Screw Top Pails Revenue (undefined), by Application 2025 & 2033
- Figure 27: Asia Pacific Screw Top Pails Revenue Share (%), by Application 2025 & 2033
- Figure 28: Asia Pacific Screw Top Pails Revenue (undefined), by Types 2025 & 2033
- Figure 29: Asia Pacific Screw Top Pails Revenue Share (%), by Types 2025 & 2033
- Figure 30: Asia Pacific Screw Top Pails Revenue (undefined), by Country 2025 & 2033
- Figure 31: Asia Pacific Screw Top Pails Revenue Share (%), by Country 2025 & 2033
List of Tables
- Table 1: Global Screw Top Pails Revenue undefined Forecast, by Application 2020 & 2033
- Table 2: Global Screw Top Pails Revenue undefined Forecast, by Types 2020 & 2033
- Table 3: Global Screw Top Pails Revenue undefined Forecast, by Region 2020 & 2033
- Table 4: Global Screw Top Pails Revenue undefined Forecast, by Application 2020 & 2033
- Table 5: Global Screw Top Pails Revenue undefined Forecast, by Types 2020 & 2033
- Table 6: Global Screw Top Pails Revenue undefined Forecast, by Country 2020 & 2033
- Table 7: United States Screw Top Pails Revenue (undefined) Forecast, by Application 2020 & 2033
- Table 8: Canada Screw Top Pails Revenue (undefined) Forecast, by Application 2020 & 2033
- Table 9: Mexico Screw Top Pails Revenue (undefined) Forecast, by Application 2020 & 2033
- Table 10: Global Screw Top Pails Revenue undefined Forecast, by Application 2020 & 2033
- Table 11: Global Screw Top Pails Revenue undefined Forecast, by Types 2020 & 2033
- Table 12: Global Screw Top Pails Revenue undefined Forecast, by Country 2020 & 2033
- Table 13: Brazil Screw Top Pails Revenue (undefined) Forecast, by Application 2020 & 2033
- Table 14: Argentina Screw Top Pails Revenue (undefined) Forecast, by Application 2020 & 2033
- Table 15: Rest of South America Screw Top Pails Revenue (undefined) Forecast, by Application 2020 & 2033
- Table 16: Global Screw Top Pails Revenue undefined Forecast, by Application 2020 & 2033
- Table 17: Global Screw Top Pails Revenue undefined Forecast, by Types 2020 & 2033
- Table 18: Global Screw Top Pails Revenue undefined Forecast, by Country 2020 & 2033
- Table 19: United Kingdom Screw Top Pails Revenue (undefined) Forecast, by Application 2020 & 2033
- Table 20: Germany Screw Top Pails Revenue (undefined) Forecast, by Application 2020 & 2033
- Table 21: France Screw Top Pails Revenue (undefined) Forecast, by Application 2020 & 2033
- Table 22: Italy Screw Top Pails Revenue (undefined) Forecast, by Application 2020 & 2033
- Table 23: Spain Screw Top Pails Revenue (undefined) Forecast, by Application 2020 & 2033
- Table 24: Russia Screw Top Pails Revenue (undefined) Forecast, by Application 2020 & 2033
- Table 25: Benelux Screw Top Pails Revenue (undefined) Forecast, by Application 2020 & 2033
- Table 26: Nordics Screw Top Pails Revenue (undefined) Forecast, by Application 2020 & 2033
- Table 27: Rest of Europe Screw Top Pails Revenue (undefined) Forecast, by Application 2020 & 2033
- Table 28: Global Screw Top Pails Revenue undefined Forecast, by Application 2020 & 2033
- Table 29: Global Screw Top Pails Revenue undefined Forecast, by Types 2020 & 2033
- Table 30: Global Screw Top Pails Revenue undefined Forecast, by Country 2020 & 2033
- Table 31: Turkey Screw Top Pails Revenue (undefined) Forecast, by Application 2020 & 2033
- Table 32: Israel Screw Top Pails Revenue (undefined) Forecast, by Application 2020 & 2033
- Table 33: GCC Screw Top Pails Revenue (undefined) Forecast, by Application 2020 & 2033
- Table 34: North Africa Screw Top Pails Revenue (undefined) Forecast, by Application 2020 & 2033
- Table 35: South Africa Screw Top Pails Revenue (undefined) Forecast, by Application 2020 & 2033
- Table 36: Rest of Middle East & Africa Screw Top Pails Revenue (undefined) Forecast, by Application 2020 & 2033
- Table 37: Global Screw Top Pails Revenue undefined Forecast, by Application 2020 & 2033
- Table 38: Global Screw Top Pails Revenue undefined Forecast, by Types 2020 & 2033
- Table 39: Global Screw Top Pails Revenue undefined Forecast, by Country 2020 & 2033
- Table 40: China Screw Top Pails Revenue (undefined) Forecast, by Application 2020 & 2033
- Table 41: India Screw Top Pails Revenue (undefined) Forecast, by Application 2020 & 2033
- Table 42: Japan Screw Top Pails Revenue (undefined) Forecast, by Application 2020 & 2033
- Table 43: South Korea Screw Top Pails Revenue (undefined) Forecast, by Application 2020 & 2033
- Table 44: ASEAN Screw Top Pails Revenue (undefined) Forecast, by Application 2020 & 2033
- Table 45: Oceania Screw Top Pails Revenue (undefined) Forecast, by Application 2020 & 2033
- Table 46: Rest of Asia Pacific Screw Top Pails Revenue (undefined) Forecast, by Application 2020 & 2033
Frequently Asked Questions
1. What is the projected Compound Annual Growth Rate (CAGR) of the Screw Top Pails?
The projected CAGR is approximately 5%.
2. Which companies are prominent players in the Screw Top Pails?
Key companies in the market include Clean Earth Systems, CL Smith, M&M Industries, Mauser Group, Vestil Manufacturing, Japan Pail Corporation, RPC Letica Corporation.
3. What are the main segments of the Screw Top Pails?
The market segments include Application, Types.
4. Can you provide details about the market size?
The market size is estimated to be USD XXX N/A as of 2022.
5. What are some drivers contributing to market growth?
N/A
6. What are the notable trends driving market growth?
N/A
7. Are there any restraints impacting market growth?
N/A
8. Can you provide examples of recent developments in the market?
N/A
9. What pricing options are available for accessing the report?
Pricing options include single-user, multi-user, and enterprise licenses priced at USD 4900.00, USD 7350.00, and USD 9800.00 respectively.
10. Is the market size provided in terms of value or volume?
The market size is provided in terms of value, measured in N/A.
11. Are there any specific market keywords associated with the report?
Yes, the market keyword associated with the report is "Screw Top Pails," which aids in identifying and referencing the specific market segment covered.
12. How do I determine which pricing option suits my needs best?
The pricing options vary based on user requirements and access needs. Individual users may opt for single-user licenses, while businesses requiring broader access may choose multi-user or enterprise licenses for cost-effective access to the report.
13. Are there any additional resources or data provided in the Screw Top Pails report?
While the report offers comprehensive insights, it's advisable to review the specific contents or supplementary materials provided to ascertain if additional resources or data are available.
14. How can I stay updated on further developments or reports in the Screw Top Pails?
To stay informed about further developments, trends, and reports in the Screw Top Pails, consider subscribing to industry newsletters, following relevant companies and organizations, or regularly checking reputable industry news sources and publications.
Methodology
Step 1 - Identification of Relevant Samples Size from Population Database


Step 2 - Approaches for Defining Global Market Size (Value, Volume* & Price*)

Note*: In applicable scenarios
Step 3 - Data Sources
Primary Research
- Web Analytics
- Survey Reports
- Research Institute
- Latest Research Reports
- Opinion Leaders
Secondary Research
- Annual Reports
- White Paper
- Latest Press Release
- Industry Association
- Paid Database
- Investor Presentations

Step 4 - Data Triangulation
Involves using different sources of information in order to increase the validity of a study
These sources are likely to be stakeholders in a program - participants, other researchers, program staff, other community members, and so on.
Then we put all data in single framework & apply various statistical tools to find out the dynamic on the market.
During the analysis stage, feedback from the stakeholder groups would be compared to determine areas of agreement as well as areas of divergence