

Key Insights
The global shipping temperature indicator market is experiencing robust growth, driven by the increasing need for efficient cold chain management across various industries, including pharmaceuticals, food and beverage, and healthcare. The market's expansion is fueled by stringent regulatory compliance requirements regarding temperature-sensitive goods, the rising demand for real-time temperature monitoring, and the growing adoption of advanced technologies like IoT-enabled sensors and data analytics. This allows businesses to better track shipments, prevent spoilage, and minimize losses associated with temperature excursions. While factors such as the initial investment cost of implementing temperature monitoring systems and the potential for data security breaches pose challenges, ongoing technological advancements and increasing awareness of the benefits of proactive temperature control are mitigating these restraints. The market is segmented by various indicator types (e.g., time-temperature indicators, electronic data loggers), application areas, and geographical regions, with North America and Europe currently holding significant market share. However, emerging economies in Asia-Pacific and Latin America are exhibiting high growth potential, driven by increasing infrastructure development and rising disposable incomes.
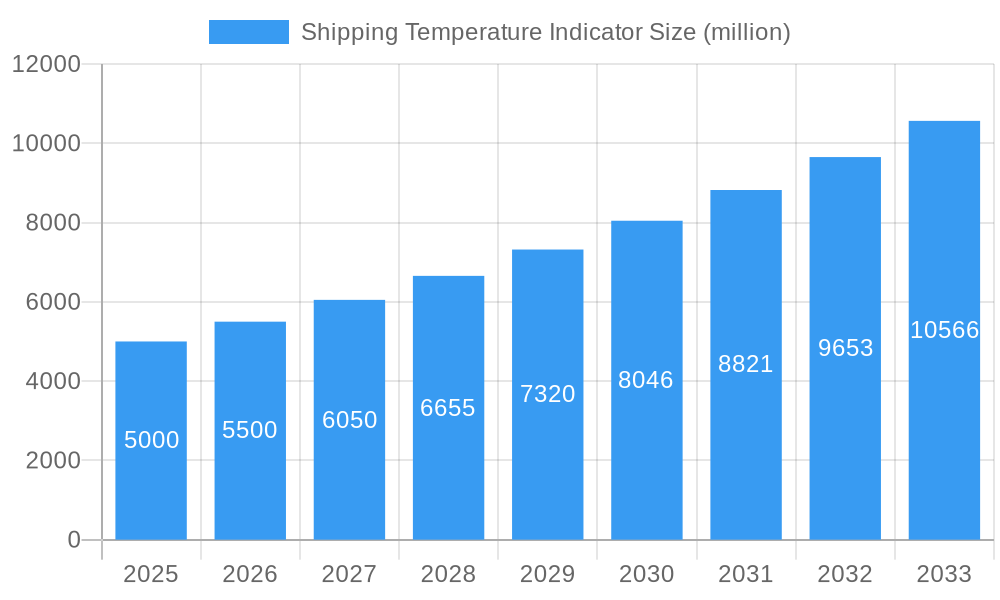
Shipping Temperature Indicator Market Size (In Billion)
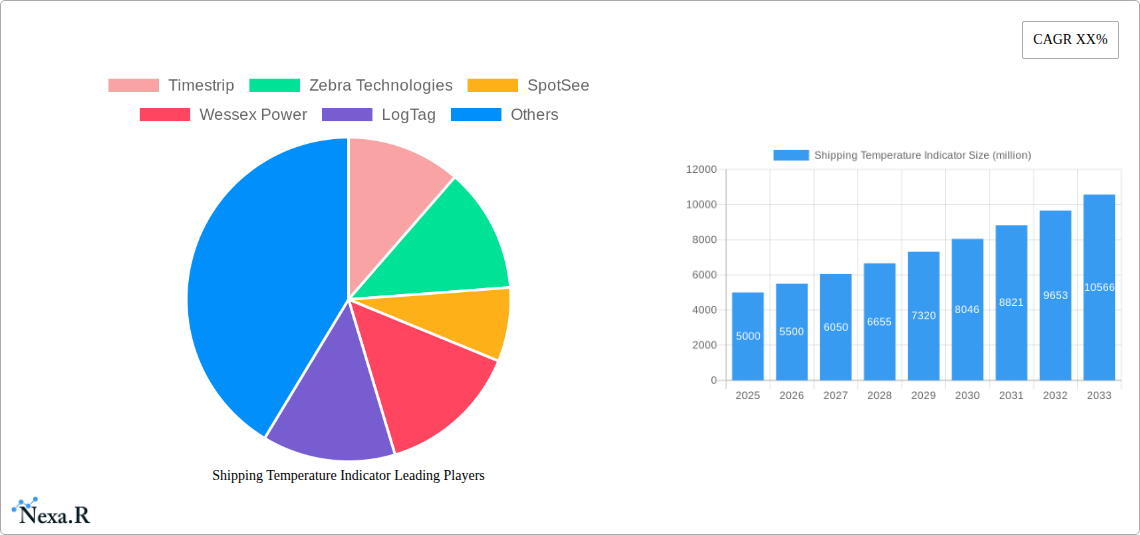
The competitive landscape is characterized by a mix of established players and emerging companies offering a wide range of solutions. Key players like Timestrip, Zebra Technologies, and others are focusing on product innovation and strategic partnerships to expand their market presence. The market is witnessing a shift towards more sophisticated and integrated solutions, integrating temperature monitoring with other aspects of supply chain management, such as GPS tracking and predictive analytics. This trend is expected to drive market growth in the coming years. Further consolidation and strategic alliances among companies are also anticipated, leading to a more concentrated market structure. The forecast period (2025-2033) is projected to show substantial growth, driven by the factors mentioned above and a continued focus on ensuring the integrity and safety of temperature-sensitive goods during transport.
Shipping Temperature Indicator Company Market Share
Shipping Temperature Indicator Market Report: 2019-2033
This comprehensive report provides an in-depth analysis of the global shipping temperature indicator market, encompassing market dynamics, growth trends, regional analysis, product landscape, key players, and future outlook. The study period spans from 2019 to 2033, with 2025 serving as the base and estimated year. The forecast period covers 2025-2033, while the historical period encompasses 2019-2024. The report quantifies the market in million units.
Shipping Temperature Indicator Market Dynamics & Structure
The global shipping temperature indicator market, valued at xx million units in 2025, is characterized by a moderately fragmented landscape. Key players such as Timestrip, Zebra Technologies, SpotSee, Wessex Power, LogTag, Tempmate, Varcode, JUMO, DeltaTrak, Siltech, Berlinger, Temperature Indicators, Evigence, Vitsab International, OMEGA, Brady, Cole-Parmer Instrument, and Eltronis compete based on product features, accuracy, reliability, and pricing. Technological innovation, particularly in data logging and wireless communication capabilities, is a major driver. Stringent regulatory frameworks governing the transportation of temperature-sensitive goods, especially in the pharmaceutical and food industries, are further fueling market growth. The increasing demand for real-time temperature monitoring and improved supply chain visibility is driving adoption. Competitive substitutes include traditional methods like manual temperature checks, but these lack the accuracy and traceability offered by temperature indicators. The market is experiencing consolidation through mergers and acquisitions (M&A), with xx M&A deals observed between 2019 and 2024.
- Market Concentration: Moderately fragmented, with top 5 players holding approximately xx% market share in 2025.
- Technological Innovation: Focus on IoT integration, improved accuracy, and data analytics capabilities.
- Regulatory Frameworks: Stringent regulations in pharmaceutical and food sectors driving adoption.
- Competitive Substitutes: Limited, with traditional methods offering less accuracy and traceability.
- End-User Demographics: Primarily pharmaceutical, food & beverage, healthcare, and logistics industries.
- M&A Trends: xx M&A deals between 2019-2024, indicating consolidation.
Shipping Temperature Indicator Growth Trends & Insights
The shipping temperature indicator market exhibits strong growth, driven by increasing demand for secure cold chain logistics and stringent regulations. The market experienced a CAGR of xx% during the historical period (2019-2024) and is projected to maintain a CAGR of xx% during the forecast period (2025-2033), reaching xx million units by 2033. This growth is attributed to factors like increasing e-commerce, rising awareness of cold chain importance, and technological advancements. Market penetration is currently at xx% and is expected to increase significantly in developing economies with growing healthcare and food processing sectors. Technological disruptions, such as the integration of IoT and blockchain technology, are further accelerating market adoption. Consumer behavior shifts towards greater demand for product traceability and quality assurance are also driving demand.
Dominant Regions, Countries, or Segments in Shipping Temperature Indicator
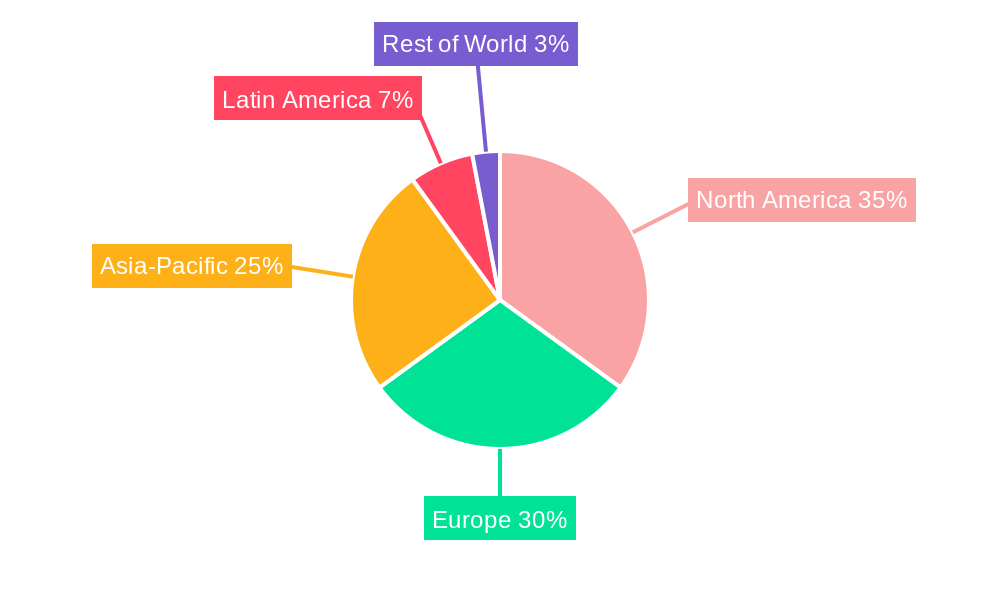
North America currently dominates the shipping temperature indicator market, holding the largest market share of xx% in 2025. This dominance is largely due to the strong presence of major market players, robust regulatory frameworks, and a well-established cold chain infrastructure. Europe and Asia Pacific are also significant markets, exhibiting substantial growth potential. Key drivers in North America include stringent regulatory compliance requirements, high adoption rates in the pharmaceutical and healthcare industries, and the advanced logistics infrastructure. In Europe, factors like rising consumer awareness and government initiatives promoting cold chain efficiency contribute to market growth. Asia Pacific shows significant growth potential driven by rapid economic development, expanding e-commerce sector, and improvements in cold chain infrastructure.
- North America: High market share (xx%), driven by strong regulations, advanced infrastructure, and established players.
- Europe: Significant growth potential, fueled by increasing consumer awareness and government initiatives.
- Asia Pacific: Fastest-growing region, driven by economic growth, expanding e-commerce, and infrastructure improvements.
Shipping Temperature Indicator Product Landscape
The market offers a diverse range of products, from simple, single-use indicators to sophisticated data loggers with wireless communication capabilities. Product innovations focus on improving accuracy, reliability, and ease of use. Key performance metrics include temperature range, accuracy, data storage capacity, and communication capabilities. Many indicators now integrate with cloud-based platforms for real-time monitoring and data analysis. Unique selling propositions include features like tamper-evidence, extended shelf life, and advanced reporting functionalities.
Key Drivers, Barriers & Challenges in Shipping Temperature Indicator
Key Drivers: Increasing demand for temperature-sensitive goods, stringent regulatory compliance requirements for cold chain logistics, and technological advancements leading to more accurate and reliable indicators are major drivers. Growing e-commerce further fuels demand for reliable temperature monitoring.
Key Challenges: High initial investment costs for sophisticated data loggers can be a barrier for small businesses. Integration with existing supply chain management systems can also be challenging. Competition from low-cost manufacturers in emerging markets represents a significant pressure. Supply chain disruptions and the impact of geopolitical events on manufacturing and distribution can impact the availability of products.
Emerging Opportunities in Shipping Temperature Indicator
Untapped markets in developing countries with growing healthcare and food & beverage sectors present significant opportunities. Integration of blockchain technology offers enhanced security and traceability, improving supply chain transparency and reducing counterfeiting. The development of more sustainable and eco-friendly indicators could further enhance market appeal.
Growth Accelerators in the Shipping Temperature Indicator Industry
Technological advancements like IoT integration, AI-powered predictive analytics, and improved data visualization tools are major growth catalysts. Strategic partnerships between technology providers and logistics companies enhance market reach and adoption. Expanding into emerging markets, focusing on developing cost-effective and user-friendly indicators, and developing specialized indicators for niche applications are key strategies for market expansion.
Key Players Shaping the Shipping Temperature Indicator Market
- Timestrip
- Zebra Technologies
- SpotSee
- Wessex Power
- LogTag
- Tempmate
- Varcode
- JUMO
- DeltaTrak
- Siltech
- Berlinger
- Temperature Indicators
- Evigence
- Vitsab International
- OMEGA
- Brady
- Cole-Parmer Instrument
- Eltronis
Notable Milestones in Shipping Temperature Indicator Sector
- 2020: Introduction of xx new temperature indicator models with enhanced accuracy and data logging capabilities by leading manufacturers.
- 2022: Partnership between xx major logistics provider and a technology firm for integrated cold chain monitoring using IoT-enabled indicators.
- 2023: Successful completion of xx M&A transactions, leading to increased market consolidation.
- 2024: Launch of a new generation of sustainable, biodegradable shipping temperature indicators by xx company.
In-Depth Shipping Temperature Indicator Market Outlook
The shipping temperature indicator market is poised for continued strong growth, driven by technological advancements, increased regulatory scrutiny, and the expansion of e-commerce. Opportunities exist in emerging markets, sustainable product development, and integration with advanced supply chain technologies. Strategic partnerships and investments in R&D will be crucial for maintaining a competitive edge and capitalizing on the long-term growth potential of this sector.
Shipping Temperature Indicator Segmentation
-
1. Application
- 1.1. Pharmaceuticals
- 1.2. Food and Beverage
- 1.3. Manufacturing
- 1.4. Others
-
2. Types
- 2.1. Indicator Labels
- 2.2. Electronic Temperature Indicators
Shipping Temperature Indicator Segmentation By Geography
-
1. North America
- 1.1. United States
- 1.2. Canada
- 1.3. Mexico
-
2. South America
- 2.1. Brazil
- 2.2. Argentina
- 2.3. Rest of South America
-
3. Europe
- 3.1. United Kingdom
- 3.2. Germany
- 3.3. France
- 3.4. Italy
- 3.5. Spain
- 3.6. Russia
- 3.7. Benelux
- 3.8. Nordics
- 3.9. Rest of Europe
-
4. Middle East & Africa
- 4.1. Turkey
- 4.2. Israel
- 4.3. GCC
- 4.4. North Africa
- 4.5. South Africa
- 4.6. Rest of Middle East & Africa
-
5. Asia Pacific
- 5.1. China
- 5.2. India
- 5.3. Japan
- 5.4. South Korea
- 5.5. ASEAN
- 5.6. Oceania
- 5.7. Rest of Asia Pacific
Shipping Temperature Indicator Regional Market Share
Geographic Coverage of Shipping Temperature Indicator
Shipping Temperature Indicator REPORT HIGHLIGHTS
| Aspects | Details |
|---|---|
| Study Period | 2020-2034 |
| Base Year | 2025 |
| Estimated Year | 2026 |
| Forecast Period | 2026-2034 |
| Historical Period | 2020-2025 |
| Growth Rate | CAGR of XX% from 2020-2034 |
| Segmentation |
|
Table of Contents
- 1. Introduction
- 1.1. Research Scope
- 1.2. Market Segmentation
- 1.3. Research Methodology
- 1.4. Definitions and Assumptions
- 2. Executive Summary
- 2.1. Introduction
- 3. Market Dynamics
- 3.1. Introduction
- 3.2. Market Drivers
- 3.3. Market Restrains
- 3.4. Market Trends
- 4. Market Factor Analysis
- 4.1. Porters Five Forces
- 4.2. Supply/Value Chain
- 4.3. PESTEL analysis
- 4.4. Market Entropy
- 4.5. Patent/Trademark Analysis
- 5. Global Shipping Temperature Indicator Analysis, Insights and Forecast, 2020-2032
- 5.1. Market Analysis, Insights and Forecast - by Application
- 5.1.1. Pharmaceuticals
- 5.1.2. Food and Beverage
- 5.1.3. Manufacturing
- 5.1.4. Others
- 5.2. Market Analysis, Insights and Forecast - by Types
- 5.2.1. Indicator Labels
- 5.2.2. Electronic Temperature Indicators
- 5.3. Market Analysis, Insights and Forecast - by Region
- 5.3.1. North America
- 5.3.2. South America
- 5.3.3. Europe
- 5.3.4. Middle East & Africa
- 5.3.5. Asia Pacific
- 5.1. Market Analysis, Insights and Forecast - by Application
- 6. North America Shipping Temperature Indicator Analysis, Insights and Forecast, 2020-2032
- 6.1. Market Analysis, Insights and Forecast - by Application
- 6.1.1. Pharmaceuticals
- 6.1.2. Food and Beverage
- 6.1.3. Manufacturing
- 6.1.4. Others
- 6.2. Market Analysis, Insights and Forecast - by Types
- 6.2.1. Indicator Labels
- 6.2.2. Electronic Temperature Indicators
- 6.1. Market Analysis, Insights and Forecast - by Application
- 7. South America Shipping Temperature Indicator Analysis, Insights and Forecast, 2020-2032
- 7.1. Market Analysis, Insights and Forecast - by Application
- 7.1.1. Pharmaceuticals
- 7.1.2. Food and Beverage
- 7.1.3. Manufacturing
- 7.1.4. Others
- 7.2. Market Analysis, Insights and Forecast - by Types
- 7.2.1. Indicator Labels
- 7.2.2. Electronic Temperature Indicators
- 7.1. Market Analysis, Insights and Forecast - by Application
- 8. Europe Shipping Temperature Indicator Analysis, Insights and Forecast, 2020-2032
- 8.1. Market Analysis, Insights and Forecast - by Application
- 8.1.1. Pharmaceuticals
- 8.1.2. Food and Beverage
- 8.1.3. Manufacturing
- 8.1.4. Others
- 8.2. Market Analysis, Insights and Forecast - by Types
- 8.2.1. Indicator Labels
- 8.2.2. Electronic Temperature Indicators
- 8.1. Market Analysis, Insights and Forecast - by Application
- 9. Middle East & Africa Shipping Temperature Indicator Analysis, Insights and Forecast, 2020-2032
- 9.1. Market Analysis, Insights and Forecast - by Application
- 9.1.1. Pharmaceuticals
- 9.1.2. Food and Beverage
- 9.1.3. Manufacturing
- 9.1.4. Others
- 9.2. Market Analysis, Insights and Forecast - by Types
- 9.2.1. Indicator Labels
- 9.2.2. Electronic Temperature Indicators
- 9.1. Market Analysis, Insights and Forecast - by Application
- 10. Asia Pacific Shipping Temperature Indicator Analysis, Insights and Forecast, 2020-2032
- 10.1. Market Analysis, Insights and Forecast - by Application
- 10.1.1. Pharmaceuticals
- 10.1.2. Food and Beverage
- 10.1.3. Manufacturing
- 10.1.4. Others
- 10.2. Market Analysis, Insights and Forecast - by Types
- 10.2.1. Indicator Labels
- 10.2.2. Electronic Temperature Indicators
- 10.1. Market Analysis, Insights and Forecast - by Application
- 11. Competitive Analysis
- 11.1. Global Market Share Analysis 2025
- 11.2. Company Profiles
- 11.2.1 Timestrip
- 11.2.1.1. Overview
- 11.2.1.2. Products
- 11.2.1.3. SWOT Analysis
- 11.2.1.4. Recent Developments
- 11.2.1.5. Financials (Based on Availability)
- 11.2.2 Zebra Technologies
- 11.2.2.1. Overview
- 11.2.2.2. Products
- 11.2.2.3. SWOT Analysis
- 11.2.2.4. Recent Developments
- 11.2.2.5. Financials (Based on Availability)
- 11.2.3 SpotSee
- 11.2.3.1. Overview
- 11.2.3.2. Products
- 11.2.3.3. SWOT Analysis
- 11.2.3.4. Recent Developments
- 11.2.3.5. Financials (Based on Availability)
- 11.2.4 Wessex Power
- 11.2.4.1. Overview
- 11.2.4.2. Products
- 11.2.4.3. SWOT Analysis
- 11.2.4.4. Recent Developments
- 11.2.4.5. Financials (Based on Availability)
- 11.2.5 LogTag
- 11.2.5.1. Overview
- 11.2.5.2. Products
- 11.2.5.3. SWOT Analysis
- 11.2.5.4. Recent Developments
- 11.2.5.5. Financials (Based on Availability)
- 11.2.6 Tempmate
- 11.2.6.1. Overview
- 11.2.6.2. Products
- 11.2.6.3. SWOT Analysis
- 11.2.6.4. Recent Developments
- 11.2.6.5. Financials (Based on Availability)
- 11.2.7 Varcode
- 11.2.7.1. Overview
- 11.2.7.2. Products
- 11.2.7.3. SWOT Analysis
- 11.2.7.4. Recent Developments
- 11.2.7.5. Financials (Based on Availability)
- 11.2.8 JUMO
- 11.2.8.1. Overview
- 11.2.8.2. Products
- 11.2.8.3. SWOT Analysis
- 11.2.8.4. Recent Developments
- 11.2.8.5. Financials (Based on Availability)
- 11.2.9 DeltaTrak
- 11.2.9.1. Overview
- 11.2.9.2. Products
- 11.2.9.3. SWOT Analysis
- 11.2.9.4. Recent Developments
- 11.2.9.5. Financials (Based on Availability)
- 11.2.10 Siltech
- 11.2.10.1. Overview
- 11.2.10.2. Products
- 11.2.10.3. SWOT Analysis
- 11.2.10.4. Recent Developments
- 11.2.10.5. Financials (Based on Availability)
- 11.2.11 Berlinger
- 11.2.11.1. Overview
- 11.2.11.2. Products
- 11.2.11.3. SWOT Analysis
- 11.2.11.4. Recent Developments
- 11.2.11.5. Financials (Based on Availability)
- 11.2.12 Temperature Indicators
- 11.2.12.1. Overview
- 11.2.12.2. Products
- 11.2.12.3. SWOT Analysis
- 11.2.12.4. Recent Developments
- 11.2.12.5. Financials (Based on Availability)
- 11.2.13 Evigence
- 11.2.13.1. Overview
- 11.2.13.2. Products
- 11.2.13.3. SWOT Analysis
- 11.2.13.4. Recent Developments
- 11.2.13.5. Financials (Based on Availability)
- 11.2.14 Vitsab International
- 11.2.14.1. Overview
- 11.2.14.2. Products
- 11.2.14.3. SWOT Analysis
- 11.2.14.4. Recent Developments
- 11.2.14.5. Financials (Based on Availability)
- 11.2.15 OMEGA
- 11.2.15.1. Overview
- 11.2.15.2. Products
- 11.2.15.3. SWOT Analysis
- 11.2.15.4. Recent Developments
- 11.2.15.5. Financials (Based on Availability)
- 11.2.16 Brady
- 11.2.16.1. Overview
- 11.2.16.2. Products
- 11.2.16.3. SWOT Analysis
- 11.2.16.4. Recent Developments
- 11.2.16.5. Financials (Based on Availability)
- 11.2.17 Cole-Parmer Instrument
- 11.2.17.1. Overview
- 11.2.17.2. Products
- 11.2.17.3. SWOT Analysis
- 11.2.17.4. Recent Developments
- 11.2.17.5. Financials (Based on Availability)
- 11.2.18 Eltronis
- 11.2.18.1. Overview
- 11.2.18.2. Products
- 11.2.18.3. SWOT Analysis
- 11.2.18.4. Recent Developments
- 11.2.18.5. Financials (Based on Availability)
- 11.2.1 Timestrip
List of Figures
- Figure 1: Global Shipping Temperature Indicator Revenue Breakdown (million, %) by Region 2025 & 2033
- Figure 2: Global Shipping Temperature Indicator Volume Breakdown (K, %) by Region 2025 & 2033
- Figure 3: North America Shipping Temperature Indicator Revenue (million), by Application 2025 & 2033
- Figure 4: North America Shipping Temperature Indicator Volume (K), by Application 2025 & 2033
- Figure 5: North America Shipping Temperature Indicator Revenue Share (%), by Application 2025 & 2033
- Figure 6: North America Shipping Temperature Indicator Volume Share (%), by Application 2025 & 2033
- Figure 7: North America Shipping Temperature Indicator Revenue (million), by Types 2025 & 2033
- Figure 8: North America Shipping Temperature Indicator Volume (K), by Types 2025 & 2033
- Figure 9: North America Shipping Temperature Indicator Revenue Share (%), by Types 2025 & 2033
- Figure 10: North America Shipping Temperature Indicator Volume Share (%), by Types 2025 & 2033
- Figure 11: North America Shipping Temperature Indicator Revenue (million), by Country 2025 & 2033
- Figure 12: North America Shipping Temperature Indicator Volume (K), by Country 2025 & 2033
- Figure 13: North America Shipping Temperature Indicator Revenue Share (%), by Country 2025 & 2033
- Figure 14: North America Shipping Temperature Indicator Volume Share (%), by Country 2025 & 2033
- Figure 15: South America Shipping Temperature Indicator Revenue (million), by Application 2025 & 2033
- Figure 16: South America Shipping Temperature Indicator Volume (K), by Application 2025 & 2033
- Figure 17: South America Shipping Temperature Indicator Revenue Share (%), by Application 2025 & 2033
- Figure 18: South America Shipping Temperature Indicator Volume Share (%), by Application 2025 & 2033
- Figure 19: South America Shipping Temperature Indicator Revenue (million), by Types 2025 & 2033
- Figure 20: South America Shipping Temperature Indicator Volume (K), by Types 2025 & 2033
- Figure 21: South America Shipping Temperature Indicator Revenue Share (%), by Types 2025 & 2033
- Figure 22: South America Shipping Temperature Indicator Volume Share (%), by Types 2025 & 2033
- Figure 23: South America Shipping Temperature Indicator Revenue (million), by Country 2025 & 2033
- Figure 24: South America Shipping Temperature Indicator Volume (K), by Country 2025 & 2033
- Figure 25: South America Shipping Temperature Indicator Revenue Share (%), by Country 2025 & 2033
- Figure 26: South America Shipping Temperature Indicator Volume Share (%), by Country 2025 & 2033
- Figure 27: Europe Shipping Temperature Indicator Revenue (million), by Application 2025 & 2033
- Figure 28: Europe Shipping Temperature Indicator Volume (K), by Application 2025 & 2033
- Figure 29: Europe Shipping Temperature Indicator Revenue Share (%), by Application 2025 & 2033
- Figure 30: Europe Shipping Temperature Indicator Volume Share (%), by Application 2025 & 2033
- Figure 31: Europe Shipping Temperature Indicator Revenue (million), by Types 2025 & 2033
- Figure 32: Europe Shipping Temperature Indicator Volume (K), by Types 2025 & 2033
- Figure 33: Europe Shipping Temperature Indicator Revenue Share (%), by Types 2025 & 2033
- Figure 34: Europe Shipping Temperature Indicator Volume Share (%), by Types 2025 & 2033
- Figure 35: Europe Shipping Temperature Indicator Revenue (million), by Country 2025 & 2033
- Figure 36: Europe Shipping Temperature Indicator Volume (K), by Country 2025 & 2033
- Figure 37: Europe Shipping Temperature Indicator Revenue Share (%), by Country 2025 & 2033
- Figure 38: Europe Shipping Temperature Indicator Volume Share (%), by Country 2025 & 2033
- Figure 39: Middle East & Africa Shipping Temperature Indicator Revenue (million), by Application 2025 & 2033
- Figure 40: Middle East & Africa Shipping Temperature Indicator Volume (K), by Application 2025 & 2033
- Figure 41: Middle East & Africa Shipping Temperature Indicator Revenue Share (%), by Application 2025 & 2033
- Figure 42: Middle East & Africa Shipping Temperature Indicator Volume Share (%), by Application 2025 & 2033
- Figure 43: Middle East & Africa Shipping Temperature Indicator Revenue (million), by Types 2025 & 2033
- Figure 44: Middle East & Africa Shipping Temperature Indicator Volume (K), by Types 2025 & 2033
- Figure 45: Middle East & Africa Shipping Temperature Indicator Revenue Share (%), by Types 2025 & 2033
- Figure 46: Middle East & Africa Shipping Temperature Indicator Volume Share (%), by Types 2025 & 2033
- Figure 47: Middle East & Africa Shipping Temperature Indicator Revenue (million), by Country 2025 & 2033
- Figure 48: Middle East & Africa Shipping Temperature Indicator Volume (K), by Country 2025 & 2033
- Figure 49: Middle East & Africa Shipping Temperature Indicator Revenue Share (%), by Country 2025 & 2033
- Figure 50: Middle East & Africa Shipping Temperature Indicator Volume Share (%), by Country 2025 & 2033
- Figure 51: Asia Pacific Shipping Temperature Indicator Revenue (million), by Application 2025 & 2033
- Figure 52: Asia Pacific Shipping Temperature Indicator Volume (K), by Application 2025 & 2033
- Figure 53: Asia Pacific Shipping Temperature Indicator Revenue Share (%), by Application 2025 & 2033
- Figure 54: Asia Pacific Shipping Temperature Indicator Volume Share (%), by Application 2025 & 2033
- Figure 55: Asia Pacific Shipping Temperature Indicator Revenue (million), by Types 2025 & 2033
- Figure 56: Asia Pacific Shipping Temperature Indicator Volume (K), by Types 2025 & 2033
- Figure 57: Asia Pacific Shipping Temperature Indicator Revenue Share (%), by Types 2025 & 2033
- Figure 58: Asia Pacific Shipping Temperature Indicator Volume Share (%), by Types 2025 & 2033
- Figure 59: Asia Pacific Shipping Temperature Indicator Revenue (million), by Country 2025 & 2033
- Figure 60: Asia Pacific Shipping Temperature Indicator Volume (K), by Country 2025 & 2033
- Figure 61: Asia Pacific Shipping Temperature Indicator Revenue Share (%), by Country 2025 & 2033
- Figure 62: Asia Pacific Shipping Temperature Indicator Volume Share (%), by Country 2025 & 2033
List of Tables
- Table 1: Global Shipping Temperature Indicator Revenue million Forecast, by Application 2020 & 2033
- Table 2: Global Shipping Temperature Indicator Volume K Forecast, by Application 2020 & 2033
- Table 3: Global Shipping Temperature Indicator Revenue million Forecast, by Types 2020 & 2033
- Table 4: Global Shipping Temperature Indicator Volume K Forecast, by Types 2020 & 2033
- Table 5: Global Shipping Temperature Indicator Revenue million Forecast, by Region 2020 & 2033
- Table 6: Global Shipping Temperature Indicator Volume K Forecast, by Region 2020 & 2033
- Table 7: Global Shipping Temperature Indicator Revenue million Forecast, by Application 2020 & 2033
- Table 8: Global Shipping Temperature Indicator Volume K Forecast, by Application 2020 & 2033
- Table 9: Global Shipping Temperature Indicator Revenue million Forecast, by Types 2020 & 2033
- Table 10: Global Shipping Temperature Indicator Volume K Forecast, by Types 2020 & 2033
- Table 11: Global Shipping Temperature Indicator Revenue million Forecast, by Country 2020 & 2033
- Table 12: Global Shipping Temperature Indicator Volume K Forecast, by Country 2020 & 2033
- Table 13: United States Shipping Temperature Indicator Revenue (million) Forecast, by Application 2020 & 2033
- Table 14: United States Shipping Temperature Indicator Volume (K) Forecast, by Application 2020 & 2033
- Table 15: Canada Shipping Temperature Indicator Revenue (million) Forecast, by Application 2020 & 2033
- Table 16: Canada Shipping Temperature Indicator Volume (K) Forecast, by Application 2020 & 2033
- Table 17: Mexico Shipping Temperature Indicator Revenue (million) Forecast, by Application 2020 & 2033
- Table 18: Mexico Shipping Temperature Indicator Volume (K) Forecast, by Application 2020 & 2033
- Table 19: Global Shipping Temperature Indicator Revenue million Forecast, by Application 2020 & 2033
- Table 20: Global Shipping Temperature Indicator Volume K Forecast, by Application 2020 & 2033
- Table 21: Global Shipping Temperature Indicator Revenue million Forecast, by Types 2020 & 2033
- Table 22: Global Shipping Temperature Indicator Volume K Forecast, by Types 2020 & 2033
- Table 23: Global Shipping Temperature Indicator Revenue million Forecast, by Country 2020 & 2033
- Table 24: Global Shipping Temperature Indicator Volume K Forecast, by Country 2020 & 2033
- Table 25: Brazil Shipping Temperature Indicator Revenue (million) Forecast, by Application 2020 & 2033
- Table 26: Brazil Shipping Temperature Indicator Volume (K) Forecast, by Application 2020 & 2033
- Table 27: Argentina Shipping Temperature Indicator Revenue (million) Forecast, by Application 2020 & 2033
- Table 28: Argentina Shipping Temperature Indicator Volume (K) Forecast, by Application 2020 & 2033
- Table 29: Rest of South America Shipping Temperature Indicator Revenue (million) Forecast, by Application 2020 & 2033
- Table 30: Rest of South America Shipping Temperature Indicator Volume (K) Forecast, by Application 2020 & 2033
- Table 31: Global Shipping Temperature Indicator Revenue million Forecast, by Application 2020 & 2033
- Table 32: Global Shipping Temperature Indicator Volume K Forecast, by Application 2020 & 2033
- Table 33: Global Shipping Temperature Indicator Revenue million Forecast, by Types 2020 & 2033
- Table 34: Global Shipping Temperature Indicator Volume K Forecast, by Types 2020 & 2033
- Table 35: Global Shipping Temperature Indicator Revenue million Forecast, by Country 2020 & 2033
- Table 36: Global Shipping Temperature Indicator Volume K Forecast, by Country 2020 & 2033
- Table 37: United Kingdom Shipping Temperature Indicator Revenue (million) Forecast, by Application 2020 & 2033
- Table 38: United Kingdom Shipping Temperature Indicator Volume (K) Forecast, by Application 2020 & 2033
- Table 39: Germany Shipping Temperature Indicator Revenue (million) Forecast, by Application 2020 & 2033
- Table 40: Germany Shipping Temperature Indicator Volume (K) Forecast, by Application 2020 & 2033
- Table 41: France Shipping Temperature Indicator Revenue (million) Forecast, by Application 2020 & 2033
- Table 42: France Shipping Temperature Indicator Volume (K) Forecast, by Application 2020 & 2033
- Table 43: Italy Shipping Temperature Indicator Revenue (million) Forecast, by Application 2020 & 2033
- Table 44: Italy Shipping Temperature Indicator Volume (K) Forecast, by Application 2020 & 2033
- Table 45: Spain Shipping Temperature Indicator Revenue (million) Forecast, by Application 2020 & 2033
- Table 46: Spain Shipping Temperature Indicator Volume (K) Forecast, by Application 2020 & 2033
- Table 47: Russia Shipping Temperature Indicator Revenue (million) Forecast, by Application 2020 & 2033
- Table 48: Russia Shipping Temperature Indicator Volume (K) Forecast, by Application 2020 & 2033
- Table 49: Benelux Shipping Temperature Indicator Revenue (million) Forecast, by Application 2020 & 2033
- Table 50: Benelux Shipping Temperature Indicator Volume (K) Forecast, by Application 2020 & 2033
- Table 51: Nordics Shipping Temperature Indicator Revenue (million) Forecast, by Application 2020 & 2033
- Table 52: Nordics Shipping Temperature Indicator Volume (K) Forecast, by Application 2020 & 2033
- Table 53: Rest of Europe Shipping Temperature Indicator Revenue (million) Forecast, by Application 2020 & 2033
- Table 54: Rest of Europe Shipping Temperature Indicator Volume (K) Forecast, by Application 2020 & 2033
- Table 55: Global Shipping Temperature Indicator Revenue million Forecast, by Application 2020 & 2033
- Table 56: Global Shipping Temperature Indicator Volume K Forecast, by Application 2020 & 2033
- Table 57: Global Shipping Temperature Indicator Revenue million Forecast, by Types 2020 & 2033
- Table 58: Global Shipping Temperature Indicator Volume K Forecast, by Types 2020 & 2033
- Table 59: Global Shipping Temperature Indicator Revenue million Forecast, by Country 2020 & 2033
- Table 60: Global Shipping Temperature Indicator Volume K Forecast, by Country 2020 & 2033
- Table 61: Turkey Shipping Temperature Indicator Revenue (million) Forecast, by Application 2020 & 2033
- Table 62: Turkey Shipping Temperature Indicator Volume (K) Forecast, by Application 2020 & 2033
- Table 63: Israel Shipping Temperature Indicator Revenue (million) Forecast, by Application 2020 & 2033
- Table 64: Israel Shipping Temperature Indicator Volume (K) Forecast, by Application 2020 & 2033
- Table 65: GCC Shipping Temperature Indicator Revenue (million) Forecast, by Application 2020 & 2033
- Table 66: GCC Shipping Temperature Indicator Volume (K) Forecast, by Application 2020 & 2033
- Table 67: North Africa Shipping Temperature Indicator Revenue (million) Forecast, by Application 2020 & 2033
- Table 68: North Africa Shipping Temperature Indicator Volume (K) Forecast, by Application 2020 & 2033
- Table 69: South Africa Shipping Temperature Indicator Revenue (million) Forecast, by Application 2020 & 2033
- Table 70: South Africa Shipping Temperature Indicator Volume (K) Forecast, by Application 2020 & 2033
- Table 71: Rest of Middle East & Africa Shipping Temperature Indicator Revenue (million) Forecast, by Application 2020 & 2033
- Table 72: Rest of Middle East & Africa Shipping Temperature Indicator Volume (K) Forecast, by Application 2020 & 2033
- Table 73: Global Shipping Temperature Indicator Revenue million Forecast, by Application 2020 & 2033
- Table 74: Global Shipping Temperature Indicator Volume K Forecast, by Application 2020 & 2033
- Table 75: Global Shipping Temperature Indicator Revenue million Forecast, by Types 2020 & 2033
- Table 76: Global Shipping Temperature Indicator Volume K Forecast, by Types 2020 & 2033
- Table 77: Global Shipping Temperature Indicator Revenue million Forecast, by Country 2020 & 2033
- Table 78: Global Shipping Temperature Indicator Volume K Forecast, by Country 2020 & 2033
- Table 79: China Shipping Temperature Indicator Revenue (million) Forecast, by Application 2020 & 2033
- Table 80: China Shipping Temperature Indicator Volume (K) Forecast, by Application 2020 & 2033
- Table 81: India Shipping Temperature Indicator Revenue (million) Forecast, by Application 2020 & 2033
- Table 82: India Shipping Temperature Indicator Volume (K) Forecast, by Application 2020 & 2033
- Table 83: Japan Shipping Temperature Indicator Revenue (million) Forecast, by Application 2020 & 2033
- Table 84: Japan Shipping Temperature Indicator Volume (K) Forecast, by Application 2020 & 2033
- Table 85: South Korea Shipping Temperature Indicator Revenue (million) Forecast, by Application 2020 & 2033
- Table 86: South Korea Shipping Temperature Indicator Volume (K) Forecast, by Application 2020 & 2033
- Table 87: ASEAN Shipping Temperature Indicator Revenue (million) Forecast, by Application 2020 & 2033
- Table 88: ASEAN Shipping Temperature Indicator Volume (K) Forecast, by Application 2020 & 2033
- Table 89: Oceania Shipping Temperature Indicator Revenue (million) Forecast, by Application 2020 & 2033
- Table 90: Oceania Shipping Temperature Indicator Volume (K) Forecast, by Application 2020 & 2033
- Table 91: Rest of Asia Pacific Shipping Temperature Indicator Revenue (million) Forecast, by Application 2020 & 2033
- Table 92: Rest of Asia Pacific Shipping Temperature Indicator Volume (K) Forecast, by Application 2020 & 2033
Frequently Asked Questions
1. What is the projected Compound Annual Growth Rate (CAGR) of the Shipping Temperature Indicator?
The projected CAGR is approximately XX%.
2. Which companies are prominent players in the Shipping Temperature Indicator?
Key companies in the market include Timestrip, Zebra Technologies, SpotSee, Wessex Power, LogTag, Tempmate, Varcode, JUMO, DeltaTrak, Siltech, Berlinger, Temperature Indicators, Evigence, Vitsab International, OMEGA, Brady, Cole-Parmer Instrument, Eltronis.
3. What are the main segments of the Shipping Temperature Indicator?
The market segments include Application, Types.
4. Can you provide details about the market size?
The market size is estimated to be USD XXX million as of 2022.
5. What are some drivers contributing to market growth?
N/A
6. What are the notable trends driving market growth?
N/A
7. Are there any restraints impacting market growth?
N/A
8. Can you provide examples of recent developments in the market?
N/A
9. What pricing options are available for accessing the report?
Pricing options include single-user, multi-user, and enterprise licenses priced at USD 3950.00, USD 5925.00, and USD 7900.00 respectively.
10. Is the market size provided in terms of value or volume?
The market size is provided in terms of value, measured in million and volume, measured in K.
11. Are there any specific market keywords associated with the report?
Yes, the market keyword associated with the report is "Shipping Temperature Indicator," which aids in identifying and referencing the specific market segment covered.
12. How do I determine which pricing option suits my needs best?
The pricing options vary based on user requirements and access needs. Individual users may opt for single-user licenses, while businesses requiring broader access may choose multi-user or enterprise licenses for cost-effective access to the report.
13. Are there any additional resources or data provided in the Shipping Temperature Indicator report?
While the report offers comprehensive insights, it's advisable to review the specific contents or supplementary materials provided to ascertain if additional resources or data are available.
14. How can I stay updated on further developments or reports in the Shipping Temperature Indicator?
To stay informed about further developments, trends, and reports in the Shipping Temperature Indicator, consider subscribing to industry newsletters, following relevant companies and organizations, or regularly checking reputable industry news sources and publications.
Methodology
Step 1 - Identification of Relevant Samples Size from Population Database


Step 2 - Approaches for Defining Global Market Size (Value, Volume* & Price*)

Note*: In applicable scenarios
Step 3 - Data Sources
Primary Research
- Web Analytics
- Survey Reports
- Research Institute
- Latest Research Reports
- Opinion Leaders
Secondary Research
- Annual Reports
- White Paper
- Latest Press Release
- Industry Association
- Paid Database
- Investor Presentations

Step 4 - Data Triangulation
Involves using different sources of information in order to increase the validity of a study
These sources are likely to be stakeholders in a program - participants, other researchers, program staff, other community members, and so on.
Then we put all data in single framework & apply various statistical tools to find out the dynamic on the market.
During the analysis stage, feedback from the stakeholder groups would be compared to determine areas of agreement as well as areas of divergence