

Key Insights
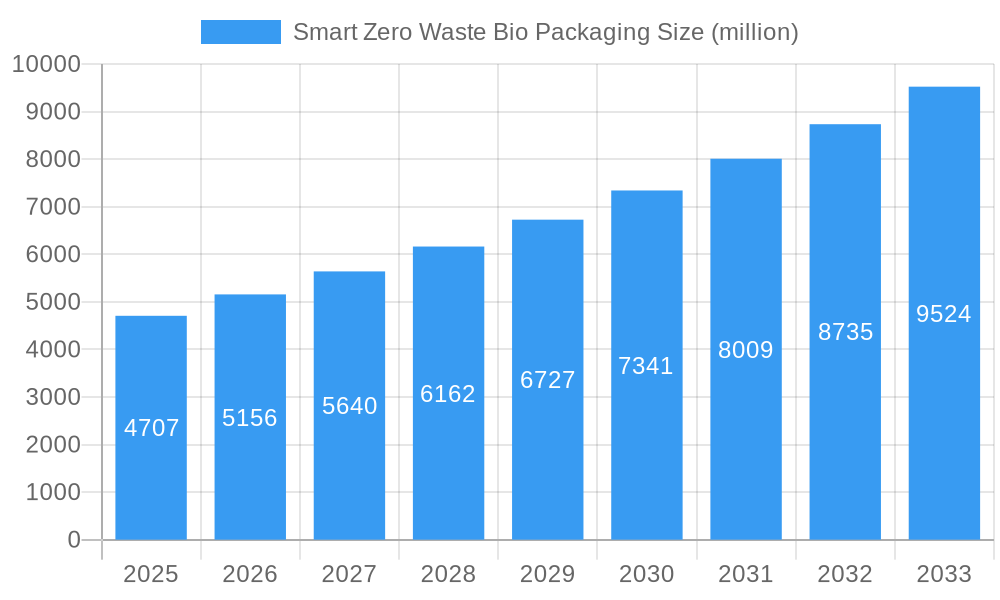
The Smart Zero Waste Bio Packaging market is poised for significant expansion, projected to reach a substantial market size of $4707 million. This growth is underpinned by an impressive Compound Annual Growth Rate (CAGR) of 9.6%, indicating a robust and accelerating adoption of sustainable packaging solutions. Key drivers for this upward trajectory include increasing global environmental awareness, stringent government regulations favoring eco-friendly alternatives, and a growing consumer preference for products with minimal environmental impact. The demand for bio-based packaging is particularly strong in sectors like Food and Beverage, Healthcare, and Personal Care, where concerns about plastic waste are most pronounced. Innovations in material science, such as the development of advanced bioplastics from renewable resources like bamboo, seaweed, and sugarcane, are further fueling market growth by offering enhanced performance, biodegradability, and compostability.
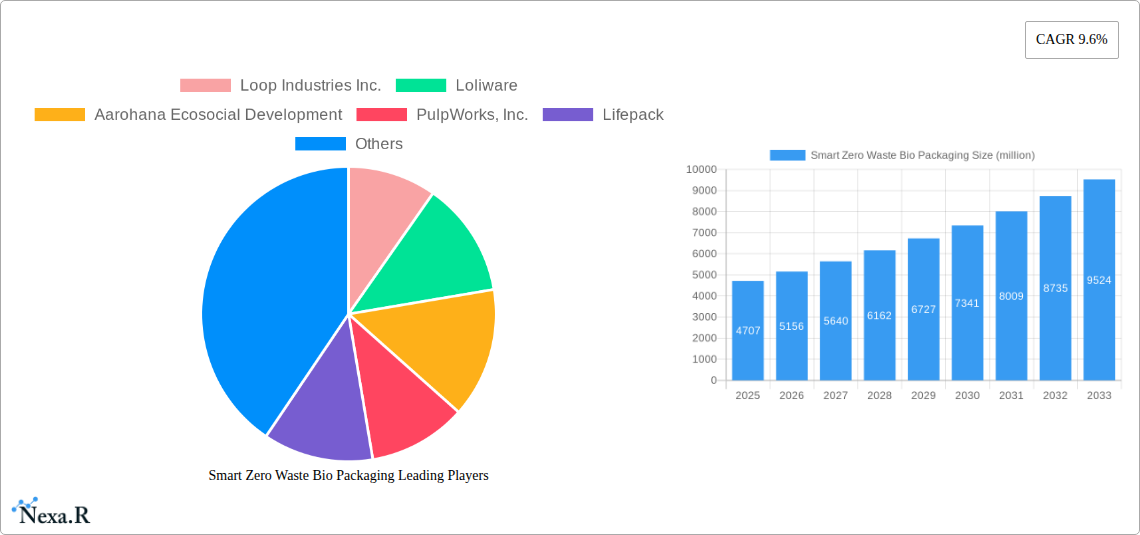
Smart Zero Waste Bio Packaging Market Size (In Billion)
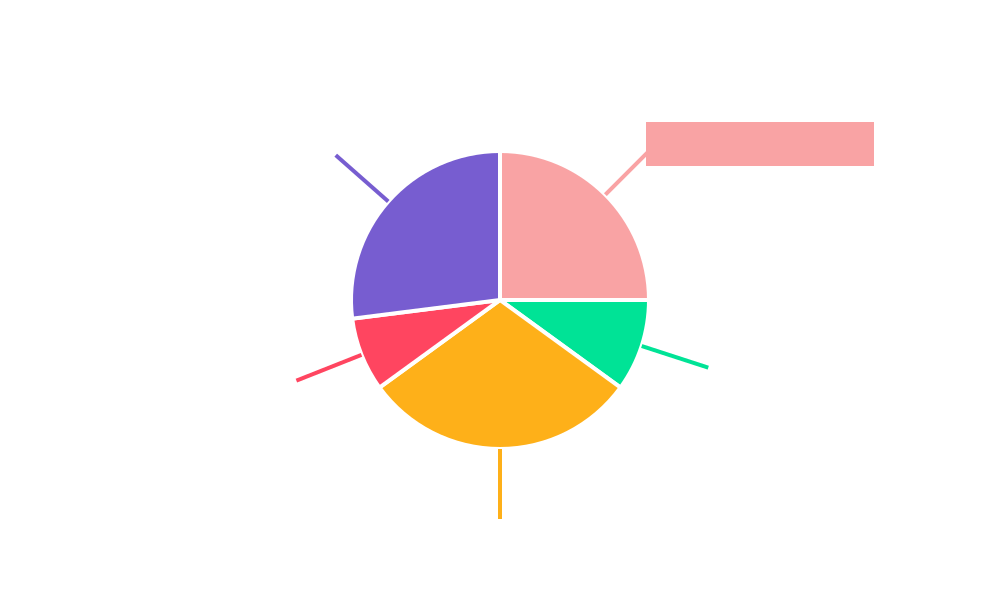
The market is segmented by application and type, with Food and Beverage Packaging expected to hold the largest share due to the sheer volume of packaging used in this sector. Healthcare packaging is also a significant segment, driven by the need for sterile, safe, and sustainable materials. The "Others" category for both application and type will likely encompass emerging uses and novel bio-based materials. Leading companies such as Loop Industries Inc., Loliware, Aarohana Ecosocial Development, and Origin Materials are at the forefront of innovation, developing cutting-edge bio-packaging solutions. While the market presents immense opportunities, certain restraints such as higher production costs compared to conventional plastics and challenges in scaling up production need to be addressed to ensure widespread adoption. However, the prevailing trends of circular economy principles and a shift towards a plastic-free future strongly support the sustained growth of the Smart Zero Waste Bio Packaging market.
Smart Zero Waste Bio Packaging Company Market Share
Smart Zero Waste Bio Packaging Market Dynamics & Structure
The global smart zero waste bio packaging market is characterized by a moderately fragmented structure, driven by increasing environmental consciousness and stringent regulations against single-use plastics. Technological innovation, particularly in material science and biodegradability, is a primary growth catalyst. Companies like Loop Industries Inc., Agilyx, and Origin Materials are at the forefront of developing advanced bio-based polymers and recycling technologies. The regulatory landscape, with bans and taxes on conventional plastics in regions like the European Union and North America, is creating a favorable environment for bio-packaging adoption. Competitive product substitutes, ranging from traditional plastics to other eco-friendly alternatives, pose a challenge, but the focus on "zero waste" and advanced biodegradability offers a distinct advantage. End-user demographics show a strong preference among millennials and Gen Z for sustainable products, influencing purchasing decisions across various sectors. Mergers and acquisitions (M&A) are increasing as larger corporations seek to integrate innovative bio-packaging solutions into their portfolios, as seen with investments in companies developing advanced materials.
- Market Concentration: Moderately fragmented with a mix of established players and emerging innovators.
- Technological Innovation Drivers: Advanced material science, biodegradability enhancement, and circular economy integration.
- Regulatory Frameworks: Stringent bans on single-use plastics, extended producer responsibility schemes, and eco-labeling initiatives.
- Competitive Product Substitutes: Reusable packaging systems, traditional biodegradable plastics, and compostable materials.
- End-User Demographics: Growing demand from environmentally conscious consumers, particularly younger generations.
- M&A Trends: Strategic acquisitions and partnerships to gain access to proprietary technologies and expand market reach.
Smart Zero Waste Bio Packaging Growth Trends & Insights
The smart zero waste bio packaging market is experiencing robust growth, projected to reach an estimated $45.25 billion by 2033, expanding at a Compound Annual Growth Rate (CAGR) of 18.7% from 2025 to 2033. This surge is underpinned by escalating consumer awareness regarding plastic pollution and a global push towards a circular economy. The base year, 2025, witnesses the market size at approximately $12.50 billion, with significant adoption rates driven by innovation in materials like sugarcane, seaweed, and bamboo. Technological disruptions are primarily focused on enhancing the biodegradability, compostability, and functionality of bio-packaging, making it a viable alternative for a wider range of applications. Consumer behavior shifts are evident in the increasing demand for products with minimal environmental footprints, pushing brands to invest heavily in sustainable packaging solutions. Companies like Loliware and Avani Eco are pioneering novel materials and applications, contributing to market penetration. The historical period (2019-2024) demonstrated initial traction, with market size growing from an estimated $4.10 billion in 2019 to $12.50 billion in 2025, showcasing a strong upward trajectory. The study period (2019–2033) encompasses these significant developments, highlighting the transformative potential of smart zero waste bio packaging. The integration of smart technologies, such as QR codes for tracing and interactive elements, further enhances product value and consumer engagement, accelerating adoption across the parent market and niche child markets alike.
Dominant Regions, Countries, or Segments in Smart Zero Waste Bio Packaging
The Food and Beverage Packaging segment, leveraging materials like sugarcane and bamboo, is the dominant force within the smart zero waste bio packaging market, accounting for an estimated 45% of the global market share in 2025. This dominance is propelled by the sheer volume of packaging required in this industry and the increasing consumer demand for sustainable options for everyday consumables. Regions like Europe and North America are leading the charge, driven by stringent environmental regulations, strong consumer awareness, and the presence of key industry players. For instance, European Union directives mandating reductions in single-use plastics and promoting circular economy principles are creating a fertile ground for bio-packaging innovation and adoption. In North America, states like California are implementing their own progressive policies, further accelerating the transition.
Leading Segment: Food and Beverage Packaging
- Market Share (2025): Approximately 45% of the global market.
- Key Drivers: High demand for single-use packaging, consumer preference for sustainable food and drink options, and stringent regulations on conventional plastics.
- Dominant Materials: Sugarcane-based packaging (bagasse), bamboo, and other rapidly renewable sources.
- Parent Market Impact: The success in food and beverage packaging acts as a gateway for broader adoption across other sectors within the sustainable materials industry.
Leading Regions: Europe and North America
- Market Share (2025): Estimated collective share of over 60% of the global market.
- Key Drivers (Europe): EU Green Deal, plastic waste directives, and a strong consumer base demanding eco-friendly products.
- Key Drivers (North America): State-level plastic bans, corporate sustainability commitments, and a growing awareness of microplastic pollution.
- Economic Policies: Favorable subsidies, tax incentives for bio-based material production, and investment in recycling infrastructure.
- Infrastructure: Development of industrial composting facilities and advanced bio-recycling technologies.
Dominant Type: Sugarcane
- Market Share (2025): Estimated 30% of the bio-packaging market by type.
- Advantages: Abundant global supply, compostability, and versatility in creating various packaging formats.
- Applications: Food containers, cups, trays, and cutlery.
The growth potential in these dominant segments and regions is substantial, as companies continue to invest in research and development to create more cost-effective and high-performance bio-packaging solutions. The expansion of the "child market" for specialized bio-packaging, such as for artisanal foods or premium personal care products, is also contributing to the overall growth trajectory.
Smart Zero Waste Bio Packaging Product Landscape
The smart zero waste bio packaging product landscape is rapidly evolving with innovations focused on enhanced biodegradability, compostability, and functional performance. Products range from rigid containers and flexible films to specialized cutlery and innovative single-use items designed to decompose entirely, leaving no harmful residue. Companies like Sulapac are developing advanced bio-based materials with properties comparable to traditional plastics, offering superior aesthetics and durability. Skipping Rocks Lab has pioneered edible water containers, demonstrating a radical approach to eliminating packaging waste. The performance metrics are continually improving, with advancements in barrier properties against moisture and oxygen, crucial for extending shelf life in food applications. Unique selling propositions include a reduced carbon footprint, the use of renewable resources, and the ability to integrate smart technologies for traceability and consumer engagement, making these products highly attractive to environmentally conscious brands and consumers.
Key Drivers, Barriers & Challenges in Smart Zero Waste Bio Packaging
Key Drivers: The smart zero waste bio packaging market is propelled by a confluence of potent drivers. Increasing global awareness of plastic pollution and its detrimental environmental impact is a primary motivator. Supportive government regulations and policies, including bans on single-use plastics and incentives for sustainable alternatives, are creating a favorable market environment. Technological advancements in material science, leading to more functional and cost-effective bio-based materials, are crucial. Furthermore, growing consumer preference for eco-friendly products is compelling brands to adopt sustainable packaging.
Barriers & Challenges: Despite the promising outlook, several challenges impede market growth. Higher production costs compared to conventional plastics remain a significant barrier, impacting scalability and affordability. Limited availability of suitable raw materials and complex supply chains can lead to price volatility and supply disruptions. Lack of standardized composting infrastructure and disposal guidelines in many regions creates confusion for consumers and waste management facilities, hindering effective end-of-life management. Performance limitations, such as lower barrier properties or shelf life compared to some conventional plastics, can restrict application scope.
Emerging Opportunities in Smart Zero Waste Bio Packaging
Emerging opportunities in the smart zero waste bio packaging sector are vast and interconnected. The development of advanced bio-composites with enhanced strength and heat resistance is opening doors for applications in sectors previously dominated by conventional plastics, such as automotive components and durable goods. The integration of smart technologies, including biodegradable sensors and embedded traceability features, presents a significant opportunity to enhance product value and consumer experience. Untapped markets in developing economies, where awareness and demand for sustainable solutions are on the rise, offer substantial growth potential. Furthermore, the exploration of novel bio-based feedstocks, such as agricultural waste and algae, can lead to more sustainable and cost-effective material production, creating a circular economy for packaging.
Growth Accelerators in the Smart Zero Waste Bio Packaging Industry
Several catalysts are accelerating the long-term growth of the smart zero waste bio packaging industry. Breakthroughs in biopolymer research, focusing on achieving properties equivalent to or exceeding those of petroleum-based plastics, are critical. Strategic partnerships and collaborations between material developers, packaging manufacturers, and large consumer brands are fostering innovation and market penetration. Market expansion strategies, including global outreach and the development of localized production facilities, will be essential to meet growing demand. The increasing focus on circular economy principles and the development of closed-loop systems for bio-packaging will further drive sustainable growth and reduce reliance on virgin resources.
Key Players Shaping the Smart Zero Waste Bio Packaging Market
- Loop Industries Inc.
- Loliware
- Aarohana Ecosocial Development
- PulpWorks, Inc.
- Lifepack
- Avani Eco
- Natural Vegan
- Agilyx
- Evoware
- Arekapak
- Bioplas
- Candy Cutlery
- Do Eat
- No Waste Technology
- Origin Materials
- Skipping Rocks Lab
- Sulapac
- Kelpn
Notable Milestones in Smart Zero Waste Bio Packaging Sector
- 2019: Increasing regulatory pressure in Europe leads to a surge in R&D for advanced biodegradable materials.
- 2020: Loop Industries Inc. announces significant advancements in its polyester recycling technology, paving the way for circularity.
- 2021: Loliware launches its innovative edible and compostable cups, garnering widespread media attention.
- 2022: Aarohana Ecosocial Development gains recognition for its work with areca leaf plates, promoting rural livelihoods and sustainable practices.
- 2023: PulpWorks, Inc. secures significant funding to expand its production of molded fiber packaging solutions.
- 2024: Lifepack introduces novel bio-based packaging for e-commerce, addressing the growing online retail waste issue.
- 2024: Avani Eco collaborates with major food service providers to introduce sugarcane-based disposable foodware.
- 2025: Agilyx announces a new facility for chemical recycling of plastic waste, including bio-based materials.
- 2025: Evoware expands its product line of seaweed-based packaging for various consumer goods.
- 2025: Origin Materials announces the scaling up of its production of bio-based chemicals and materials.
- 2025: Skipping Rocks Lab continues to innovate with its edible water pods, exploring new applications and markets.
- 2025: Sulapac launches a new generation of its biodegradable material with enhanced aesthetics and performance.
- 2025: Kelpn explores the potential of kelp as a sustainable and versatile source for bioplastics.
In-Depth Smart Zero Waste Bio Packaging Market Outlook
The future of the smart zero waste bio packaging market is exceptionally bright, driven by continuous innovation and a global commitment to sustainability. Growth accelerators, including advanced material science breakthroughs and strategic industry partnerships, will fuel market expansion. The increasing integration of smart technologies and the expansion into untapped markets will further solidify its position. The overarching trend towards a circular economy and the development of closed-loop systems will ensure sustained growth and a significant positive impact on the environment. Strategic opportunities lie in developing high-performance, cost-competitive solutions for diverse applications, particularly in the food and beverage, healthcare, and personal care sectors, positioning the market for substantial long-term potential.
Smart Zero Waste Bio Packaging Segmentation
-
1. Application
- 1.1. Food and Beverage Packaging
- 1.2. Healthcare Packaging
- 1.3. Personal Care Packaging
- 1.4. Industrial Packaging
- 1.5. Others
-
2. Type
- 2.1. Bamboo
- 2.2. Seaweed
- 2.3. Sugarcane
- 2.4. Others
Smart Zero Waste Bio Packaging Segmentation By Geography
-
1. North America
- 1.1. United States
- 1.2. Canada
- 1.3. Mexico
-
2. South America
- 2.1. Brazil
- 2.2. Argentina
- 2.3. Rest of South America
-
3. Europe
- 3.1. United Kingdom
- 3.2. Germany
- 3.3. France
- 3.4. Italy
- 3.5. Spain
- 3.6. Russia
- 3.7. Benelux
- 3.8. Nordics
- 3.9. Rest of Europe
-
4. Middle East & Africa
- 4.1. Turkey
- 4.2. Israel
- 4.3. GCC
- 4.4. North Africa
- 4.5. South Africa
- 4.6. Rest of Middle East & Africa
-
5. Asia Pacific
- 5.1. China
- 5.2. India
- 5.3. Japan
- 5.4. South Korea
- 5.5. ASEAN
- 5.6. Oceania
- 5.7. Rest of Asia Pacific
Smart Zero Waste Bio Packaging Regional Market Share
Geographic Coverage of Smart Zero Waste Bio Packaging
Smart Zero Waste Bio Packaging REPORT HIGHLIGHTS
| Aspects | Details |
|---|---|
| Study Period | 2020-2034 |
| Base Year | 2025 |
| Estimated Year | 2026 |
| Forecast Period | 2026-2034 |
| Historical Period | 2020-2025 |
| Growth Rate | CAGR of 9.6% from 2020-2034 |
| Segmentation |
|
Table of Contents
- 1. Introduction
- 1.1. Research Scope
- 1.2. Market Segmentation
- 1.3. Research Methodology
- 1.4. Definitions and Assumptions
- 2. Executive Summary
- 2.1. Introduction
- 3. Market Dynamics
- 3.1. Introduction
- 3.2. Market Drivers
- 3.3. Market Restrains
- 3.4. Market Trends
- 4. Market Factor Analysis
- 4.1. Porters Five Forces
- 4.2. Supply/Value Chain
- 4.3. PESTEL analysis
- 4.4. Market Entropy
- 4.5. Patent/Trademark Analysis
- 5. Global Smart Zero Waste Bio Packaging Analysis, Insights and Forecast, 2020-2032
- 5.1. Market Analysis, Insights and Forecast - by Application
- 5.1.1. Food and Beverage Packaging
- 5.1.2. Healthcare Packaging
- 5.1.3. Personal Care Packaging
- 5.1.4. Industrial Packaging
- 5.1.5. Others
- 5.2. Market Analysis, Insights and Forecast - by Type
- 5.2.1. Bamboo
- 5.2.2. Seaweed
- 5.2.3. Sugarcane
- 5.2.4. Others
- 5.3. Market Analysis, Insights and Forecast - by Region
- 5.3.1. North America
- 5.3.2. South America
- 5.3.3. Europe
- 5.3.4. Middle East & Africa
- 5.3.5. Asia Pacific
- 5.1. Market Analysis, Insights and Forecast - by Application
- 6. North America Smart Zero Waste Bio Packaging Analysis, Insights and Forecast, 2020-2032
- 6.1. Market Analysis, Insights and Forecast - by Application
- 6.1.1. Food and Beverage Packaging
- 6.1.2. Healthcare Packaging
- 6.1.3. Personal Care Packaging
- 6.1.4. Industrial Packaging
- 6.1.5. Others
- 6.2. Market Analysis, Insights and Forecast - by Type
- 6.2.1. Bamboo
- 6.2.2. Seaweed
- 6.2.3. Sugarcane
- 6.2.4. Others
- 6.1. Market Analysis, Insights and Forecast - by Application
- 7. South America Smart Zero Waste Bio Packaging Analysis, Insights and Forecast, 2020-2032
- 7.1. Market Analysis, Insights and Forecast - by Application
- 7.1.1. Food and Beverage Packaging
- 7.1.2. Healthcare Packaging
- 7.1.3. Personal Care Packaging
- 7.1.4. Industrial Packaging
- 7.1.5. Others
- 7.2. Market Analysis, Insights and Forecast - by Type
- 7.2.1. Bamboo
- 7.2.2. Seaweed
- 7.2.3. Sugarcane
- 7.2.4. Others
- 7.1. Market Analysis, Insights and Forecast - by Application
- 8. Europe Smart Zero Waste Bio Packaging Analysis, Insights and Forecast, 2020-2032
- 8.1. Market Analysis, Insights and Forecast - by Application
- 8.1.1. Food and Beverage Packaging
- 8.1.2. Healthcare Packaging
- 8.1.3. Personal Care Packaging
- 8.1.4. Industrial Packaging
- 8.1.5. Others
- 8.2. Market Analysis, Insights and Forecast - by Type
- 8.2.1. Bamboo
- 8.2.2. Seaweed
- 8.2.3. Sugarcane
- 8.2.4. Others
- 8.1. Market Analysis, Insights and Forecast - by Application
- 9. Middle East & Africa Smart Zero Waste Bio Packaging Analysis, Insights and Forecast, 2020-2032
- 9.1. Market Analysis, Insights and Forecast - by Application
- 9.1.1. Food and Beverage Packaging
- 9.1.2. Healthcare Packaging
- 9.1.3. Personal Care Packaging
- 9.1.4. Industrial Packaging
- 9.1.5. Others
- 9.2. Market Analysis, Insights and Forecast - by Type
- 9.2.1. Bamboo
- 9.2.2. Seaweed
- 9.2.3. Sugarcane
- 9.2.4. Others
- 9.1. Market Analysis, Insights and Forecast - by Application
- 10. Asia Pacific Smart Zero Waste Bio Packaging Analysis, Insights and Forecast, 2020-2032
- 10.1. Market Analysis, Insights and Forecast - by Application
- 10.1.1. Food and Beverage Packaging
- 10.1.2. Healthcare Packaging
- 10.1.3. Personal Care Packaging
- 10.1.4. Industrial Packaging
- 10.1.5. Others
- 10.2. Market Analysis, Insights and Forecast - by Type
- 10.2.1. Bamboo
- 10.2.2. Seaweed
- 10.2.3. Sugarcane
- 10.2.4. Others
- 10.1. Market Analysis, Insights and Forecast - by Application
- 11. Competitive Analysis
- 11.1. Global Market Share Analysis 2025
- 11.2. Company Profiles
- 11.2.1 Loop Industries Inc.
- 11.2.1.1. Overview
- 11.2.1.2. Products
- 11.2.1.3. SWOT Analysis
- 11.2.1.4. Recent Developments
- 11.2.1.5. Financials (Based on Availability)
- 11.2.2 Loliware
- 11.2.2.1. Overview
- 11.2.2.2. Products
- 11.2.2.3. SWOT Analysis
- 11.2.2.4. Recent Developments
- 11.2.2.5. Financials (Based on Availability)
- 11.2.3 Aarohana Ecosocial Development
- 11.2.3.1. Overview
- 11.2.3.2. Products
- 11.2.3.3. SWOT Analysis
- 11.2.3.4. Recent Developments
- 11.2.3.5. Financials (Based on Availability)
- 11.2.4 PulpWorks Inc.
- 11.2.4.1. Overview
- 11.2.4.2. Products
- 11.2.4.3. SWOT Analysis
- 11.2.4.4. Recent Developments
- 11.2.4.5. Financials (Based on Availability)
- 11.2.5 Lifepack
- 11.2.5.1. Overview
- 11.2.5.2. Products
- 11.2.5.3. SWOT Analysis
- 11.2.5.4. Recent Developments
- 11.2.5.5. Financials (Based on Availability)
- 11.2.6 Avani Eco
- 11.2.6.1. Overview
- 11.2.6.2. Products
- 11.2.6.3. SWOT Analysis
- 11.2.6.4. Recent Developments
- 11.2.6.5. Financials (Based on Availability)
- 11.2.7 Natural Vegan
- 11.2.7.1. Overview
- 11.2.7.2. Products
- 11.2.7.3. SWOT Analysis
- 11.2.7.4. Recent Developments
- 11.2.7.5. Financials (Based on Availability)
- 11.2.8 Agilyx
- 11.2.8.1. Overview
- 11.2.8.2. Products
- 11.2.8.3. SWOT Analysis
- 11.2.8.4. Recent Developments
- 11.2.8.5. Financials (Based on Availability)
- 11.2.9 Evoware
- 11.2.9.1. Overview
- 11.2.9.2. Products
- 11.2.9.3. SWOT Analysis
- 11.2.9.4. Recent Developments
- 11.2.9.5. Financials (Based on Availability)
- 11.2.10 Arekapak
- 11.2.10.1. Overview
- 11.2.10.2. Products
- 11.2.10.3. SWOT Analysis
- 11.2.10.4. Recent Developments
- 11.2.10.5. Financials (Based on Availability)
- 11.2.11 Bioplas
- 11.2.11.1. Overview
- 11.2.11.2. Products
- 11.2.11.3. SWOT Analysis
- 11.2.11.4. Recent Developments
- 11.2.11.5. Financials (Based on Availability)
- 11.2.12 Candy Cutlery
- 11.2.12.1. Overview
- 11.2.12.2. Products
- 11.2.12.3. SWOT Analysis
- 11.2.12.4. Recent Developments
- 11.2.12.5. Financials (Based on Availability)
- 11.2.13 Do Eat
- 11.2.13.1. Overview
- 11.2.13.2. Products
- 11.2.13.3. SWOT Analysis
- 11.2.13.4. Recent Developments
- 11.2.13.5. Financials (Based on Availability)
- 11.2.14 No Waste Technology
- 11.2.14.1. Overview
- 11.2.14.2. Products
- 11.2.14.3. SWOT Analysis
- 11.2.14.4. Recent Developments
- 11.2.14.5. Financials (Based on Availability)
- 11.2.15 Origin Materials
- 11.2.15.1. Overview
- 11.2.15.2. Products
- 11.2.15.3. SWOT Analysis
- 11.2.15.4. Recent Developments
- 11.2.15.5. Financials (Based on Availability)
- 11.2.16 Skipping Rocks Lab
- 11.2.16.1. Overview
- 11.2.16.2. Products
- 11.2.16.3. SWOT Analysis
- 11.2.16.4. Recent Developments
- 11.2.16.5. Financials (Based on Availability)
- 11.2.17 Sulapac
- 11.2.17.1. Overview
- 11.2.17.2. Products
- 11.2.17.3. SWOT Analysis
- 11.2.17.4. Recent Developments
- 11.2.17.5. Financials (Based on Availability)
- 11.2.18 Kelpn
- 11.2.18.1. Overview
- 11.2.18.2. Products
- 11.2.18.3. SWOT Analysis
- 11.2.18.4. Recent Developments
- 11.2.18.5. Financials (Based on Availability)
- 11.2.1 Loop Industries Inc.
List of Figures
- Figure 1: Global Smart Zero Waste Bio Packaging Revenue Breakdown (million, %) by Region 2025 & 2033
- Figure 2: Global Smart Zero Waste Bio Packaging Volume Breakdown (K, %) by Region 2025 & 2033
- Figure 3: North America Smart Zero Waste Bio Packaging Revenue (million), by Application 2025 & 2033
- Figure 4: North America Smart Zero Waste Bio Packaging Volume (K), by Application 2025 & 2033
- Figure 5: North America Smart Zero Waste Bio Packaging Revenue Share (%), by Application 2025 & 2033
- Figure 6: North America Smart Zero Waste Bio Packaging Volume Share (%), by Application 2025 & 2033
- Figure 7: North America Smart Zero Waste Bio Packaging Revenue (million), by Type 2025 & 2033
- Figure 8: North America Smart Zero Waste Bio Packaging Volume (K), by Type 2025 & 2033
- Figure 9: North America Smart Zero Waste Bio Packaging Revenue Share (%), by Type 2025 & 2033
- Figure 10: North America Smart Zero Waste Bio Packaging Volume Share (%), by Type 2025 & 2033
- Figure 11: North America Smart Zero Waste Bio Packaging Revenue (million), by Country 2025 & 2033
- Figure 12: North America Smart Zero Waste Bio Packaging Volume (K), by Country 2025 & 2033
- Figure 13: North America Smart Zero Waste Bio Packaging Revenue Share (%), by Country 2025 & 2033
- Figure 14: North America Smart Zero Waste Bio Packaging Volume Share (%), by Country 2025 & 2033
- Figure 15: South America Smart Zero Waste Bio Packaging Revenue (million), by Application 2025 & 2033
- Figure 16: South America Smart Zero Waste Bio Packaging Volume (K), by Application 2025 & 2033
- Figure 17: South America Smart Zero Waste Bio Packaging Revenue Share (%), by Application 2025 & 2033
- Figure 18: South America Smart Zero Waste Bio Packaging Volume Share (%), by Application 2025 & 2033
- Figure 19: South America Smart Zero Waste Bio Packaging Revenue (million), by Type 2025 & 2033
- Figure 20: South America Smart Zero Waste Bio Packaging Volume (K), by Type 2025 & 2033
- Figure 21: South America Smart Zero Waste Bio Packaging Revenue Share (%), by Type 2025 & 2033
- Figure 22: South America Smart Zero Waste Bio Packaging Volume Share (%), by Type 2025 & 2033
- Figure 23: South America Smart Zero Waste Bio Packaging Revenue (million), by Country 2025 & 2033
- Figure 24: South America Smart Zero Waste Bio Packaging Volume (K), by Country 2025 & 2033
- Figure 25: South America Smart Zero Waste Bio Packaging Revenue Share (%), by Country 2025 & 2033
- Figure 26: South America Smart Zero Waste Bio Packaging Volume Share (%), by Country 2025 & 2033
- Figure 27: Europe Smart Zero Waste Bio Packaging Revenue (million), by Application 2025 & 2033
- Figure 28: Europe Smart Zero Waste Bio Packaging Volume (K), by Application 2025 & 2033
- Figure 29: Europe Smart Zero Waste Bio Packaging Revenue Share (%), by Application 2025 & 2033
- Figure 30: Europe Smart Zero Waste Bio Packaging Volume Share (%), by Application 2025 & 2033
- Figure 31: Europe Smart Zero Waste Bio Packaging Revenue (million), by Type 2025 & 2033
- Figure 32: Europe Smart Zero Waste Bio Packaging Volume (K), by Type 2025 & 2033
- Figure 33: Europe Smart Zero Waste Bio Packaging Revenue Share (%), by Type 2025 & 2033
- Figure 34: Europe Smart Zero Waste Bio Packaging Volume Share (%), by Type 2025 & 2033
- Figure 35: Europe Smart Zero Waste Bio Packaging Revenue (million), by Country 2025 & 2033
- Figure 36: Europe Smart Zero Waste Bio Packaging Volume (K), by Country 2025 & 2033
- Figure 37: Europe Smart Zero Waste Bio Packaging Revenue Share (%), by Country 2025 & 2033
- Figure 38: Europe Smart Zero Waste Bio Packaging Volume Share (%), by Country 2025 & 2033
- Figure 39: Middle East & Africa Smart Zero Waste Bio Packaging Revenue (million), by Application 2025 & 2033
- Figure 40: Middle East & Africa Smart Zero Waste Bio Packaging Volume (K), by Application 2025 & 2033
- Figure 41: Middle East & Africa Smart Zero Waste Bio Packaging Revenue Share (%), by Application 2025 & 2033
- Figure 42: Middle East & Africa Smart Zero Waste Bio Packaging Volume Share (%), by Application 2025 & 2033
- Figure 43: Middle East & Africa Smart Zero Waste Bio Packaging Revenue (million), by Type 2025 & 2033
- Figure 44: Middle East & Africa Smart Zero Waste Bio Packaging Volume (K), by Type 2025 & 2033
- Figure 45: Middle East & Africa Smart Zero Waste Bio Packaging Revenue Share (%), by Type 2025 & 2033
- Figure 46: Middle East & Africa Smart Zero Waste Bio Packaging Volume Share (%), by Type 2025 & 2033
- Figure 47: Middle East & Africa Smart Zero Waste Bio Packaging Revenue (million), by Country 2025 & 2033
- Figure 48: Middle East & Africa Smart Zero Waste Bio Packaging Volume (K), by Country 2025 & 2033
- Figure 49: Middle East & Africa Smart Zero Waste Bio Packaging Revenue Share (%), by Country 2025 & 2033
- Figure 50: Middle East & Africa Smart Zero Waste Bio Packaging Volume Share (%), by Country 2025 & 2033
- Figure 51: Asia Pacific Smart Zero Waste Bio Packaging Revenue (million), by Application 2025 & 2033
- Figure 52: Asia Pacific Smart Zero Waste Bio Packaging Volume (K), by Application 2025 & 2033
- Figure 53: Asia Pacific Smart Zero Waste Bio Packaging Revenue Share (%), by Application 2025 & 2033
- Figure 54: Asia Pacific Smart Zero Waste Bio Packaging Volume Share (%), by Application 2025 & 2033
- Figure 55: Asia Pacific Smart Zero Waste Bio Packaging Revenue (million), by Type 2025 & 2033
- Figure 56: Asia Pacific Smart Zero Waste Bio Packaging Volume (K), by Type 2025 & 2033
- Figure 57: Asia Pacific Smart Zero Waste Bio Packaging Revenue Share (%), by Type 2025 & 2033
- Figure 58: Asia Pacific Smart Zero Waste Bio Packaging Volume Share (%), by Type 2025 & 2033
- Figure 59: Asia Pacific Smart Zero Waste Bio Packaging Revenue (million), by Country 2025 & 2033
- Figure 60: Asia Pacific Smart Zero Waste Bio Packaging Volume (K), by Country 2025 & 2033
- Figure 61: Asia Pacific Smart Zero Waste Bio Packaging Revenue Share (%), by Country 2025 & 2033
- Figure 62: Asia Pacific Smart Zero Waste Bio Packaging Volume Share (%), by Country 2025 & 2033
List of Tables
- Table 1: Global Smart Zero Waste Bio Packaging Revenue million Forecast, by Application 2020 & 2033
- Table 2: Global Smart Zero Waste Bio Packaging Volume K Forecast, by Application 2020 & 2033
- Table 3: Global Smart Zero Waste Bio Packaging Revenue million Forecast, by Type 2020 & 2033
- Table 4: Global Smart Zero Waste Bio Packaging Volume K Forecast, by Type 2020 & 2033
- Table 5: Global Smart Zero Waste Bio Packaging Revenue million Forecast, by Region 2020 & 2033
- Table 6: Global Smart Zero Waste Bio Packaging Volume K Forecast, by Region 2020 & 2033
- Table 7: Global Smart Zero Waste Bio Packaging Revenue million Forecast, by Application 2020 & 2033
- Table 8: Global Smart Zero Waste Bio Packaging Volume K Forecast, by Application 2020 & 2033
- Table 9: Global Smart Zero Waste Bio Packaging Revenue million Forecast, by Type 2020 & 2033
- Table 10: Global Smart Zero Waste Bio Packaging Volume K Forecast, by Type 2020 & 2033
- Table 11: Global Smart Zero Waste Bio Packaging Revenue million Forecast, by Country 2020 & 2033
- Table 12: Global Smart Zero Waste Bio Packaging Volume K Forecast, by Country 2020 & 2033
- Table 13: United States Smart Zero Waste Bio Packaging Revenue (million) Forecast, by Application 2020 & 2033
- Table 14: United States Smart Zero Waste Bio Packaging Volume (K) Forecast, by Application 2020 & 2033
- Table 15: Canada Smart Zero Waste Bio Packaging Revenue (million) Forecast, by Application 2020 & 2033
- Table 16: Canada Smart Zero Waste Bio Packaging Volume (K) Forecast, by Application 2020 & 2033
- Table 17: Mexico Smart Zero Waste Bio Packaging Revenue (million) Forecast, by Application 2020 & 2033
- Table 18: Mexico Smart Zero Waste Bio Packaging Volume (K) Forecast, by Application 2020 & 2033
- Table 19: Global Smart Zero Waste Bio Packaging Revenue million Forecast, by Application 2020 & 2033
- Table 20: Global Smart Zero Waste Bio Packaging Volume K Forecast, by Application 2020 & 2033
- Table 21: Global Smart Zero Waste Bio Packaging Revenue million Forecast, by Type 2020 & 2033
- Table 22: Global Smart Zero Waste Bio Packaging Volume K Forecast, by Type 2020 & 2033
- Table 23: Global Smart Zero Waste Bio Packaging Revenue million Forecast, by Country 2020 & 2033
- Table 24: Global Smart Zero Waste Bio Packaging Volume K Forecast, by Country 2020 & 2033
- Table 25: Brazil Smart Zero Waste Bio Packaging Revenue (million) Forecast, by Application 2020 & 2033
- Table 26: Brazil Smart Zero Waste Bio Packaging Volume (K) Forecast, by Application 2020 & 2033
- Table 27: Argentina Smart Zero Waste Bio Packaging Revenue (million) Forecast, by Application 2020 & 2033
- Table 28: Argentina Smart Zero Waste Bio Packaging Volume (K) Forecast, by Application 2020 & 2033
- Table 29: Rest of South America Smart Zero Waste Bio Packaging Revenue (million) Forecast, by Application 2020 & 2033
- Table 30: Rest of South America Smart Zero Waste Bio Packaging Volume (K) Forecast, by Application 2020 & 2033
- Table 31: Global Smart Zero Waste Bio Packaging Revenue million Forecast, by Application 2020 & 2033
- Table 32: Global Smart Zero Waste Bio Packaging Volume K Forecast, by Application 2020 & 2033
- Table 33: Global Smart Zero Waste Bio Packaging Revenue million Forecast, by Type 2020 & 2033
- Table 34: Global Smart Zero Waste Bio Packaging Volume K Forecast, by Type 2020 & 2033
- Table 35: Global Smart Zero Waste Bio Packaging Revenue million Forecast, by Country 2020 & 2033
- Table 36: Global Smart Zero Waste Bio Packaging Volume K Forecast, by Country 2020 & 2033
- Table 37: United Kingdom Smart Zero Waste Bio Packaging Revenue (million) Forecast, by Application 2020 & 2033
- Table 38: United Kingdom Smart Zero Waste Bio Packaging Volume (K) Forecast, by Application 2020 & 2033
- Table 39: Germany Smart Zero Waste Bio Packaging Revenue (million) Forecast, by Application 2020 & 2033
- Table 40: Germany Smart Zero Waste Bio Packaging Volume (K) Forecast, by Application 2020 & 2033
- Table 41: France Smart Zero Waste Bio Packaging Revenue (million) Forecast, by Application 2020 & 2033
- Table 42: France Smart Zero Waste Bio Packaging Volume (K) Forecast, by Application 2020 & 2033
- Table 43: Italy Smart Zero Waste Bio Packaging Revenue (million) Forecast, by Application 2020 & 2033
- Table 44: Italy Smart Zero Waste Bio Packaging Volume (K) Forecast, by Application 2020 & 2033
- Table 45: Spain Smart Zero Waste Bio Packaging Revenue (million) Forecast, by Application 2020 & 2033
- Table 46: Spain Smart Zero Waste Bio Packaging Volume (K) Forecast, by Application 2020 & 2033
- Table 47: Russia Smart Zero Waste Bio Packaging Revenue (million) Forecast, by Application 2020 & 2033
- Table 48: Russia Smart Zero Waste Bio Packaging Volume (K) Forecast, by Application 2020 & 2033
- Table 49: Benelux Smart Zero Waste Bio Packaging Revenue (million) Forecast, by Application 2020 & 2033
- Table 50: Benelux Smart Zero Waste Bio Packaging Volume (K) Forecast, by Application 2020 & 2033
- Table 51: Nordics Smart Zero Waste Bio Packaging Revenue (million) Forecast, by Application 2020 & 2033
- Table 52: Nordics Smart Zero Waste Bio Packaging Volume (K) Forecast, by Application 2020 & 2033
- Table 53: Rest of Europe Smart Zero Waste Bio Packaging Revenue (million) Forecast, by Application 2020 & 2033
- Table 54: Rest of Europe Smart Zero Waste Bio Packaging Volume (K) Forecast, by Application 2020 & 2033
- Table 55: Global Smart Zero Waste Bio Packaging Revenue million Forecast, by Application 2020 & 2033
- Table 56: Global Smart Zero Waste Bio Packaging Volume K Forecast, by Application 2020 & 2033
- Table 57: Global Smart Zero Waste Bio Packaging Revenue million Forecast, by Type 2020 & 2033
- Table 58: Global Smart Zero Waste Bio Packaging Volume K Forecast, by Type 2020 & 2033
- Table 59: Global Smart Zero Waste Bio Packaging Revenue million Forecast, by Country 2020 & 2033
- Table 60: Global Smart Zero Waste Bio Packaging Volume K Forecast, by Country 2020 & 2033
- Table 61: Turkey Smart Zero Waste Bio Packaging Revenue (million) Forecast, by Application 2020 & 2033
- Table 62: Turkey Smart Zero Waste Bio Packaging Volume (K) Forecast, by Application 2020 & 2033
- Table 63: Israel Smart Zero Waste Bio Packaging Revenue (million) Forecast, by Application 2020 & 2033
- Table 64: Israel Smart Zero Waste Bio Packaging Volume (K) Forecast, by Application 2020 & 2033
- Table 65: GCC Smart Zero Waste Bio Packaging Revenue (million) Forecast, by Application 2020 & 2033
- Table 66: GCC Smart Zero Waste Bio Packaging Volume (K) Forecast, by Application 2020 & 2033
- Table 67: North Africa Smart Zero Waste Bio Packaging Revenue (million) Forecast, by Application 2020 & 2033
- Table 68: North Africa Smart Zero Waste Bio Packaging Volume (K) Forecast, by Application 2020 & 2033
- Table 69: South Africa Smart Zero Waste Bio Packaging Revenue (million) Forecast, by Application 2020 & 2033
- Table 70: South Africa Smart Zero Waste Bio Packaging Volume (K) Forecast, by Application 2020 & 2033
- Table 71: Rest of Middle East & Africa Smart Zero Waste Bio Packaging Revenue (million) Forecast, by Application 2020 & 2033
- Table 72: Rest of Middle East & Africa Smart Zero Waste Bio Packaging Volume (K) Forecast, by Application 2020 & 2033
- Table 73: Global Smart Zero Waste Bio Packaging Revenue million Forecast, by Application 2020 & 2033
- Table 74: Global Smart Zero Waste Bio Packaging Volume K Forecast, by Application 2020 & 2033
- Table 75: Global Smart Zero Waste Bio Packaging Revenue million Forecast, by Type 2020 & 2033
- Table 76: Global Smart Zero Waste Bio Packaging Volume K Forecast, by Type 2020 & 2033
- Table 77: Global Smart Zero Waste Bio Packaging Revenue million Forecast, by Country 2020 & 2033
- Table 78: Global Smart Zero Waste Bio Packaging Volume K Forecast, by Country 2020 & 2033
- Table 79: China Smart Zero Waste Bio Packaging Revenue (million) Forecast, by Application 2020 & 2033
- Table 80: China Smart Zero Waste Bio Packaging Volume (K) Forecast, by Application 2020 & 2033
- Table 81: India Smart Zero Waste Bio Packaging Revenue (million) Forecast, by Application 2020 & 2033
- Table 82: India Smart Zero Waste Bio Packaging Volume (K) Forecast, by Application 2020 & 2033
- Table 83: Japan Smart Zero Waste Bio Packaging Revenue (million) Forecast, by Application 2020 & 2033
- Table 84: Japan Smart Zero Waste Bio Packaging Volume (K) Forecast, by Application 2020 & 2033
- Table 85: South Korea Smart Zero Waste Bio Packaging Revenue (million) Forecast, by Application 2020 & 2033
- Table 86: South Korea Smart Zero Waste Bio Packaging Volume (K) Forecast, by Application 2020 & 2033
- Table 87: ASEAN Smart Zero Waste Bio Packaging Revenue (million) Forecast, by Application 2020 & 2033
- Table 88: ASEAN Smart Zero Waste Bio Packaging Volume (K) Forecast, by Application 2020 & 2033
- Table 89: Oceania Smart Zero Waste Bio Packaging Revenue (million) Forecast, by Application 2020 & 2033
- Table 90: Oceania Smart Zero Waste Bio Packaging Volume (K) Forecast, by Application 2020 & 2033
- Table 91: Rest of Asia Pacific Smart Zero Waste Bio Packaging Revenue (million) Forecast, by Application 2020 & 2033
- Table 92: Rest of Asia Pacific Smart Zero Waste Bio Packaging Volume (K) Forecast, by Application 2020 & 2033
Frequently Asked Questions
1. What is the projected Compound Annual Growth Rate (CAGR) of the Smart Zero Waste Bio Packaging?
The projected CAGR is approximately 9.6%.
2. Which companies are prominent players in the Smart Zero Waste Bio Packaging?
Key companies in the market include Loop Industries Inc., Loliware, Aarohana Ecosocial Development, PulpWorks, Inc., Lifepack, Avani Eco, Natural Vegan, Agilyx, Evoware, Arekapak, Bioplas, Candy Cutlery, Do Eat, No Waste Technology, Origin Materials, Skipping Rocks Lab, Sulapac, Kelpn.
3. What are the main segments of the Smart Zero Waste Bio Packaging?
The market segments include Application, Type.
4. Can you provide details about the market size?
The market size is estimated to be USD 4707 million as of 2022.
5. What are some drivers contributing to market growth?
N/A
6. What are the notable trends driving market growth?
N/A
7. Are there any restraints impacting market growth?
N/A
8. Can you provide examples of recent developments in the market?
N/A
9. What pricing options are available for accessing the report?
Pricing options include single-user, multi-user, and enterprise licenses priced at USD 3950.00, USD 5925.00, and USD 7900.00 respectively.
10. Is the market size provided in terms of value or volume?
The market size is provided in terms of value, measured in million and volume, measured in K.
11. Are there any specific market keywords associated with the report?
Yes, the market keyword associated with the report is "Smart Zero Waste Bio Packaging," which aids in identifying and referencing the specific market segment covered.
12. How do I determine which pricing option suits my needs best?
The pricing options vary based on user requirements and access needs. Individual users may opt for single-user licenses, while businesses requiring broader access may choose multi-user or enterprise licenses for cost-effective access to the report.
13. Are there any additional resources or data provided in the Smart Zero Waste Bio Packaging report?
While the report offers comprehensive insights, it's advisable to review the specific contents or supplementary materials provided to ascertain if additional resources or data are available.
14. How can I stay updated on further developments or reports in the Smart Zero Waste Bio Packaging?
To stay informed about further developments, trends, and reports in the Smart Zero Waste Bio Packaging, consider subscribing to industry newsletters, following relevant companies and organizations, or regularly checking reputable industry news sources and publications.
Methodology
Step 1 - Identification of Relevant Samples Size from Population Database


Step 2 - Approaches for Defining Global Market Size (Value, Volume* & Price*)

Note*: In applicable scenarios
Step 3 - Data Sources
Primary Research
- Web Analytics
- Survey Reports
- Research Institute
- Latest Research Reports
- Opinion Leaders
Secondary Research
- Annual Reports
- White Paper
- Latest Press Release
- Industry Association
- Paid Database
- Investor Presentations

Step 4 - Data Triangulation
Involves using different sources of information in order to increase the validity of a study
These sources are likely to be stakeholders in a program - participants, other researchers, program staff, other community members, and so on.
Then we put all data in single framework & apply various statistical tools to find out the dynamic on the market.
During the analysis stage, feedback from the stakeholder groups would be compared to determine areas of agreement as well as areas of divergence