

Key Insights
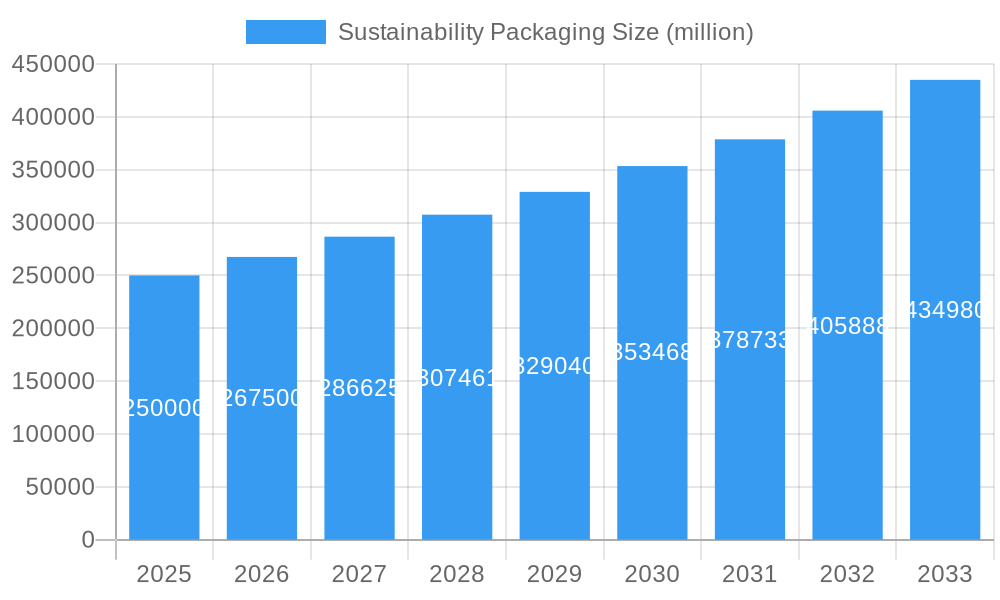
The sustainability packaging market is experiencing robust growth, driven by escalating consumer awareness of environmental issues and stringent government regulations aimed at reducing plastic waste. The market, valued at approximately $250 billion in 2025, is projected to exhibit a Compound Annual Growth Rate (CAGR) of 7% from 2025 to 2033, reaching an estimated $450 billion by 2033. This expansion is fueled by several key drivers, including the increasing adoption of eco-friendly materials like biodegradable plastics, paper-based packaging, and compostable alternatives. Furthermore, brands are increasingly leveraging sustainable packaging as a crucial component of their corporate social responsibility (CSR) initiatives, boosting demand for innovative and environmentally conscious solutions. Trends such as the growth of e-commerce, leading to increased packaging needs, and the simultaneous focus on reducing packaging waste are creating a complex but ultimately growth-oriented market landscape.
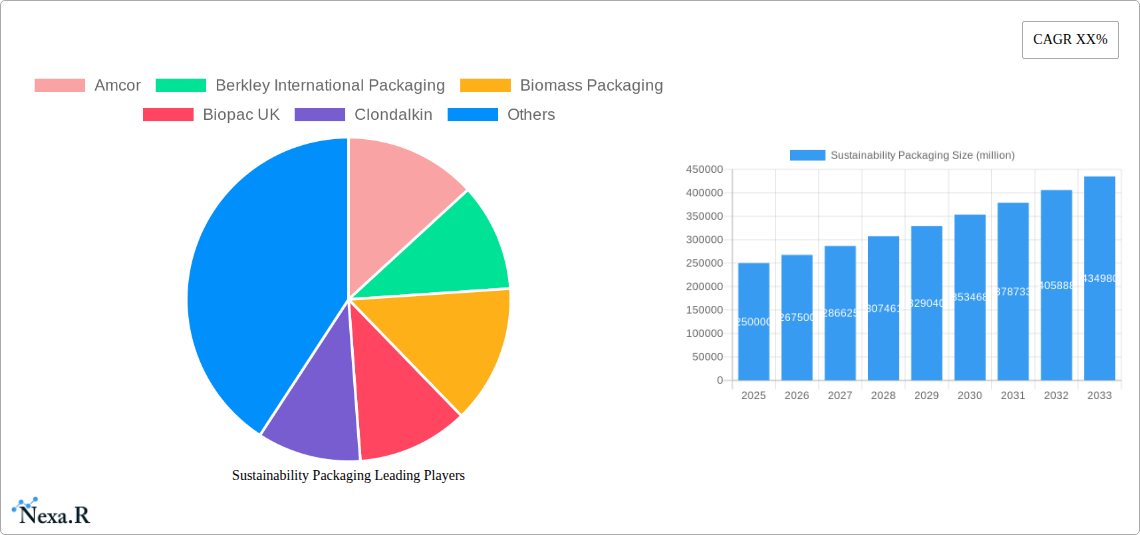
Sustainability Packaging Market Size (In Billion)
Significant restraints, however, continue to challenge market growth. The higher cost of sustainable materials compared to conventional options presents a barrier for some businesses. Additionally, inconsistencies in the infrastructure for recycling and composting sustainable packaging across different regions impede wider adoption. The market is segmented by material type (paperboard, plastics, bioplastics, etc.), packaging type (bottles, containers, films, etc.), and end-use industry (food and beverage, cosmetics, pharmaceuticals, etc.). Key players like Amcor, DS Smith, and Huhtamaki are actively investing in research and development to create more sustainable and cost-effective packaging solutions. Regional variations exist, with North America and Europe currently holding significant market shares, although growth in Asia-Pacific is expected to accelerate due to rising consumer awareness and government support for sustainable practices.
Sustainability Packaging Company Market Share
This comprehensive report provides an in-depth analysis of the global sustainability packaging market, covering the period 2019-2033. It examines market dynamics, growth trends, leading players, and future opportunities, offering invaluable insights for industry professionals, investors, and strategic decision-makers. The report leverages extensive primary and secondary research to deliver a robust forecast, including detailed segmentation analysis across various materials, applications, and geographic regions. The Base Year is 2025, with the Estimated Year also being 2025, and the Forecast Period spanning 2025-2033. The Historical Period covered is 2019-2024. The total market size in 2025 is estimated at xx million units.
Sustainability Packaging Market Dynamics & Structure
The sustainability packaging market is experiencing significant growth driven by increasing consumer awareness of environmental issues and stringent government regulations. Market concentration is moderate, with several key players holding substantial market share, but a fragmented landscape also exists, particularly within niche segments. Technological innovation is a key driver, with advancements in biodegradable, compostable, and recycled materials constantly pushing the boundaries of sustainable packaging solutions. Regulatory frameworks, including extended producer responsibility (EPR) schemes and plastic bans, are shaping industry practices and accelerating the adoption of sustainable alternatives. The market also witnesses significant M&A activity as major players consolidate their position and expand their product portfolios.
- Market Concentration: Moderate, with top 5 players holding approximately xx% market share in 2025.
- Technological Innovation: Focus on biodegradable plastics, compostable materials, and recycled content. Innovation barriers include cost competitiveness and scalability.
- Regulatory Landscape: Increasingly stringent regulations on plastic waste and packaging materials are driving market growth. EPR schemes are gaining traction globally.
- Competitive Substitutes: Traditional packaging materials face pressure from sustainable alternatives; however, cost remains a barrier for broader adoption in some sectors.
- End-User Demographics: Growing consumer demand for eco-friendly products fuels market growth across various end-use segments.
- M&A Activity: Significant increase in M&A deals in the past five years, with xx deals recorded between 2019-2024, totaling an estimated value of xx million USD.
Sustainability Packaging Growth Trends & Insights
The global sustainability packaging market exhibits robust growth, fueled by increasing environmental concerns and a shift towards circular economy principles. The market size is projected to witness a Compound Annual Growth Rate (CAGR) of xx% during the forecast period (2025-2033), expanding from xx million units in 2025 to xx million units by 2033. This growth is largely attributed to rising consumer preference for eco-friendly products, coupled with stringent governmental regulations aimed at reducing plastic waste. Technological advancements, such as the development of innovative biodegradable and compostable materials, further propel market expansion. Consumer behavior is shifting towards conscious purchasing decisions, actively seeking out products with sustainable packaging. Market penetration of sustainable packaging solutions is increasing across various end-use industries, though variability exists depending on material type and cost.
Dominant Regions, Countries, or Segments in Sustainability Packaging
The North American and European regions currently dominate the sustainability packaging market, driven by heightened environmental awareness, stringent regulations, and robust recycling infrastructure. Within these regions, countries like the US, Germany, and the UK exhibit significant market share. However, Asia-Pacific is projected to show the fastest growth, fuelled by rapid industrialization, increasing disposable income, and a growing focus on sustainable practices. The food and beverage segment holds a dominant share due to high demand for sustainable packaging solutions in this industry. Growth is driven by several key factors:
- North America & Europe: Strong regulatory frameworks, high consumer awareness, and advanced recycling infrastructure.
- Asia-Pacific: Rapid economic growth, increasing population, and growing consumer demand for sustainable products.
- Food and Beverage Segment: High demand for sustainable packaging materials like paperboard, compostable films, and recycled plastics.
- Other key drivers: Government incentives, advancements in bio-based materials, and increased investment in R&D.
Sustainability Packaging Product Landscape
The sustainability packaging landscape is characterized by a diverse range of materials and technologies, including biodegradable plastics, compostable films, paper-based packaging, and recycled content materials. Product innovation focuses on enhancing barrier properties, improving recyclability, and reducing environmental footprint. Unique selling propositions encompass reduced carbon emissions, increased biodegradability, and enhanced compostability. Technological advancements are constantly being made to improve material performance and reduce production costs.
Key Drivers, Barriers & Challenges in Sustainability Packaging
Key Drivers:
- Growing consumer demand for sustainable products.
- Stringent government regulations and policies promoting sustainable packaging.
- Increased corporate social responsibility initiatives.
- Technological advancements in biodegradable and compostable materials.
Key Challenges & Restraints:
- Higher cost of sustainable materials compared to traditional options.
- Lack of standardized recycling infrastructure in many regions.
- Concerns over the performance and durability of some sustainable materials.
- Supply chain complexities and limited availability of sustainable raw materials. This results in a price premium estimated at xx% in 2025.
Emerging Opportunities in Sustainability Packaging
- Growing demand for sustainable packaging solutions in e-commerce and logistics.
- Increasing use of innovative materials like seaweed-based packaging and mushroom packaging.
- Expansion into emerging markets with high growth potential.
- Development of packaging solutions with enhanced functionalities, such as intelligent packaging and active packaging.
Growth Accelerators in the Sustainability Packaging Industry
Technological breakthroughs in biodegradable and compostable materials, coupled with strategic partnerships among packaging manufacturers, brands, and recyclers, are significantly accelerating market growth. Expansion into new markets and applications, alongside increasing consumer awareness and demand for sustainable options, further contributes to long-term growth. Government incentives and policies promoting sustainable practices also play a crucial role in accelerating the industry’s development.
Notable Milestones in Sustainability Packaging Sector
- 2020: The EU introduced new regulations on single-use plastics, significantly impacting the packaging industry.
- 2021: Several major brands announced commitments to 100% recyclable or compostable packaging by a specific date.
- 2022: Significant investments were made in the development and scaling of biodegradable and compostable packaging materials.
- 2023: Several large M&A deals involving sustainability packaging companies were announced. (Specific details would be included in the full report)
In-Depth Sustainability Packaging Market Outlook
The sustainability packaging market is poised for continued robust growth, driven by increasing consumer demand, stringent regulations, and technological innovation. Future opportunities lie in the development of advanced, high-performance sustainable materials, alongside enhanced recycling infrastructure and circular economy models. Strategic partnerships and investments in R&D will be crucial for companies to remain competitive in this rapidly evolving market. The market is expected to reach xx million units by 2033, presenting significant potential for growth and innovation.
Sustainability Packaging Segmentation
-
1. Application
- 1.1. Food
- 1.2. Beverage
- 1.3. Retail and Logistics
- 1.4. Others
-
2. Types
- 2.1. Corrugated Packaging
- 2.2. Cellulose Packaging
- 2.3. Cornstarch Packaging
- 2.4. Others
Sustainability Packaging Segmentation By Geography
-
1. North America
- 1.1. United States
- 1.2. Canada
- 1.3. Mexico
-
2. South America
- 2.1. Brazil
- 2.2. Argentina
- 2.3. Rest of South America
-
3. Europe
- 3.1. United Kingdom
- 3.2. Germany
- 3.3. France
- 3.4. Italy
- 3.5. Spain
- 3.6. Russia
- 3.7. Benelux
- 3.8. Nordics
- 3.9. Rest of Europe
-
4. Middle East & Africa
- 4.1. Turkey
- 4.2. Israel
- 4.3. GCC
- 4.4. North Africa
- 4.5. South Africa
- 4.6. Rest of Middle East & Africa
-
5. Asia Pacific
- 5.1. China
- 5.2. India
- 5.3. Japan
- 5.4. South Korea
- 5.5. ASEAN
- 5.6. Oceania
- 5.7. Rest of Asia Pacific

Sustainability Packaging Regional Market Share
Geographic Coverage of Sustainability Packaging
Sustainability Packaging REPORT HIGHLIGHTS
| Aspects | Details |
|---|---|
| Study Period | 2020-2034 |
| Base Year | 2025 |
| Estimated Year | 2026 |
| Forecast Period | 2026-2034 |
| Historical Period | 2020-2025 |
| Growth Rate | CAGR of 5.3% from 2020-2034 |
| Segmentation |
|
Table of Contents
- 1. Introduction
- 1.1. Research Scope
- 1.2. Market Segmentation
- 1.3. Research Methodology
- 1.4. Definitions and Assumptions
- 2. Executive Summary
- 2.1. Introduction
- 3. Market Dynamics
- 3.1. Introduction
- 3.2. Market Drivers
- 3.3. Market Restrains
- 3.4. Market Trends
- 4. Market Factor Analysis
- 4.1. Porters Five Forces
- 4.2. Supply/Value Chain
- 4.3. PESTEL analysis
- 4.4. Market Entropy
- 4.5. Patent/Trademark Analysis
- 5. Global Sustainability Packaging Analysis, Insights and Forecast, 2020-2032
- 5.1. Market Analysis, Insights and Forecast - by Application
- 5.1.1. Food
- 5.1.2. Beverage
- 5.1.3. Retail and Logistics
- 5.1.4. Others
- 5.2. Market Analysis, Insights and Forecast - by Types
- 5.2.1. Corrugated Packaging
- 5.2.2. Cellulose Packaging
- 5.2.3. Cornstarch Packaging
- 5.2.4. Others
- 5.3. Market Analysis, Insights and Forecast - by Region
- 5.3.1. North America
- 5.3.2. South America
- 5.3.3. Europe
- 5.3.4. Middle East & Africa
- 5.3.5. Asia Pacific
- 5.1. Market Analysis, Insights and Forecast - by Application
- 6. North America Sustainability Packaging Analysis, Insights and Forecast, 2020-2032
- 6.1. Market Analysis, Insights and Forecast - by Application
- 6.1.1. Food
- 6.1.2. Beverage
- 6.1.3. Retail and Logistics
- 6.1.4. Others
- 6.2. Market Analysis, Insights and Forecast - by Types
- 6.2.1. Corrugated Packaging
- 6.2.2. Cellulose Packaging
- 6.2.3. Cornstarch Packaging
- 6.2.4. Others
- 6.1. Market Analysis, Insights and Forecast - by Application
- 7. South America Sustainability Packaging Analysis, Insights and Forecast, 2020-2032
- 7.1. Market Analysis, Insights and Forecast - by Application
- 7.1.1. Food
- 7.1.2. Beverage
- 7.1.3. Retail and Logistics
- 7.1.4. Others
- 7.2. Market Analysis, Insights and Forecast - by Types
- 7.2.1. Corrugated Packaging
- 7.2.2. Cellulose Packaging
- 7.2.3. Cornstarch Packaging
- 7.2.4. Others
- 7.1. Market Analysis, Insights and Forecast - by Application
- 8. Europe Sustainability Packaging Analysis, Insights and Forecast, 2020-2032
- 8.1. Market Analysis, Insights and Forecast - by Application
- 8.1.1. Food
- 8.1.2. Beverage
- 8.1.3. Retail and Logistics
- 8.1.4. Others
- 8.2. Market Analysis, Insights and Forecast - by Types
- 8.2.1. Corrugated Packaging
- 8.2.2. Cellulose Packaging
- 8.2.3. Cornstarch Packaging
- 8.2.4. Others
- 8.1. Market Analysis, Insights and Forecast - by Application
- 9. Middle East & Africa Sustainability Packaging Analysis, Insights and Forecast, 2020-2032
- 9.1. Market Analysis, Insights and Forecast - by Application
- 9.1.1. Food
- 9.1.2. Beverage
- 9.1.3. Retail and Logistics
- 9.1.4. Others
- 9.2. Market Analysis, Insights and Forecast - by Types
- 9.2.1. Corrugated Packaging
- 9.2.2. Cellulose Packaging
- 9.2.3. Cornstarch Packaging
- 9.2.4. Others
- 9.1. Market Analysis, Insights and Forecast - by Application
- 10. Asia Pacific Sustainability Packaging Analysis, Insights and Forecast, 2020-2032
- 10.1. Market Analysis, Insights and Forecast - by Application
- 10.1.1. Food
- 10.1.2. Beverage
- 10.1.3. Retail and Logistics
- 10.1.4. Others
- 10.2. Market Analysis, Insights and Forecast - by Types
- 10.2.1. Corrugated Packaging
- 10.2.2. Cellulose Packaging
- 10.2.3. Cornstarch Packaging
- 10.2.4. Others
- 10.1. Market Analysis, Insights and Forecast - by Application
- 11. Competitive Analysis
- 11.1. Global Market Share Analysis 2025
- 11.2. Company Profiles
- 11.2.1 Amcor
- 11.2.1.1. Overview
- 11.2.1.2. Products
- 11.2.1.3. SWOT Analysis
- 11.2.1.4. Recent Developments
- 11.2.1.5. Financials (Based on Availability)
- 11.2.2 Berkley International Packaging
- 11.2.2.1. Overview
- 11.2.2.2. Products
- 11.2.2.3. SWOT Analysis
- 11.2.2.4. Recent Developments
- 11.2.2.5. Financials (Based on Availability)
- 11.2.3 Biomass Packaging
- 11.2.3.1. Overview
- 11.2.3.2. Products
- 11.2.3.3. SWOT Analysis
- 11.2.3.4. Recent Developments
- 11.2.3.5. Financials (Based on Availability)
- 11.2.4 Biopac UK
- 11.2.4.1. Overview
- 11.2.4.2. Products
- 11.2.4.3. SWOT Analysis
- 11.2.4.4. Recent Developments
- 11.2.4.5. Financials (Based on Availability)
- 11.2.5 Clondalkin
- 11.2.5.1. Overview
- 11.2.5.2. Products
- 11.2.5.3. SWOT Analysis
- 11.2.5.4. Recent Developments
- 11.2.5.5. Financials (Based on Availability)
- 11.2.6 DS Smith
- 11.2.6.1. Overview
- 11.2.6.2. Products
- 11.2.6.3. SWOT Analysis
- 11.2.6.4. Recent Developments
- 11.2.6.5. Financials (Based on Availability)
- 11.2.7 EnviroPAK
- 11.2.7.1. Overview
- 11.2.7.2. Products
- 11.2.7.3. SWOT Analysis
- 11.2.7.4. Recent Developments
- 11.2.7.5. Financials (Based on Availability)
- 11.2.8 Evergreen Packaging
- 11.2.8.1. Overview
- 11.2.8.2. Products
- 11.2.8.3. SWOT Analysis
- 11.2.8.4. Recent Developments
- 11.2.8.5. Financials (Based on Availability)
- 11.2.9 Georgia Pacific
- 11.2.9.1. Overview
- 11.2.9.2. Products
- 11.2.9.3. SWOT Analysis
- 11.2.9.4. Recent Developments
- 11.2.9.5. Financials (Based on Availability)
- 11.2.10 Gerresheimer
- 11.2.10.1. Overview
- 11.2.10.2. Products
- 11.2.10.3. SWOT Analysis
- 11.2.10.4. Recent Developments
- 11.2.10.5. Financials (Based on Availability)
- 11.2.11 Huhtamaki
- 11.2.11.1. Overview
- 11.2.11.2. Products
- 11.2.11.3. SWOT Analysis
- 11.2.11.4. Recent Developments
- 11.2.11.5. Financials (Based on Availability)
- 11.2.12 Kruger
- 11.2.12.1. Overview
- 11.2.12.2. Products
- 11.2.12.3. SWOT Analysis
- 11.2.12.4. Recent Developments
- 11.2.12.5. Financials (Based on Availability)
- 11.2.13 Graham
- 11.2.13.1. Overview
- 11.2.13.2. Products
- 11.2.13.3. SWOT Analysis
- 11.2.13.4. Recent Developments
- 11.2.13.5. Financials (Based on Availability)
- 11.2.14 Mondi
- 11.2.14.1. Overview
- 11.2.14.2. Products
- 11.2.14.3. SWOT Analysis
- 11.2.14.4. Recent Developments
- 11.2.14.5. Financials (Based on Availability)
- 11.2.15 Tetra Laval
- 11.2.15.1. Overview
- 11.2.15.2. Products
- 11.2.15.3. SWOT Analysis
- 11.2.15.4. Recent Developments
- 11.2.15.5. Financials (Based on Availability)
- 11.2.16 Ardagh
- 11.2.16.1. Overview
- 11.2.16.2. Products
- 11.2.16.3. SWOT Analysis
- 11.2.16.4. Recent Developments
- 11.2.16.5. Financials (Based on Availability)
- 11.2.17 BeGreen Packaging
- 11.2.17.1. Overview
- 11.2.17.2. Products
- 11.2.17.3. SWOT Analysis
- 11.2.17.4. Recent Developments
- 11.2.17.5. Financials (Based on Availability)
- 11.2.1 Amcor
List of Figures
- Figure 1: Global Sustainability Packaging Revenue Breakdown (undefined, %) by Region 2025 & 2033
- Figure 2: North America Sustainability Packaging Revenue (undefined), by Application 2025 & 2033
- Figure 3: North America Sustainability Packaging Revenue Share (%), by Application 2025 & 2033
- Figure 4: North America Sustainability Packaging Revenue (undefined), by Types 2025 & 2033
- Figure 5: North America Sustainability Packaging Revenue Share (%), by Types 2025 & 2033
- Figure 6: North America Sustainability Packaging Revenue (undefined), by Country 2025 & 2033
- Figure 7: North America Sustainability Packaging Revenue Share (%), by Country 2025 & 2033
- Figure 8: South America Sustainability Packaging Revenue (undefined), by Application 2025 & 2033
- Figure 9: South America Sustainability Packaging Revenue Share (%), by Application 2025 & 2033
- Figure 10: South America Sustainability Packaging Revenue (undefined), by Types 2025 & 2033
- Figure 11: South America Sustainability Packaging Revenue Share (%), by Types 2025 & 2033
- Figure 12: South America Sustainability Packaging Revenue (undefined), by Country 2025 & 2033
- Figure 13: South America Sustainability Packaging Revenue Share (%), by Country 2025 & 2033
- Figure 14: Europe Sustainability Packaging Revenue (undefined), by Application 2025 & 2033
- Figure 15: Europe Sustainability Packaging Revenue Share (%), by Application 2025 & 2033
- Figure 16: Europe Sustainability Packaging Revenue (undefined), by Types 2025 & 2033
- Figure 17: Europe Sustainability Packaging Revenue Share (%), by Types 2025 & 2033
- Figure 18: Europe Sustainability Packaging Revenue (undefined), by Country 2025 & 2033
- Figure 19: Europe Sustainability Packaging Revenue Share (%), by Country 2025 & 2033
- Figure 20: Middle East & Africa Sustainability Packaging Revenue (undefined), by Application 2025 & 2033
- Figure 21: Middle East & Africa Sustainability Packaging Revenue Share (%), by Application 2025 & 2033
- Figure 22: Middle East & Africa Sustainability Packaging Revenue (undefined), by Types 2025 & 2033
- Figure 23: Middle East & Africa Sustainability Packaging Revenue Share (%), by Types 2025 & 2033
- Figure 24: Middle East & Africa Sustainability Packaging Revenue (undefined), by Country 2025 & 2033
- Figure 25: Middle East & Africa Sustainability Packaging Revenue Share (%), by Country 2025 & 2033
- Figure 26: Asia Pacific Sustainability Packaging Revenue (undefined), by Application 2025 & 2033
- Figure 27: Asia Pacific Sustainability Packaging Revenue Share (%), by Application 2025 & 2033
- Figure 28: Asia Pacific Sustainability Packaging Revenue (undefined), by Types 2025 & 2033
- Figure 29: Asia Pacific Sustainability Packaging Revenue Share (%), by Types 2025 & 2033
- Figure 30: Asia Pacific Sustainability Packaging Revenue (undefined), by Country 2025 & 2033
- Figure 31: Asia Pacific Sustainability Packaging Revenue Share (%), by Country 2025 & 2033
List of Tables
- Table 1: Global Sustainability Packaging Revenue undefined Forecast, by Application 2020 & 2033
- Table 2: Global Sustainability Packaging Revenue undefined Forecast, by Types 2020 & 2033
- Table 3: Global Sustainability Packaging Revenue undefined Forecast, by Region 2020 & 2033
- Table 4: Global Sustainability Packaging Revenue undefined Forecast, by Application 2020 & 2033
- Table 5: Global Sustainability Packaging Revenue undefined Forecast, by Types 2020 & 2033
- Table 6: Global Sustainability Packaging Revenue undefined Forecast, by Country 2020 & 2033
- Table 7: United States Sustainability Packaging Revenue (undefined) Forecast, by Application 2020 & 2033
- Table 8: Canada Sustainability Packaging Revenue (undefined) Forecast, by Application 2020 & 2033
- Table 9: Mexico Sustainability Packaging Revenue (undefined) Forecast, by Application 2020 & 2033
- Table 10: Global Sustainability Packaging Revenue undefined Forecast, by Application 2020 & 2033
- Table 11: Global Sustainability Packaging Revenue undefined Forecast, by Types 2020 & 2033
- Table 12: Global Sustainability Packaging Revenue undefined Forecast, by Country 2020 & 2033
- Table 13: Brazil Sustainability Packaging Revenue (undefined) Forecast, by Application 2020 & 2033
- Table 14: Argentina Sustainability Packaging Revenue (undefined) Forecast, by Application 2020 & 2033
- Table 15: Rest of South America Sustainability Packaging Revenue (undefined) Forecast, by Application 2020 & 2033
- Table 16: Global Sustainability Packaging Revenue undefined Forecast, by Application 2020 & 2033
- Table 17: Global Sustainability Packaging Revenue undefined Forecast, by Types 2020 & 2033
- Table 18: Global Sustainability Packaging Revenue undefined Forecast, by Country 2020 & 2033
- Table 19: United Kingdom Sustainability Packaging Revenue (undefined) Forecast, by Application 2020 & 2033
- Table 20: Germany Sustainability Packaging Revenue (undefined) Forecast, by Application 2020 & 2033
- Table 21: France Sustainability Packaging Revenue (undefined) Forecast, by Application 2020 & 2033
- Table 22: Italy Sustainability Packaging Revenue (undefined) Forecast, by Application 2020 & 2033
- Table 23: Spain Sustainability Packaging Revenue (undefined) Forecast, by Application 2020 & 2033
- Table 24: Russia Sustainability Packaging Revenue (undefined) Forecast, by Application 2020 & 2033
- Table 25: Benelux Sustainability Packaging Revenue (undefined) Forecast, by Application 2020 & 2033
- Table 26: Nordics Sustainability Packaging Revenue (undefined) Forecast, by Application 2020 & 2033
- Table 27: Rest of Europe Sustainability Packaging Revenue (undefined) Forecast, by Application 2020 & 2033
- Table 28: Global Sustainability Packaging Revenue undefined Forecast, by Application 2020 & 2033
- Table 29: Global Sustainability Packaging Revenue undefined Forecast, by Types 2020 & 2033
- Table 30: Global Sustainability Packaging Revenue undefined Forecast, by Country 2020 & 2033
- Table 31: Turkey Sustainability Packaging Revenue (undefined) Forecast, by Application 2020 & 2033
- Table 32: Israel Sustainability Packaging Revenue (undefined) Forecast, by Application 2020 & 2033
- Table 33: GCC Sustainability Packaging Revenue (undefined) Forecast, by Application 2020 & 2033
- Table 34: North Africa Sustainability Packaging Revenue (undefined) Forecast, by Application 2020 & 2033
- Table 35: South Africa Sustainability Packaging Revenue (undefined) Forecast, by Application 2020 & 2033
- Table 36: Rest of Middle East & Africa Sustainability Packaging Revenue (undefined) Forecast, by Application 2020 & 2033
- Table 37: Global Sustainability Packaging Revenue undefined Forecast, by Application 2020 & 2033
- Table 38: Global Sustainability Packaging Revenue undefined Forecast, by Types 2020 & 2033
- Table 39: Global Sustainability Packaging Revenue undefined Forecast, by Country 2020 & 2033
- Table 40: China Sustainability Packaging Revenue (undefined) Forecast, by Application 2020 & 2033
- Table 41: India Sustainability Packaging Revenue (undefined) Forecast, by Application 2020 & 2033
- Table 42: Japan Sustainability Packaging Revenue (undefined) Forecast, by Application 2020 & 2033
- Table 43: South Korea Sustainability Packaging Revenue (undefined) Forecast, by Application 2020 & 2033
- Table 44: ASEAN Sustainability Packaging Revenue (undefined) Forecast, by Application 2020 & 2033
- Table 45: Oceania Sustainability Packaging Revenue (undefined) Forecast, by Application 2020 & 2033
- Table 46: Rest of Asia Pacific Sustainability Packaging Revenue (undefined) Forecast, by Application 2020 & 2033
Frequently Asked Questions
1. What is the projected Compound Annual Growth Rate (CAGR) of the Sustainability Packaging?
The projected CAGR is approximately 5.3%.
2. Which companies are prominent players in the Sustainability Packaging?
Key companies in the market include Amcor, Berkley International Packaging, Biomass Packaging, Biopac UK, Clondalkin, DS Smith, EnviroPAK, Evergreen Packaging, Georgia Pacific, Gerresheimer, Huhtamaki, Kruger, Graham, Mondi, Tetra Laval, Ardagh, BeGreen Packaging.
3. What are the main segments of the Sustainability Packaging?
The market segments include Application, Types.
4. Can you provide details about the market size?
The market size is estimated to be USD XXX N/A as of 2022.
5. What are some drivers contributing to market growth?
N/A
6. What are the notable trends driving market growth?
N/A
7. Are there any restraints impacting market growth?
N/A
8. Can you provide examples of recent developments in the market?
N/A
9. What pricing options are available for accessing the report?
Pricing options include single-user, multi-user, and enterprise licenses priced at USD 2900.00, USD 4350.00, and USD 5800.00 respectively.
10. Is the market size provided in terms of value or volume?
The market size is provided in terms of value, measured in N/A.
11. Are there any specific market keywords associated with the report?
Yes, the market keyword associated with the report is "Sustainability Packaging," which aids in identifying and referencing the specific market segment covered.
12. How do I determine which pricing option suits my needs best?
The pricing options vary based on user requirements and access needs. Individual users may opt for single-user licenses, while businesses requiring broader access may choose multi-user or enterprise licenses for cost-effective access to the report.
13. Are there any additional resources or data provided in the Sustainability Packaging report?
While the report offers comprehensive insights, it's advisable to review the specific contents or supplementary materials provided to ascertain if additional resources or data are available.
14. How can I stay updated on further developments or reports in the Sustainability Packaging?
To stay informed about further developments, trends, and reports in the Sustainability Packaging, consider subscribing to industry newsletters, following relevant companies and organizations, or regularly checking reputable industry news sources and publications.
Methodology
Step 1 - Identification of Relevant Samples Size from Population Database


Step 2 - Approaches for Defining Global Market Size (Value, Volume* & Price*)

Note*: In applicable scenarios
Step 3 - Data Sources
Primary Research
- Web Analytics
- Survey Reports
- Research Institute
- Latest Research Reports
- Opinion Leaders
Secondary Research
- Annual Reports
- White Paper
- Latest Press Release
- Industry Association
- Paid Database
- Investor Presentations

Step 4 - Data Triangulation
Involves using different sources of information in order to increase the validity of a study
These sources are likely to be stakeholders in a program - participants, other researchers, program staff, other community members, and so on.
Then we put all data in single framework & apply various statistical tools to find out the dynamic on the market.
During the analysis stage, feedback from the stakeholder groups would be compared to determine areas of agreement as well as areas of divergence