

Key Insights
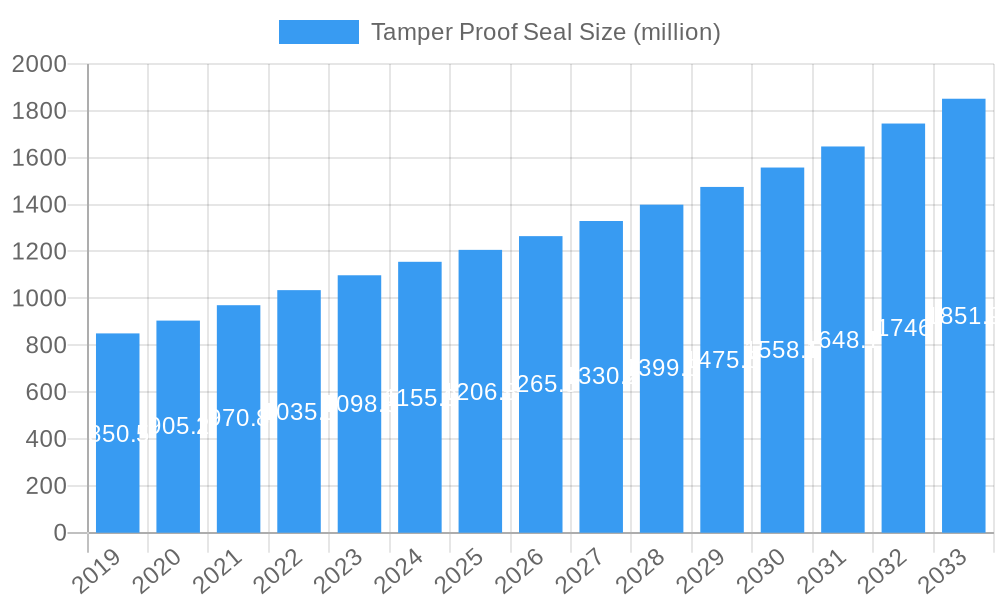
The global Tamper Proof Seal market is poised for robust growth, projected to reach \$1206.8 million in 2025 and expand at a compound annual growth rate (CAGR) of 7.3% through 2033. This significant expansion is driven by an increasing demand for enhanced security across diverse industries, particularly in medicine and healthcare, freight and logistics, and food & beverage. The heightened awareness of product integrity and the need to prevent counterfeiting and unauthorized access are primary catalysts for this upward trajectory. Furthermore, advancements in seal technology, including the development of more sophisticated plastic seals with integrated tracking mechanisms and high-security metal seals, are catering to evolving industry requirements. The growing e-commerce sector and the subsequent increase in global trade also contribute to the demand for reliable tamper-evident solutions to ensure supply chain security.
Tamper Proof Seal Market Size (In Million)
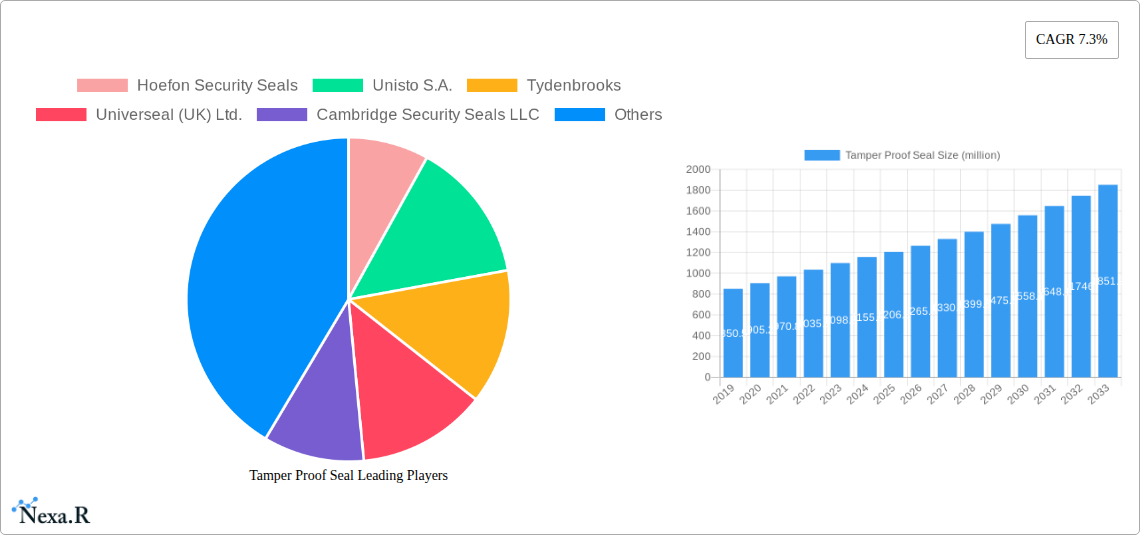
Key trends shaping the tamper-proof seal market include the integration of smart technologies for real-time tracking and monitoring, the development of sustainable and eco-friendly sealing materials, and a focus on customized solutions for specific industry needs. While the market presents substantial opportunities, certain restraints, such as the cost of implementing advanced security systems and the challenge of developing universally compliant standards, may influence adoption rates. However, the continuous innovation by leading companies like Hoefon Security Seals, Unisto S.A., and Tydenbrooks, coupled with the expanding application landscape, particularly in securing sensitive medical supplies and high-value goods, underscores a dynamic and promising future for the tamper-proof seal industry. The Asia Pacific region is expected to emerge as a significant growth engine due to its rapidly industrializing economies and expanding manufacturing base.
Tamper Proof Seal Company Market Share
This in-depth report provides a detailed examination of the global tamper-proof seal market, offering strategic insights for industry stakeholders. Spanning from 2019 to 2033, with a base year of 2025 and a forecast period of 2025–2033, this analysis covers historical trends, current market dynamics, and future growth trajectories. The report is meticulously structured to deliver actionable intelligence on market size, key drivers, emerging opportunities, competitive landscape, and regional dominance.
Tamper Proof Seal Market Dynamics & Structure
The global tamper-proof seal market is characterized by a moderate to high degree of concentration, with several key players dominating specific product segments and geographical regions. Technological innovation serves as a primary driver, with advancements in materials science and smart seal technology enabling enhanced security features and traceability. Regulatory frameworks, particularly in sectors like pharmaceuticals and food & beverage, are increasingly mandating the use of tamper-evident packaging, thereby bolstering market demand. Competitive product substitutes, such as overt security features and simple sealing mechanisms, pose a challenge, but the superior security and audit trail capabilities of dedicated tamper-proof seals maintain their competitive edge. End-user demographics are diverse, encompassing logistics providers, manufacturers, healthcare institutions, and retail businesses, all seeking to protect their products from unauthorized access and manipulation. Mergers and acquisitions (M&A) trends are evident as companies seek to expand their product portfolios, geographical reach, and technological expertise. For instance, an estimated 15-20 M&A deals are projected annually during the forecast period, driven by the need for consolidation and innovation.
- Market Concentration: Dominated by a mix of large multinational corporations and specialized niche players, with top 3-5 companies holding an estimated 40-50% market share in specific segments.
- Technological Innovation Drivers: Development of smart seals with RFID, NFC, and QR code integration for enhanced tracking and authentication, and advancements in material durability and tamper-indication methods.
- Regulatory Frameworks: Strict regulations in pharmaceutical packaging, food safety, and secure transportation are major demand catalysts.
- Competitive Product Substitutes: Limited for high-security applications, but simpler sealing solutions are prevalent in low-risk segments.
- End-User Demographics: Growing demand from e-commerce, cold chain logistics, and sensitive cargo handling.
- M&A Trends: Focus on acquiring innovative technologies and expanding market presence in high-growth regions.
Tamper Proof Seal Growth Trends & Insights
The global tamper-proof seal market is poised for robust growth, driven by an escalating global demand for enhanced supply chain security and product integrity. The market size is projected to expand from approximately USD 7,500 million in 2019 to an estimated USD 12,800 million by 2033, exhibiting a Compound Annual Growth Rate (CAGR) of approximately 4.8% from the base year 2025. Adoption rates are steadily increasing across various industries, propelled by heightened consumer awareness of product tampering and counterfeiting. Technological disruptions, such as the integration of IoT and blockchain into smart seals, are revolutionizing traceability and authentication capabilities, further accelerating market penetration. Consumer behavior shifts towards demanding greater transparency and assurance of product authenticity are also playing a significant role. The rising volume of global trade and e-commerce transactions necessitates more sophisticated security measures, directly benefiting the tamper-proof seal market. Furthermore, government initiatives and international trade agreements emphasizing supply chain security are creating a favorable environment for market expansion. The increasing focus on pharmaceutical product security, especially concerning high-value drugs and vaccines, is a particularly strong growth driver. The logistics sector's reliance on robust seals for freight and container security further contributes to the market's upward trajectory.
Dominant Regions, Countries, or Segments in Tamper Proof Seal
The Freight and Logistics segment is emerging as a dominant force in the global tamper-proof seal market, driven by the sheer volume of goods transported internationally and the increasing need for end-to-end supply chain visibility. North America and Europe currently represent the largest regional markets, due to stringent regulatory requirements and a well-established industrial base. However, the Asia Pacific region is witnessing the fastest growth, fueled by expanding manufacturing capabilities, a burgeoning e-commerce sector, and significant investments in infrastructure. Within the Types segment, Plastic Seals are expected to maintain their dominance due to their cost-effectiveness, versatility, and the availability of advanced tamper-evident features. However, Metal Seals will continue to hold a significant share, particularly in high-security applications such as container and truck sealing.
- Dominant Application Segment: Freight and Logistics, projected to account for an estimated 35-40% of the global market share by 2033.
- Key Drivers: Growth in global trade, e-commerce expansion, and the need for secure cargo tracking.
- Market Share: Holding a substantial portion due to the vast scale of international shipping and warehousing operations.
- Growth Potential: High, driven by emerging economies and increasing complexity of global supply chains.
- Leading Region: North America and Europe, with significant contributions from Asia Pacific's rapid expansion.
- Economic Policies: Favorable trade policies and investments in logistics infrastructure in Asia Pacific are key accelerators.
- Infrastructure Development: Modernized ports, warehousing, and transportation networks in emerging economies fuel demand.
- Dominant Type: Plastic Seals, due to their cost-effectiveness and diverse applications.
- Market Share: Expected to maintain a leading position due to widespread adoption across various industries.
- Growth Potential: Consistent growth driven by innovation in material science and security features.
- Emerging Application Segments: Medicine and Healthcare, with a growing emphasis on pharmaceutical supply chain integrity and patient safety.
- Regulatory Influence: Stringent regulations for drug packaging and cold chain integrity are significant drivers.
- Market Penetration: Increasing adoption for secure transport of vaccines and sensitive medications.
Tamper Proof Seal Product Landscape
The tamper-proof seal product landscape is continuously evolving with a strong emphasis on enhanced security features, smart functionalities, and material innovations. Manufacturers are developing seals with advanced tamper-evident indicators, such as void patterns, color changes, and material degradation upon attempted tampering. The integration of RFID, NFC, and QR codes is becoming increasingly common, enabling real-time tracking, authentication, and inventory management throughout the supply chain. Performance metrics such as tensile strength, resistance to environmental factors (UV, temperature extremes), and the specificity of tamper indication are key differentiators. Unique selling propositions often lie in the combination of robust physical security with digital traceability, offering a comprehensive solution for product protection.
Key Drivers, Barriers & Challenges in Tamper Proof Seal
Key Drivers:
- Increasing incidences of product counterfeiting and theft: Driving demand for reliable security solutions.
- Stringent regulatory mandates: Especially in pharmaceuticals, food & beverage, and aviation sectors, requiring tamper-evident packaging.
- Growth of global trade and e-commerce: Necessitating secure transportation and delivery of goods.
- Technological advancements: Integration of RFID, NFC, and IoT for enhanced traceability and authentication.
- Consumer awareness and demand for product authenticity: Pushing businesses to adopt higher security standards.
Barriers & Challenges:
- Cost sensitivity in certain market segments: High-security seals can be perceived as expensive by some industries.
- Availability of lower-cost, less secure alternatives: Posing competition in less critical applications.
- Supply chain disruptions and raw material price volatility: Affecting production costs and availability.
- Complex international regulations and standardization issues: Hindering widespread adoption in some regions.
- Technological obsolescence: Rapid advancements require continuous investment in R&D to stay competitive.
Emerging Opportunities in Tamper Proof Seal
Emerging opportunities in the tamper-proof seal market are largely driven by advancements in smart technologies and the increasing demand for supply chain transparency. The integration of IoT sensors within seals for real-time environmental monitoring (temperature, humidity) in cold chain logistics presents a significant growth area. Furthermore, the expansion of e-commerce into new geographies and product categories creates a demand for customized and highly secure sealing solutions. The pharmaceutical industry's focus on preventing the diversion of controlled substances and ensuring vaccine integrity offers substantial untapped potential. The development of bio-degradable and sustainable tamper-proof seals is also gaining traction as environmental concerns grow.
Growth Accelerators in the Tamper Proof Seal Industry
The tamper-proof seal industry's long-term growth is significantly propelled by continuous technological breakthroughs, particularly in the realm of smart and connected seals. The increasing adoption of blockchain technology for immutable record-keeping of product journeys will further enhance the value proposition of advanced tamper-proof seals. Strategic partnerships between seal manufacturers and logistics providers, as well as technology companies, are crucial for developing integrated solutions and expanding market reach. Market expansion into emerging economies, where supply chain security is a growing concern, will also act as a powerful growth accelerator. The development of seals with enhanced features like anti-counterfeiting holograms and embedded micro-tags will further solidify their importance.
Key Players Shaping the Tamper Proof Seal Market
- Hoefon Security Seals
- Unisto S.A.
- Tydenbrooks
- Universeal (UK) Ltd.
- Cambridge Security Seals LLC
- United Security Seals Inc.
- Yongjia Ourseal Security Seals Co.,Ltd.
- GCSEAL
- Precintia
- Acme Seals
- Mega Fortris Group
- American Casting & Manufacturing
- LeghornGroup
- Lions Security Seal Ltd
Notable Milestones in Tamper Proof Seal Sector
- 2019: Introduction of advanced RFID-enabled plastic seals for logistics tracking.
- 2020: Increased adoption of tamper-evident seals for vaccine distribution amidst global health crises.
- 2021: Development of biodegradable tamper-proof seals by several key manufacturers.
- 2022: Growing integration of QR codes for product authentication in the food and beverage industry.
- 2023: Strategic acquisitions by major players to expand technological capabilities in smart seals.
- 2024: Emergence of IoT-enabled seals for real-time monitoring of sensitive cargo conditions.
In-Depth Tamper Proof Seal Market Outlook
The future outlook for the tamper-proof seal market is exceptionally promising, driven by an unwavering global commitment to enhancing supply chain security and product integrity. Growth accelerators such as the pervasive adoption of IoT and blockchain technologies in conjunction with intelligent sealing solutions will redefine product traceability and authentication. Strategic alliances and collaborative ventures are anticipated to foster innovation and streamline market penetration, particularly in high-growth emerging economies. The increasing regulatory emphasis on pharmaceutical security and the burgeoning e-commerce sector will continue to fuel demand for advanced tamper-proof solutions. The market is set to witness sustained growth, offering significant opportunities for companies that can adapt to evolving technological landscapes and meet the rising expectations for product safety and transparency.
Tamper Proof Seal Segmentation
-
1. Application
- 1.1. Medicine and Healthcare
- 1.2. Freight and Logistics
- 1.3. Airline
- 1.4. Food & Beverage
- 1.5. Others
-
2. Types
- 2.1. Plastic Seal
- 2.2. Metal Seal
- 2.3. Others
Tamper Proof Seal Segmentation By Geography
-
1. North America
- 1.1. United States
- 1.2. Canada
- 1.3. Mexico
-
2. South America
- 2.1. Brazil
- 2.2. Argentina
- 2.3. Rest of South America
-
3. Europe
- 3.1. United Kingdom
- 3.2. Germany
- 3.3. France
- 3.4. Italy
- 3.5. Spain
- 3.6. Russia
- 3.7. Benelux
- 3.8. Nordics
- 3.9. Rest of Europe
-
4. Middle East & Africa
- 4.1. Turkey
- 4.2. Israel
- 4.3. GCC
- 4.4. North Africa
- 4.5. South Africa
- 4.6. Rest of Middle East & Africa
-
5. Asia Pacific
- 5.1. China
- 5.2. India
- 5.3. Japan
- 5.4. South Korea
- 5.5. ASEAN
- 5.6. Oceania
- 5.7. Rest of Asia Pacific

Tamper Proof Seal Regional Market Share
Geographic Coverage of Tamper Proof Seal
Tamper Proof Seal REPORT HIGHLIGHTS
| Aspects | Details |
|---|---|
| Study Period | 2020-2034 |
| Base Year | 2025 |
| Estimated Year | 2026 |
| Forecast Period | 2026-2034 |
| Historical Period | 2020-2025 |
| Growth Rate | CAGR of 6.85% from 2020-2034 |
| Segmentation |
|
Table of Contents
- 1. Introduction
- 1.1. Research Scope
- 1.2. Market Segmentation
- 1.3. Research Methodology
- 1.4. Definitions and Assumptions
- 2. Executive Summary
- 2.1. Introduction
- 3. Market Dynamics
- 3.1. Introduction
- 3.2. Market Drivers
- 3.3. Market Restrains
- 3.4. Market Trends
- 4. Market Factor Analysis
- 4.1. Porters Five Forces
- 4.2. Supply/Value Chain
- 4.3. PESTEL analysis
- 4.4. Market Entropy
- 4.5. Patent/Trademark Analysis
- 5. Global Tamper Proof Seal Analysis, Insights and Forecast, 2020-2032
- 5.1. Market Analysis, Insights and Forecast - by Application
- 5.1.1. Medicine and Healthcare
- 5.1.2. Freight and Logistics
- 5.1.3. Airline
- 5.1.4. Food & Beverage
- 5.1.5. Others
- 5.2. Market Analysis, Insights and Forecast - by Types
- 5.2.1. Plastic Seal
- 5.2.2. Metal Seal
- 5.2.3. Others
- 5.3. Market Analysis, Insights and Forecast - by Region
- 5.3.1. North America
- 5.3.2. South America
- 5.3.3. Europe
- 5.3.4. Middle East & Africa
- 5.3.5. Asia Pacific
- 5.1. Market Analysis, Insights and Forecast - by Application
- 6. North America Tamper Proof Seal Analysis, Insights and Forecast, 2020-2032
- 6.1. Market Analysis, Insights and Forecast - by Application
- 6.1.1. Medicine and Healthcare
- 6.1.2. Freight and Logistics
- 6.1.3. Airline
- 6.1.4. Food & Beverage
- 6.1.5. Others
- 6.2. Market Analysis, Insights and Forecast - by Types
- 6.2.1. Plastic Seal
- 6.2.2. Metal Seal
- 6.2.3. Others
- 6.1. Market Analysis, Insights and Forecast - by Application
- 7. South America Tamper Proof Seal Analysis, Insights and Forecast, 2020-2032
- 7.1. Market Analysis, Insights and Forecast - by Application
- 7.1.1. Medicine and Healthcare
- 7.1.2. Freight and Logistics
- 7.1.3. Airline
- 7.1.4. Food & Beverage
- 7.1.5. Others
- 7.2. Market Analysis, Insights and Forecast - by Types
- 7.2.1. Plastic Seal
- 7.2.2. Metal Seal
- 7.2.3. Others
- 7.1. Market Analysis, Insights and Forecast - by Application
- 8. Europe Tamper Proof Seal Analysis, Insights and Forecast, 2020-2032
- 8.1. Market Analysis, Insights and Forecast - by Application
- 8.1.1. Medicine and Healthcare
- 8.1.2. Freight and Logistics
- 8.1.3. Airline
- 8.1.4. Food & Beverage
- 8.1.5. Others
- 8.2. Market Analysis, Insights and Forecast - by Types
- 8.2.1. Plastic Seal
- 8.2.2. Metal Seal
- 8.2.3. Others
- 8.1. Market Analysis, Insights and Forecast - by Application
- 9. Middle East & Africa Tamper Proof Seal Analysis, Insights and Forecast, 2020-2032
- 9.1. Market Analysis, Insights and Forecast - by Application
- 9.1.1. Medicine and Healthcare
- 9.1.2. Freight and Logistics
- 9.1.3. Airline
- 9.1.4. Food & Beverage
- 9.1.5. Others
- 9.2. Market Analysis, Insights and Forecast - by Types
- 9.2.1. Plastic Seal
- 9.2.2. Metal Seal
- 9.2.3. Others
- 9.1. Market Analysis, Insights and Forecast - by Application
- 10. Asia Pacific Tamper Proof Seal Analysis, Insights and Forecast, 2020-2032
- 10.1. Market Analysis, Insights and Forecast - by Application
- 10.1.1. Medicine and Healthcare
- 10.1.2. Freight and Logistics
- 10.1.3. Airline
- 10.1.4. Food & Beverage
- 10.1.5. Others
- 10.2. Market Analysis, Insights and Forecast - by Types
- 10.2.1. Plastic Seal
- 10.2.2. Metal Seal
- 10.2.3. Others
- 10.1. Market Analysis, Insights and Forecast - by Application
- 11. Competitive Analysis
- 11.1. Global Market Share Analysis 2025
- 11.2. Company Profiles
- 11.2.1 Hoefon Security Seals
- 11.2.1.1. Overview
- 11.2.1.2. Products
- 11.2.1.3. SWOT Analysis
- 11.2.1.4. Recent Developments
- 11.2.1.5. Financials (Based on Availability)
- 11.2.2 Unisto S.A.
- 11.2.2.1. Overview
- 11.2.2.2. Products
- 11.2.2.3. SWOT Analysis
- 11.2.2.4. Recent Developments
- 11.2.2.5. Financials (Based on Availability)
- 11.2.3 Tydenbrooks
- 11.2.3.1. Overview
- 11.2.3.2. Products
- 11.2.3.3. SWOT Analysis
- 11.2.3.4. Recent Developments
- 11.2.3.5. Financials (Based on Availability)
- 11.2.4 Universeal (UK) Ltd.
- 11.2.4.1. Overview
- 11.2.4.2. Products
- 11.2.4.3. SWOT Analysis
- 11.2.4.4. Recent Developments
- 11.2.4.5. Financials (Based on Availability)
- 11.2.5 Cambridge Security Seals LLC
- 11.2.5.1. Overview
- 11.2.5.2. Products
- 11.2.5.3. SWOT Analysis
- 11.2.5.4. Recent Developments
- 11.2.5.5. Financials (Based on Availability)
- 11.2.6 United Security Seals Inc.
- 11.2.6.1. Overview
- 11.2.6.2. Products
- 11.2.6.3. SWOT Analysis
- 11.2.6.4. Recent Developments
- 11.2.6.5. Financials (Based on Availability)
- 11.2.7 Yongjia Ourseal Security Seals Co.
- 11.2.7.1. Overview
- 11.2.7.2. Products
- 11.2.7.3. SWOT Analysis
- 11.2.7.4. Recent Developments
- 11.2.7.5. Financials (Based on Availability)
- 11.2.8 Ltd.
- 11.2.8.1. Overview
- 11.2.8.2. Products
- 11.2.8.3. SWOT Analysis
- 11.2.8.4. Recent Developments
- 11.2.8.5. Financials (Based on Availability)
- 11.2.9 GCSEAL
- 11.2.9.1. Overview
- 11.2.9.2. Products
- 11.2.9.3. SWOT Analysis
- 11.2.9.4. Recent Developments
- 11.2.9.5. Financials (Based on Availability)
- 11.2.10 Precintia
- 11.2.10.1. Overview
- 11.2.10.2. Products
- 11.2.10.3. SWOT Analysis
- 11.2.10.4. Recent Developments
- 11.2.10.5. Financials (Based on Availability)
- 11.2.11 Acme Seals
- 11.2.11.1. Overview
- 11.2.11.2. Products
- 11.2.11.3. SWOT Analysis
- 11.2.11.4. Recent Developments
- 11.2.11.5. Financials (Based on Availability)
- 11.2.12 Mega Fortris Group
- 11.2.12.1. Overview
- 11.2.12.2. Products
- 11.2.12.3. SWOT Analysis
- 11.2.12.4. Recent Developments
- 11.2.12.5. Financials (Based on Availability)
- 11.2.13 American Casting & Manufacturing
- 11.2.13.1. Overview
- 11.2.13.2. Products
- 11.2.13.3. SWOT Analysis
- 11.2.13.4. Recent Developments
- 11.2.13.5. Financials (Based on Availability)
- 11.2.14 LeghornGroup
- 11.2.14.1. Overview
- 11.2.14.2. Products
- 11.2.14.3. SWOT Analysis
- 11.2.14.4. Recent Developments
- 11.2.14.5. Financials (Based on Availability)
- 11.2.15 Lions Security Seal Ltd
- 11.2.15.1. Overview
- 11.2.15.2. Products
- 11.2.15.3. SWOT Analysis
- 11.2.15.4. Recent Developments
- 11.2.15.5. Financials (Based on Availability)
- 11.2.1 Hoefon Security Seals
List of Figures
- Figure 1: Global Tamper Proof Seal Revenue Breakdown (undefined, %) by Region 2025 & 2033
- Figure 2: Global Tamper Proof Seal Volume Breakdown (K, %) by Region 2025 & 2033
- Figure 3: North America Tamper Proof Seal Revenue (undefined), by Application 2025 & 2033
- Figure 4: North America Tamper Proof Seal Volume (K), by Application 2025 & 2033
- Figure 5: North America Tamper Proof Seal Revenue Share (%), by Application 2025 & 2033
- Figure 6: North America Tamper Proof Seal Volume Share (%), by Application 2025 & 2033
- Figure 7: North America Tamper Proof Seal Revenue (undefined), by Types 2025 & 2033
- Figure 8: North America Tamper Proof Seal Volume (K), by Types 2025 & 2033
- Figure 9: North America Tamper Proof Seal Revenue Share (%), by Types 2025 & 2033
- Figure 10: North America Tamper Proof Seal Volume Share (%), by Types 2025 & 2033
- Figure 11: North America Tamper Proof Seal Revenue (undefined), by Country 2025 & 2033
- Figure 12: North America Tamper Proof Seal Volume (K), by Country 2025 & 2033
- Figure 13: North America Tamper Proof Seal Revenue Share (%), by Country 2025 & 2033
- Figure 14: North America Tamper Proof Seal Volume Share (%), by Country 2025 & 2033
- Figure 15: South America Tamper Proof Seal Revenue (undefined), by Application 2025 & 2033
- Figure 16: South America Tamper Proof Seal Volume (K), by Application 2025 & 2033
- Figure 17: South America Tamper Proof Seal Revenue Share (%), by Application 2025 & 2033
- Figure 18: South America Tamper Proof Seal Volume Share (%), by Application 2025 & 2033
- Figure 19: South America Tamper Proof Seal Revenue (undefined), by Types 2025 & 2033
- Figure 20: South America Tamper Proof Seal Volume (K), by Types 2025 & 2033
- Figure 21: South America Tamper Proof Seal Revenue Share (%), by Types 2025 & 2033
- Figure 22: South America Tamper Proof Seal Volume Share (%), by Types 2025 & 2033
- Figure 23: South America Tamper Proof Seal Revenue (undefined), by Country 2025 & 2033
- Figure 24: South America Tamper Proof Seal Volume (K), by Country 2025 & 2033
- Figure 25: South America Tamper Proof Seal Revenue Share (%), by Country 2025 & 2033
- Figure 26: South America Tamper Proof Seal Volume Share (%), by Country 2025 & 2033
- Figure 27: Europe Tamper Proof Seal Revenue (undefined), by Application 2025 & 2033
- Figure 28: Europe Tamper Proof Seal Volume (K), by Application 2025 & 2033
- Figure 29: Europe Tamper Proof Seal Revenue Share (%), by Application 2025 & 2033
- Figure 30: Europe Tamper Proof Seal Volume Share (%), by Application 2025 & 2033
- Figure 31: Europe Tamper Proof Seal Revenue (undefined), by Types 2025 & 2033
- Figure 32: Europe Tamper Proof Seal Volume (K), by Types 2025 & 2033
- Figure 33: Europe Tamper Proof Seal Revenue Share (%), by Types 2025 & 2033
- Figure 34: Europe Tamper Proof Seal Volume Share (%), by Types 2025 & 2033
- Figure 35: Europe Tamper Proof Seal Revenue (undefined), by Country 2025 & 2033
- Figure 36: Europe Tamper Proof Seal Volume (K), by Country 2025 & 2033
- Figure 37: Europe Tamper Proof Seal Revenue Share (%), by Country 2025 & 2033
- Figure 38: Europe Tamper Proof Seal Volume Share (%), by Country 2025 & 2033
- Figure 39: Middle East & Africa Tamper Proof Seal Revenue (undefined), by Application 2025 & 2033
- Figure 40: Middle East & Africa Tamper Proof Seal Volume (K), by Application 2025 & 2033
- Figure 41: Middle East & Africa Tamper Proof Seal Revenue Share (%), by Application 2025 & 2033
- Figure 42: Middle East & Africa Tamper Proof Seal Volume Share (%), by Application 2025 & 2033
- Figure 43: Middle East & Africa Tamper Proof Seal Revenue (undefined), by Types 2025 & 2033
- Figure 44: Middle East & Africa Tamper Proof Seal Volume (K), by Types 2025 & 2033
- Figure 45: Middle East & Africa Tamper Proof Seal Revenue Share (%), by Types 2025 & 2033
- Figure 46: Middle East & Africa Tamper Proof Seal Volume Share (%), by Types 2025 & 2033
- Figure 47: Middle East & Africa Tamper Proof Seal Revenue (undefined), by Country 2025 & 2033
- Figure 48: Middle East & Africa Tamper Proof Seal Volume (K), by Country 2025 & 2033
- Figure 49: Middle East & Africa Tamper Proof Seal Revenue Share (%), by Country 2025 & 2033
- Figure 50: Middle East & Africa Tamper Proof Seal Volume Share (%), by Country 2025 & 2033
- Figure 51: Asia Pacific Tamper Proof Seal Revenue (undefined), by Application 2025 & 2033
- Figure 52: Asia Pacific Tamper Proof Seal Volume (K), by Application 2025 & 2033
- Figure 53: Asia Pacific Tamper Proof Seal Revenue Share (%), by Application 2025 & 2033
- Figure 54: Asia Pacific Tamper Proof Seal Volume Share (%), by Application 2025 & 2033
- Figure 55: Asia Pacific Tamper Proof Seal Revenue (undefined), by Types 2025 & 2033
- Figure 56: Asia Pacific Tamper Proof Seal Volume (K), by Types 2025 & 2033
- Figure 57: Asia Pacific Tamper Proof Seal Revenue Share (%), by Types 2025 & 2033
- Figure 58: Asia Pacific Tamper Proof Seal Volume Share (%), by Types 2025 & 2033
- Figure 59: Asia Pacific Tamper Proof Seal Revenue (undefined), by Country 2025 & 2033
- Figure 60: Asia Pacific Tamper Proof Seal Volume (K), by Country 2025 & 2033
- Figure 61: Asia Pacific Tamper Proof Seal Revenue Share (%), by Country 2025 & 2033
- Figure 62: Asia Pacific Tamper Proof Seal Volume Share (%), by Country 2025 & 2033
List of Tables
- Table 1: Global Tamper Proof Seal Revenue undefined Forecast, by Application 2020 & 2033
- Table 2: Global Tamper Proof Seal Volume K Forecast, by Application 2020 & 2033
- Table 3: Global Tamper Proof Seal Revenue undefined Forecast, by Types 2020 & 2033
- Table 4: Global Tamper Proof Seal Volume K Forecast, by Types 2020 & 2033
- Table 5: Global Tamper Proof Seal Revenue undefined Forecast, by Region 2020 & 2033
- Table 6: Global Tamper Proof Seal Volume K Forecast, by Region 2020 & 2033
- Table 7: Global Tamper Proof Seal Revenue undefined Forecast, by Application 2020 & 2033
- Table 8: Global Tamper Proof Seal Volume K Forecast, by Application 2020 & 2033
- Table 9: Global Tamper Proof Seal Revenue undefined Forecast, by Types 2020 & 2033
- Table 10: Global Tamper Proof Seal Volume K Forecast, by Types 2020 & 2033
- Table 11: Global Tamper Proof Seal Revenue undefined Forecast, by Country 2020 & 2033
- Table 12: Global Tamper Proof Seal Volume K Forecast, by Country 2020 & 2033
- Table 13: United States Tamper Proof Seal Revenue (undefined) Forecast, by Application 2020 & 2033
- Table 14: United States Tamper Proof Seal Volume (K) Forecast, by Application 2020 & 2033
- Table 15: Canada Tamper Proof Seal Revenue (undefined) Forecast, by Application 2020 & 2033
- Table 16: Canada Tamper Proof Seal Volume (K) Forecast, by Application 2020 & 2033
- Table 17: Mexico Tamper Proof Seal Revenue (undefined) Forecast, by Application 2020 & 2033
- Table 18: Mexico Tamper Proof Seal Volume (K) Forecast, by Application 2020 & 2033
- Table 19: Global Tamper Proof Seal Revenue undefined Forecast, by Application 2020 & 2033
- Table 20: Global Tamper Proof Seal Volume K Forecast, by Application 2020 & 2033
- Table 21: Global Tamper Proof Seal Revenue undefined Forecast, by Types 2020 & 2033
- Table 22: Global Tamper Proof Seal Volume K Forecast, by Types 2020 & 2033
- Table 23: Global Tamper Proof Seal Revenue undefined Forecast, by Country 2020 & 2033
- Table 24: Global Tamper Proof Seal Volume K Forecast, by Country 2020 & 2033
- Table 25: Brazil Tamper Proof Seal Revenue (undefined) Forecast, by Application 2020 & 2033
- Table 26: Brazil Tamper Proof Seal Volume (K) Forecast, by Application 2020 & 2033
- Table 27: Argentina Tamper Proof Seal Revenue (undefined) Forecast, by Application 2020 & 2033
- Table 28: Argentina Tamper Proof Seal Volume (K) Forecast, by Application 2020 & 2033
- Table 29: Rest of South America Tamper Proof Seal Revenue (undefined) Forecast, by Application 2020 & 2033
- Table 30: Rest of South America Tamper Proof Seal Volume (K) Forecast, by Application 2020 & 2033
- Table 31: Global Tamper Proof Seal Revenue undefined Forecast, by Application 2020 & 2033
- Table 32: Global Tamper Proof Seal Volume K Forecast, by Application 2020 & 2033
- Table 33: Global Tamper Proof Seal Revenue undefined Forecast, by Types 2020 & 2033
- Table 34: Global Tamper Proof Seal Volume K Forecast, by Types 2020 & 2033
- Table 35: Global Tamper Proof Seal Revenue undefined Forecast, by Country 2020 & 2033
- Table 36: Global Tamper Proof Seal Volume K Forecast, by Country 2020 & 2033
- Table 37: United Kingdom Tamper Proof Seal Revenue (undefined) Forecast, by Application 2020 & 2033
- Table 38: United Kingdom Tamper Proof Seal Volume (K) Forecast, by Application 2020 & 2033
- Table 39: Germany Tamper Proof Seal Revenue (undefined) Forecast, by Application 2020 & 2033
- Table 40: Germany Tamper Proof Seal Volume (K) Forecast, by Application 2020 & 2033
- Table 41: France Tamper Proof Seal Revenue (undefined) Forecast, by Application 2020 & 2033
- Table 42: France Tamper Proof Seal Volume (K) Forecast, by Application 2020 & 2033
- Table 43: Italy Tamper Proof Seal Revenue (undefined) Forecast, by Application 2020 & 2033
- Table 44: Italy Tamper Proof Seal Volume (K) Forecast, by Application 2020 & 2033
- Table 45: Spain Tamper Proof Seal Revenue (undefined) Forecast, by Application 2020 & 2033
- Table 46: Spain Tamper Proof Seal Volume (K) Forecast, by Application 2020 & 2033
- Table 47: Russia Tamper Proof Seal Revenue (undefined) Forecast, by Application 2020 & 2033
- Table 48: Russia Tamper Proof Seal Volume (K) Forecast, by Application 2020 & 2033
- Table 49: Benelux Tamper Proof Seal Revenue (undefined) Forecast, by Application 2020 & 2033
- Table 50: Benelux Tamper Proof Seal Volume (K) Forecast, by Application 2020 & 2033
- Table 51: Nordics Tamper Proof Seal Revenue (undefined) Forecast, by Application 2020 & 2033
- Table 52: Nordics Tamper Proof Seal Volume (K) Forecast, by Application 2020 & 2033
- Table 53: Rest of Europe Tamper Proof Seal Revenue (undefined) Forecast, by Application 2020 & 2033
- Table 54: Rest of Europe Tamper Proof Seal Volume (K) Forecast, by Application 2020 & 2033
- Table 55: Global Tamper Proof Seal Revenue undefined Forecast, by Application 2020 & 2033
- Table 56: Global Tamper Proof Seal Volume K Forecast, by Application 2020 & 2033
- Table 57: Global Tamper Proof Seal Revenue undefined Forecast, by Types 2020 & 2033
- Table 58: Global Tamper Proof Seal Volume K Forecast, by Types 2020 & 2033
- Table 59: Global Tamper Proof Seal Revenue undefined Forecast, by Country 2020 & 2033
- Table 60: Global Tamper Proof Seal Volume K Forecast, by Country 2020 & 2033
- Table 61: Turkey Tamper Proof Seal Revenue (undefined) Forecast, by Application 2020 & 2033
- Table 62: Turkey Tamper Proof Seal Volume (K) Forecast, by Application 2020 & 2033
- Table 63: Israel Tamper Proof Seal Revenue (undefined) Forecast, by Application 2020 & 2033
- Table 64: Israel Tamper Proof Seal Volume (K) Forecast, by Application 2020 & 2033
- Table 65: GCC Tamper Proof Seal Revenue (undefined) Forecast, by Application 2020 & 2033
- Table 66: GCC Tamper Proof Seal Volume (K) Forecast, by Application 2020 & 2033
- Table 67: North Africa Tamper Proof Seal Revenue (undefined) Forecast, by Application 2020 & 2033
- Table 68: North Africa Tamper Proof Seal Volume (K) Forecast, by Application 2020 & 2033
- Table 69: South Africa Tamper Proof Seal Revenue (undefined) Forecast, by Application 2020 & 2033
- Table 70: South Africa Tamper Proof Seal Volume (K) Forecast, by Application 2020 & 2033
- Table 71: Rest of Middle East & Africa Tamper Proof Seal Revenue (undefined) Forecast, by Application 2020 & 2033
- Table 72: Rest of Middle East & Africa Tamper Proof Seal Volume (K) Forecast, by Application 2020 & 2033
- Table 73: Global Tamper Proof Seal Revenue undefined Forecast, by Application 2020 & 2033
- Table 74: Global Tamper Proof Seal Volume K Forecast, by Application 2020 & 2033
- Table 75: Global Tamper Proof Seal Revenue undefined Forecast, by Types 2020 & 2033
- Table 76: Global Tamper Proof Seal Volume K Forecast, by Types 2020 & 2033
- Table 77: Global Tamper Proof Seal Revenue undefined Forecast, by Country 2020 & 2033
- Table 78: Global Tamper Proof Seal Volume K Forecast, by Country 2020 & 2033
- Table 79: China Tamper Proof Seal Revenue (undefined) Forecast, by Application 2020 & 2033
- Table 80: China Tamper Proof Seal Volume (K) Forecast, by Application 2020 & 2033
- Table 81: India Tamper Proof Seal Revenue (undefined) Forecast, by Application 2020 & 2033
- Table 82: India Tamper Proof Seal Volume (K) Forecast, by Application 2020 & 2033
- Table 83: Japan Tamper Proof Seal Revenue (undefined) Forecast, by Application 2020 & 2033
- Table 84: Japan Tamper Proof Seal Volume (K) Forecast, by Application 2020 & 2033
- Table 85: South Korea Tamper Proof Seal Revenue (undefined) Forecast, by Application 2020 & 2033
- Table 86: South Korea Tamper Proof Seal Volume (K) Forecast, by Application 2020 & 2033
- Table 87: ASEAN Tamper Proof Seal Revenue (undefined) Forecast, by Application 2020 & 2033
- Table 88: ASEAN Tamper Proof Seal Volume (K) Forecast, by Application 2020 & 2033
- Table 89: Oceania Tamper Proof Seal Revenue (undefined) Forecast, by Application 2020 & 2033
- Table 90: Oceania Tamper Proof Seal Volume (K) Forecast, by Application 2020 & 2033
- Table 91: Rest of Asia Pacific Tamper Proof Seal Revenue (undefined) Forecast, by Application 2020 & 2033
- Table 92: Rest of Asia Pacific Tamper Proof Seal Volume (K) Forecast, by Application 2020 & 2033
Frequently Asked Questions
1. What is the projected Compound Annual Growth Rate (CAGR) of the Tamper Proof Seal?
The projected CAGR is approximately 6.85%.
2. Which companies are prominent players in the Tamper Proof Seal?
Key companies in the market include Hoefon Security Seals, Unisto S.A., Tydenbrooks, Universeal (UK) Ltd., Cambridge Security Seals LLC, United Security Seals Inc., Yongjia Ourseal Security Seals Co., Ltd., GCSEAL, Precintia, Acme Seals, Mega Fortris Group, American Casting & Manufacturing, LeghornGroup, Lions Security Seal Ltd.
3. What are the main segments of the Tamper Proof Seal?
The market segments include Application, Types.
4. Can you provide details about the market size?
The market size is estimated to be USD XXX N/A as of 2022.
5. What are some drivers contributing to market growth?
N/A
6. What are the notable trends driving market growth?
N/A
7. Are there any restraints impacting market growth?
N/A
8. Can you provide examples of recent developments in the market?
N/A
9. What pricing options are available for accessing the report?
Pricing options include single-user, multi-user, and enterprise licenses priced at USD 3350.00, USD 5025.00, and USD 6700.00 respectively.
10. Is the market size provided in terms of value or volume?
The market size is provided in terms of value, measured in N/A and volume, measured in K.
11. Are there any specific market keywords associated with the report?
Yes, the market keyword associated with the report is "Tamper Proof Seal," which aids in identifying and referencing the specific market segment covered.
12. How do I determine which pricing option suits my needs best?
The pricing options vary based on user requirements and access needs. Individual users may opt for single-user licenses, while businesses requiring broader access may choose multi-user or enterprise licenses for cost-effective access to the report.
13. Are there any additional resources or data provided in the Tamper Proof Seal report?
While the report offers comprehensive insights, it's advisable to review the specific contents or supplementary materials provided to ascertain if additional resources or data are available.
14. How can I stay updated on further developments or reports in the Tamper Proof Seal?
To stay informed about further developments, trends, and reports in the Tamper Proof Seal, consider subscribing to industry newsletters, following relevant companies and organizations, or regularly checking reputable industry news sources and publications.
Methodology
Step 1 - Identification of Relevant Samples Size from Population Database


Step 2 - Approaches for Defining Global Market Size (Value, Volume* & Price*)

Note*: In applicable scenarios
Step 3 - Data Sources
Primary Research
- Web Analytics
- Survey Reports
- Research Institute
- Latest Research Reports
- Opinion Leaders
Secondary Research
- Annual Reports
- White Paper
- Latest Press Release
- Industry Association
- Paid Database
- Investor Presentations

Step 4 - Data Triangulation
Involves using different sources of information in order to increase the validity of a study
These sources are likely to be stakeholders in a program - participants, other researchers, program staff, other community members, and so on.
Then we put all data in single framework & apply various statistical tools to find out the dynamic on the market.
During the analysis stage, feedback from the stakeholder groups would be compared to determine areas of agreement as well as areas of divergence