

Key Insights
The United Kingdom's smart grid network sector is poised for substantial expansion, propelled by government mandates for decarbonization and enhanced grid resilience. With a projected market size of 66.1 billion in 2024, and a compound annual growth rate (CAGR) of 15.49%, the market is expected to witness significant development through 2033. Key growth catalysts include the increasing integration of renewable energy sources, the imperative for sophisticated grid management to accommodate intermittent power, and the widespread adoption of smart metering and demand-response systems. Advanced Metering Infrastructure (AMI) is a particularly dynamic segment, driven by its capacity to deliver real-time energy consumption data, thereby facilitating superior grid optimization and energy efficiency strategies. Government incentives and regulations supporting energy efficiency and smart grid deployment further amplify this growth trajectory. Despite challenges such as substantial initial investment requirements for infrastructure modernization and the critical need for robust cybersecurity, the enduring advantages of a more intelligent and resilient grid framework underscore its long-term value. The market is characterized by intense competition, with established industry leaders and specialized smart grid solution providers actively seeking market dominance. Geographically, the UK market exhibits a balanced distribution across England, Wales, Scotland, and Northern Ireland, reflecting a unified national strategy for smart grid advancement.
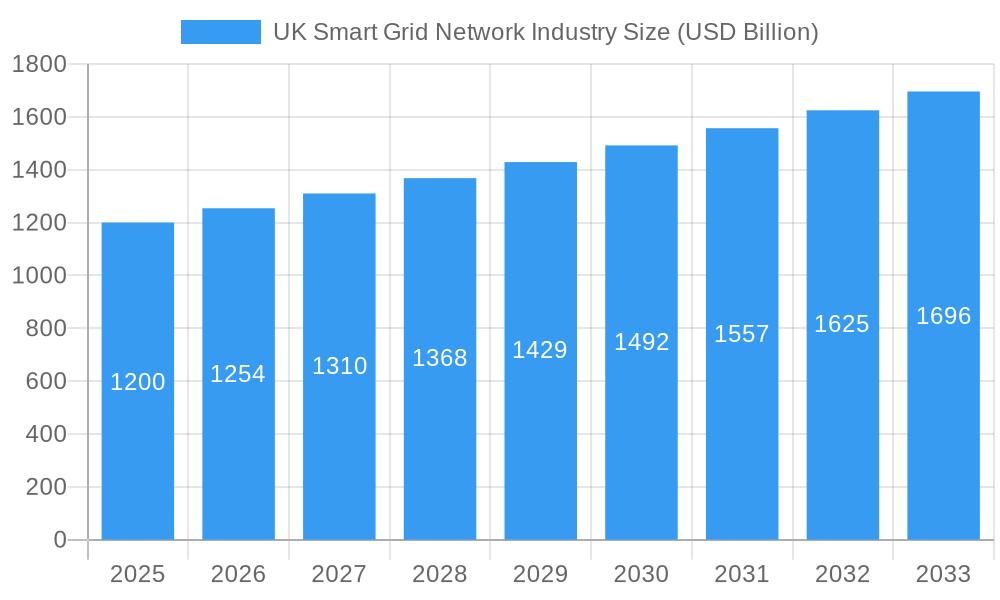
UK Smart Grid Network Industry Market Size (In Billion)
The forecast period (2024-2033) anticipates a sustained upward trajectory, largely fueled by the expanding implementation of advanced technologies across all market segments. The "Other Technology Application Areas" segment is expected to benefit from the integration of emerging technologies such as AI and machine learning, enabling predictive grid maintenance and enhanced optimization. The UK's forward-thinking regulatory landscape and supportive policies, coupled with escalating demand for renewable energy integration and efficient energy management, will significantly drive market expansion throughout the forecast horizon. The continuous focus on bolstering energy security and reducing carbon emissions will cement the smart grid's pivotal role in the UK's future energy infrastructure.
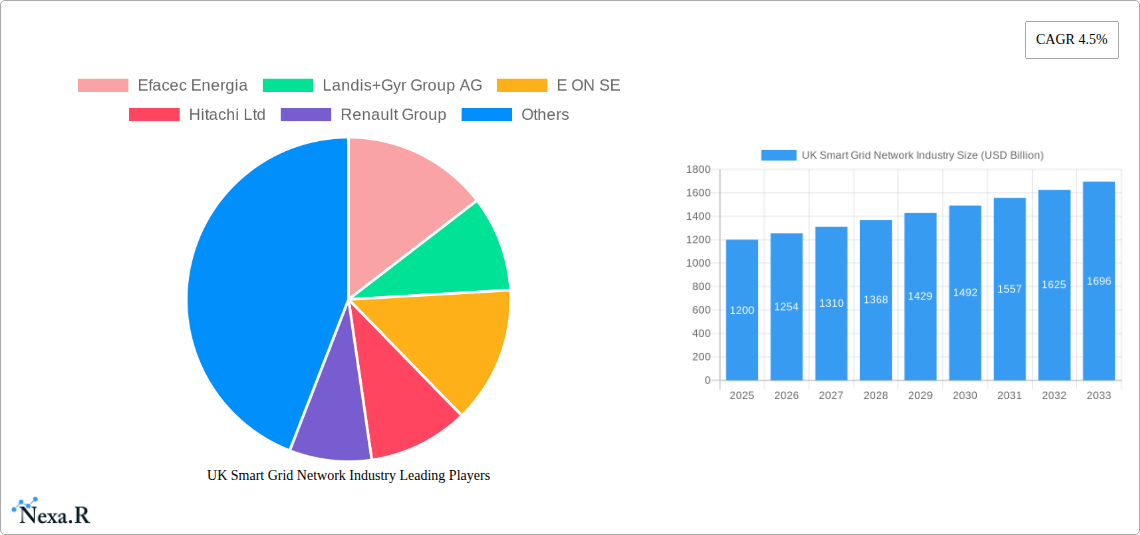
UK Smart Grid Network Industry Company Market Share
UK Smart Grid Network Industry Market Report: 2019-2033
This comprehensive report provides a detailed analysis of the UK smart grid network industry, encompassing market size, growth trends, key players, and future outlook. With a focus on the parent market (UK Energy Infrastructure) and child markets (Smart Grid Technologies), this report is an invaluable resource for industry professionals, investors, and policymakers. The study period covers 2019-2033, with a base year of 2025 and a forecast period of 2025-2033. The market value is presented in USD Billion.
UK Smart Grid Network Industry Market Dynamics & Structure
The UK smart grid network market is characterized by moderate concentration, with several major players and numerous smaller niche companies competing. Technological innovation, driven by the need for enhanced grid resilience and integration of renewable energy sources, is a primary growth driver. Stringent regulatory frameworks, including government incentives and carbon emission reduction targets, are shaping market development. Competitive product substitutes include traditional grid infrastructure, but smart grid solutions increasingly offer superior efficiency and cost-effectiveness. The end-user demographic encompasses energy providers, industrial consumers, and residential users. M&A activity has been steady, with smaller companies being acquired by larger players to expand their technological portfolios and market reach.
- Market Size (2025): $XX Billion
- Market Concentration (2025): Moderately Concentrated (e.g., top 5 players hold xx% market share)
- M&A Deal Volume (2019-2024): xx deals
- Key Innovation Barriers: High upfront investment costs, complex integration challenges, cybersecurity concerns.
UK Smart Grid Network Industry Growth Trends & Insights
The UK smart grid market exhibits robust growth, driven by increasing energy demands, the expansion of renewable energy sources, and government initiatives aimed at decarbonizing the energy sector. Adoption rates for smart grid technologies are steadily increasing, particularly in AMI and demand response segments. Technological disruptions, such as the advancement of AI and IoT in grid management, further accelerate market expansion. Shifting consumer behavior towards greater energy efficiency and sustainability reinforces market growth.
- Market Size (2019): $XX Billion
- Market Size (2024): $XX Billion
- Market Size (2033): $XX Billion
- CAGR (2025-2033): xx%
- Market Penetration (AMI, 2025): xx%
Dominant Regions, Countries, or Segments in UK Smart Grid Network Industry
The Advanced Metering Infrastructure (AMI) segment currently dominates the UK smart grid market, driven by government mandates for smart meter rollout and the need for enhanced energy monitoring and management. The transmission segment is also experiencing significant growth due to the modernization of existing infrastructure and the integration of renewable energy sources. Demand response programs are gaining traction as a cost-effective way to manage peak demand, while other technology application areas are showing promising growth potential. The South East and London regions are leading in smart grid adoption due to higher energy consumption and greater government support.
- AMI: Driven by smart meter deployments, regulatory incentives, and improved grid efficiency.
- Transmission: Driven by grid modernization, renewable energy integration, and network capacity upgrades.
- Demand Response: Driven by cost savings for consumers and energy providers, and peak demand management.
UK Smart Grid Network Industry Product Landscape
The UK smart grid market features a wide range of products, including smart meters, grid automation systems, energy storage solutions, and advanced analytics platforms. These products offer improved grid efficiency, enhanced reliability, and reduced carbon emissions. Key innovations include AI-powered grid management systems, advanced communication protocols, and distributed energy resource management platforms. Unique selling propositions include optimized energy distribution, predictive maintenance capabilities, and real-time grid monitoring.
Key Drivers, Barriers & Challenges in UK Smart Grid Network Industry
Key Drivers:
- Government regulations and incentives promoting renewable energy integration and grid modernization.
- Increased demand for reliable and efficient energy supply.
- Advancements in smart grid technologies, offering cost-effective solutions.
Key Challenges:
- High initial investment costs associated with smart grid infrastructure deployment.
- Complex integration challenges, requiring coordination across various stakeholders.
- Cybersecurity concerns related to the interconnected nature of smart grids. A potential xx% increase in cybersecurity related costs is predicted by 2033.
Emerging Opportunities in UK Smart Grid Network Industry
- Expansion of microgrids and distributed energy resources.
- Integration of AI and machine learning for predictive grid management.
- Growth of demand response programs and energy storage solutions.
- Development of innovative financing models to support smart grid deployments.
Growth Accelerators in the UK Smart Grid Network Industry
Technological breakthroughs in areas like AI and IoT are driving significant growth. Strategic partnerships between energy providers, technology companies, and government agencies are crucial. Market expansion into underserved areas and the development of tailored solutions for specific user needs contribute to long-term growth.
Key Players Shaping the UK Smart Grid Network Industry Market
Notable Milestones in UK Smart Grid Network Industry Sector
- August 2021: Reactive Technologies secured USD 15 million in funding to expand smart grid technology availability.
- November 2021: Northern Powergrid launched a EUR 2.5 million Microresilience pilot program to enhance microgrid resilience using energy storage and advanced communication technologies.
In-Depth UK Smart Grid Network Industry Market Outlook
The UK smart grid market is poised for continued strong growth, driven by the increasing need for a more resilient, efficient, and sustainable energy system. Strategic opportunities lie in the development and deployment of advanced technologies, the expansion of partnerships, and the creation of innovative business models. The future market potential is significant, with substantial investment expected in grid modernization and renewable energy integration over the forecast period.
UK Smart Grid Network Industry Segmentation
-
1. Technology Application Area
- 1.1. Transmission
- 1.2. Demand Response
- 1.3. Advanced Metering Infrastructure (AMI)
- 1.4. Other Technology Application Areas
UK Smart Grid Network Industry Segmentation By Geography
-
1. North America
- 1.1. United States
- 1.2. Canada
- 1.3. Mexico
-
2. South America
- 2.1. Brazil
- 2.2. Argentina
- 2.3. Rest of South America
-
3. Europe
- 3.1. United Kingdom
- 3.2. Germany
- 3.3. France
- 3.4. Italy
- 3.5. Spain
- 3.6. Russia
- 3.7. Benelux
- 3.8. Nordics
- 3.9. Rest of Europe
-
4. Middle East & Africa
- 4.1. Turkey
- 4.2. Israel
- 4.3. GCC
- 4.4. North Africa
- 4.5. South Africa
- 4.6. Rest of Middle East & Africa
-
5. Asia Pacific
- 5.1. China
- 5.2. India
- 5.3. Japan
- 5.4. South Korea
- 5.5. ASEAN
- 5.6. Oceania
- 5.7. Rest of Asia Pacific
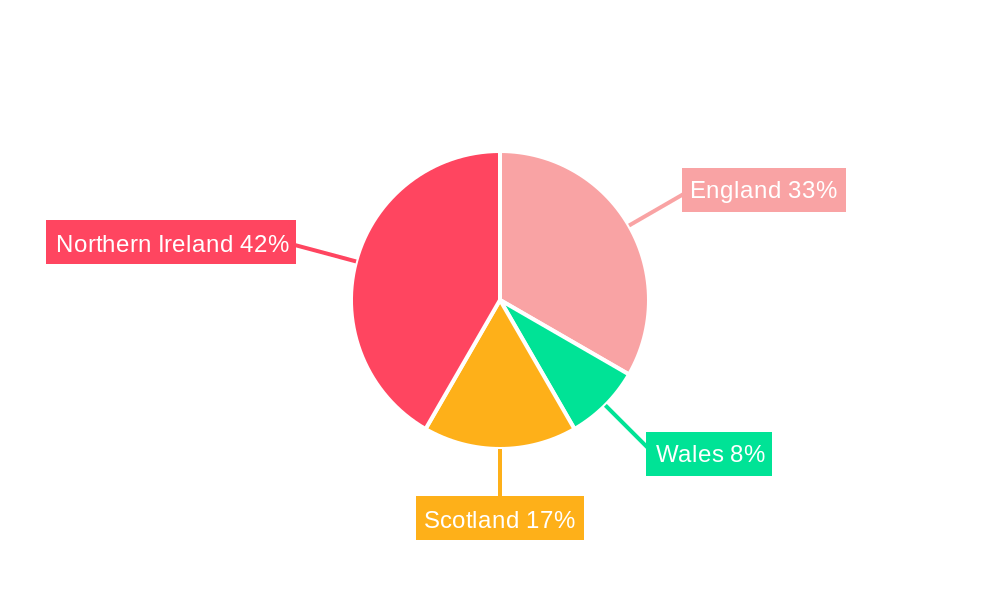
UK Smart Grid Network Industry Regional Market Share
Geographic Coverage of UK Smart Grid Network Industry
UK Smart Grid Network Industry REPORT HIGHLIGHTS
| Aspects | Details |
|---|---|
| Study Period | 2020-2034 |
| Base Year | 2025 |
| Estimated Year | 2026 |
| Forecast Period | 2026-2034 |
| Historical Period | 2020-2025 |
| Growth Rate | CAGR of 15.49% from 2020-2034 |
| Segmentation |
|
Table of Contents
- 1. Introduction
- 1.1. Research Scope
- 1.2. Market Segmentation
- 1.3. Research Methodology
- 1.4. Definitions and Assumptions
- 2. Executive Summary
- 2.1. Introduction
- 3. Market Dynamics
- 3.1. Introduction
- 3.2. Market Drivers
- 3.2.1. 4.; Supportive Government Policies in the Country4.; Rising Efforts to Decrease the Dependency on Fossil Fuels to Reduce Carbon Emissions
- 3.3. Market Restrains
- 3.3.1. 4.; Changes in Government Policies Related to Increasing VAT on Various Clean Energy Technologies
- 3.4. Market Trends
- 3.4.1. Advanced Metering Infrastructure (AMI) to Witness Significant Growth
- 4. Market Factor Analysis
- 4.1. Porters Five Forces
- 4.2. Supply/Value Chain
- 4.3. PESTEL analysis
- 4.4. Market Entropy
- 4.5. Patent/Trademark Analysis
- 5. Global UK Smart Grid Network Industry Analysis, Insights and Forecast, 2020-2032
- 5.1. Market Analysis, Insights and Forecast - by Technology Application Area
- 5.1.1. Transmission
- 5.1.2. Demand Response
- 5.1.3. Advanced Metering Infrastructure (AMI)
- 5.1.4. Other Technology Application Areas
- 5.2. Market Analysis, Insights and Forecast - by Region
- 5.2.1. North America
- 5.2.2. South America
- 5.2.3. Europe
- 5.2.4. Middle East & Africa
- 5.2.5. Asia Pacific
- 5.1. Market Analysis, Insights and Forecast - by Technology Application Area
- 6. North America UK Smart Grid Network Industry Analysis, Insights and Forecast, 2020-2032
- 6.1. Market Analysis, Insights and Forecast - by Technology Application Area
- 6.1.1. Transmission
- 6.1.2. Demand Response
- 6.1.3. Advanced Metering Infrastructure (AMI)
- 6.1.4. Other Technology Application Areas
- 6.1. Market Analysis, Insights and Forecast - by Technology Application Area
- 7. South America UK Smart Grid Network Industry Analysis, Insights and Forecast, 2020-2032
- 7.1. Market Analysis, Insights and Forecast - by Technology Application Area
- 7.1.1. Transmission
- 7.1.2. Demand Response
- 7.1.3. Advanced Metering Infrastructure (AMI)
- 7.1.4. Other Technology Application Areas
- 7.1. Market Analysis, Insights and Forecast - by Technology Application Area
- 8. Europe UK Smart Grid Network Industry Analysis, Insights and Forecast, 2020-2032
- 8.1. Market Analysis, Insights and Forecast - by Technology Application Area
- 8.1.1. Transmission
- 8.1.2. Demand Response
- 8.1.3. Advanced Metering Infrastructure (AMI)
- 8.1.4. Other Technology Application Areas
- 8.1. Market Analysis, Insights and Forecast - by Technology Application Area
- 9. Middle East & Africa UK Smart Grid Network Industry Analysis, Insights and Forecast, 2020-2032
- 9.1. Market Analysis, Insights and Forecast - by Technology Application Area
- 9.1.1. Transmission
- 9.1.2. Demand Response
- 9.1.3. Advanced Metering Infrastructure (AMI)
- 9.1.4. Other Technology Application Areas
- 9.1. Market Analysis, Insights and Forecast - by Technology Application Area
- 10. Asia Pacific UK Smart Grid Network Industry Analysis, Insights and Forecast, 2020-2032
- 10.1. Market Analysis, Insights and Forecast - by Technology Application Area
- 10.1.1. Transmission
- 10.1.2. Demand Response
- 10.1.3. Advanced Metering Infrastructure (AMI)
- 10.1.4. Other Technology Application Areas
- 10.1. Market Analysis, Insights and Forecast - by Technology Application Area
- 11. Competitive Analysis
- 11.1. Global Market Share Analysis 2025
- 11.2. Company Profiles
- 11.2.1 Efacec Energia
- 11.2.1.1. Overview
- 11.2.1.2. Products
- 11.2.1.3. SWOT Analysis
- 11.2.1.4. Recent Developments
- 11.2.1.5. Financials (Based on Availability)
- 11.2.2 Landis+Gyr Group AG
- 11.2.2.1. Overview
- 11.2.2.2. Products
- 11.2.2.3. SWOT Analysis
- 11.2.2.4. Recent Developments
- 11.2.2.5. Financials (Based on Availability)
- 11.2.3 E ON SE
- 11.2.3.1. Overview
- 11.2.3.2. Products
- 11.2.3.3. SWOT Analysis
- 11.2.3.4. Recent Developments
- 11.2.3.5. Financials (Based on Availability)
- 11.2.4 Hitachi Ltd
- 11.2.4.1. Overview
- 11.2.4.2. Products
- 11.2.4.3. SWOT Analysis
- 11.2.4.4. Recent Developments
- 11.2.4.5. Financials (Based on Availability)
- 11.2.5 Renault Group
- 11.2.5.1. Overview
- 11.2.5.2. Products
- 11.2.5.3. SWOT Analysis
- 11.2.5.4. Recent Developments
- 11.2.5.5. Financials (Based on Availability)
- 11.2.6 Siemens AG
- 11.2.6.1. Overview
- 11.2.6.2. Products
- 11.2.6.3. SWOT Analysis
- 11.2.6.4. Recent Developments
- 11.2.6.5. Financials (Based on Availability)
- 11.2.7 Schneider Electric SE
- 11.2.7.1. Overview
- 11.2.7.2. Products
- 11.2.7.3. SWOT Analysis
- 11.2.7.4. Recent Developments
- 11.2.7.5. Financials (Based on Availability)
- 11.2.8 EdF Energy
- 11.2.8.1. Overview
- 11.2.8.2. Products
- 11.2.8.3. SWOT Analysis
- 11.2.8.4. Recent Developments
- 11.2.8.5. Financials (Based on Availability)
- 11.2.9 General Electric Company*List Not Exhaustive
- 11.2.9.1. Overview
- 11.2.9.2. Products
- 11.2.9.3. SWOT Analysis
- 11.2.9.4. Recent Developments
- 11.2.9.5. Financials (Based on Availability)
- 11.2.10 ABB
- 11.2.10.1. Overview
- 11.2.10.2. Products
- 11.2.10.3. SWOT Analysis
- 11.2.10.4. Recent Developments
- 11.2.10.5. Financials (Based on Availability)
- 11.2.1 Efacec Energia
List of Figures
- Figure 1: Global UK Smart Grid Network Industry Revenue Breakdown (billion, %) by Region 2025 & 2033
- Figure 2: North America UK Smart Grid Network Industry Revenue (billion), by Technology Application Area 2025 & 2033
- Figure 3: North America UK Smart Grid Network Industry Revenue Share (%), by Technology Application Area 2025 & 2033
- Figure 4: North America UK Smart Grid Network Industry Revenue (billion), by Country 2025 & 2033
- Figure 5: North America UK Smart Grid Network Industry Revenue Share (%), by Country 2025 & 2033
- Figure 6: South America UK Smart Grid Network Industry Revenue (billion), by Technology Application Area 2025 & 2033
- Figure 7: South America UK Smart Grid Network Industry Revenue Share (%), by Technology Application Area 2025 & 2033
- Figure 8: South America UK Smart Grid Network Industry Revenue (billion), by Country 2025 & 2033
- Figure 9: South America UK Smart Grid Network Industry Revenue Share (%), by Country 2025 & 2033
- Figure 10: Europe UK Smart Grid Network Industry Revenue (billion), by Technology Application Area 2025 & 2033
- Figure 11: Europe UK Smart Grid Network Industry Revenue Share (%), by Technology Application Area 2025 & 2033
- Figure 12: Europe UK Smart Grid Network Industry Revenue (billion), by Country 2025 & 2033
- Figure 13: Europe UK Smart Grid Network Industry Revenue Share (%), by Country 2025 & 2033
- Figure 14: Middle East & Africa UK Smart Grid Network Industry Revenue (billion), by Technology Application Area 2025 & 2033
- Figure 15: Middle East & Africa UK Smart Grid Network Industry Revenue Share (%), by Technology Application Area 2025 & 2033
- Figure 16: Middle East & Africa UK Smart Grid Network Industry Revenue (billion), by Country 2025 & 2033
- Figure 17: Middle East & Africa UK Smart Grid Network Industry Revenue Share (%), by Country 2025 & 2033
- Figure 18: Asia Pacific UK Smart Grid Network Industry Revenue (billion), by Technology Application Area 2025 & 2033
- Figure 19: Asia Pacific UK Smart Grid Network Industry Revenue Share (%), by Technology Application Area 2025 & 2033
- Figure 20: Asia Pacific UK Smart Grid Network Industry Revenue (billion), by Country 2025 & 2033
- Figure 21: Asia Pacific UK Smart Grid Network Industry Revenue Share (%), by Country 2025 & 2033
List of Tables
- Table 1: Global UK Smart Grid Network Industry Revenue billion Forecast, by Technology Application Area 2020 & 2033
- Table 2: Global UK Smart Grid Network Industry Revenue billion Forecast, by Region 2020 & 2033
- Table 3: Global UK Smart Grid Network Industry Revenue billion Forecast, by Technology Application Area 2020 & 2033
- Table 4: Global UK Smart Grid Network Industry Revenue billion Forecast, by Country 2020 & 2033
- Table 5: United States UK Smart Grid Network Industry Revenue (billion) Forecast, by Application 2020 & 2033
- Table 6: Canada UK Smart Grid Network Industry Revenue (billion) Forecast, by Application 2020 & 2033
- Table 7: Mexico UK Smart Grid Network Industry Revenue (billion) Forecast, by Application 2020 & 2033
- Table 8: Global UK Smart Grid Network Industry Revenue billion Forecast, by Technology Application Area 2020 & 2033
- Table 9: Global UK Smart Grid Network Industry Revenue billion Forecast, by Country 2020 & 2033
- Table 10: Brazil UK Smart Grid Network Industry Revenue (billion) Forecast, by Application 2020 & 2033
- Table 11: Argentina UK Smart Grid Network Industry Revenue (billion) Forecast, by Application 2020 & 2033
- Table 12: Rest of South America UK Smart Grid Network Industry Revenue (billion) Forecast, by Application 2020 & 2033
- Table 13: Global UK Smart Grid Network Industry Revenue billion Forecast, by Technology Application Area 2020 & 2033
- Table 14: Global UK Smart Grid Network Industry Revenue billion Forecast, by Country 2020 & 2033
- Table 15: United Kingdom UK Smart Grid Network Industry Revenue (billion) Forecast, by Application 2020 & 2033
- Table 16: Germany UK Smart Grid Network Industry Revenue (billion) Forecast, by Application 2020 & 2033
- Table 17: France UK Smart Grid Network Industry Revenue (billion) Forecast, by Application 2020 & 2033
- Table 18: Italy UK Smart Grid Network Industry Revenue (billion) Forecast, by Application 2020 & 2033
- Table 19: Spain UK Smart Grid Network Industry Revenue (billion) Forecast, by Application 2020 & 2033
- Table 20: Russia UK Smart Grid Network Industry Revenue (billion) Forecast, by Application 2020 & 2033
- Table 21: Benelux UK Smart Grid Network Industry Revenue (billion) Forecast, by Application 2020 & 2033
- Table 22: Nordics UK Smart Grid Network Industry Revenue (billion) Forecast, by Application 2020 & 2033
- Table 23: Rest of Europe UK Smart Grid Network Industry Revenue (billion) Forecast, by Application 2020 & 2033
- Table 24: Global UK Smart Grid Network Industry Revenue billion Forecast, by Technology Application Area 2020 & 2033
- Table 25: Global UK Smart Grid Network Industry Revenue billion Forecast, by Country 2020 & 2033
- Table 26: Turkey UK Smart Grid Network Industry Revenue (billion) Forecast, by Application 2020 & 2033
- Table 27: Israel UK Smart Grid Network Industry Revenue (billion) Forecast, by Application 2020 & 2033
- Table 28: GCC UK Smart Grid Network Industry Revenue (billion) Forecast, by Application 2020 & 2033
- Table 29: North Africa UK Smart Grid Network Industry Revenue (billion) Forecast, by Application 2020 & 2033
- Table 30: South Africa UK Smart Grid Network Industry Revenue (billion) Forecast, by Application 2020 & 2033
- Table 31: Rest of Middle East & Africa UK Smart Grid Network Industry Revenue (billion) Forecast, by Application 2020 & 2033
- Table 32: Global UK Smart Grid Network Industry Revenue billion Forecast, by Technology Application Area 2020 & 2033
- Table 33: Global UK Smart Grid Network Industry Revenue billion Forecast, by Country 2020 & 2033
- Table 34: China UK Smart Grid Network Industry Revenue (billion) Forecast, by Application 2020 & 2033
- Table 35: India UK Smart Grid Network Industry Revenue (billion) Forecast, by Application 2020 & 2033
- Table 36: Japan UK Smart Grid Network Industry Revenue (billion) Forecast, by Application 2020 & 2033
- Table 37: South Korea UK Smart Grid Network Industry Revenue (billion) Forecast, by Application 2020 & 2033
- Table 38: ASEAN UK Smart Grid Network Industry Revenue (billion) Forecast, by Application 2020 & 2033
- Table 39: Oceania UK Smart Grid Network Industry Revenue (billion) Forecast, by Application 2020 & 2033
- Table 40: Rest of Asia Pacific UK Smart Grid Network Industry Revenue (billion) Forecast, by Application 2020 & 2033
Frequently Asked Questions
1. What is the projected Compound Annual Growth Rate (CAGR) of the UK Smart Grid Network Industry?
The projected CAGR is approximately 15.49%.
2. Which companies are prominent players in the UK Smart Grid Network Industry?
Key companies in the market include Efacec Energia, Landis+Gyr Group AG, E ON SE, Hitachi Ltd, Renault Group, Siemens AG, Schneider Electric SE, EdF Energy, General Electric Company*List Not Exhaustive, ABB.
3. What are the main segments of the UK Smart Grid Network Industry?
The market segments include Technology Application Area.
4. Can you provide details about the market size?
The market size is estimated to be USD 66.1 billion as of 2022.
5. What are some drivers contributing to market growth?
4.; Supportive Government Policies in the Country4.; Rising Efforts to Decrease the Dependency on Fossil Fuels to Reduce Carbon Emissions.
6. What are the notable trends driving market growth?
Advanced Metering Infrastructure (AMI) to Witness Significant Growth.
7. Are there any restraints impacting market growth?
4.; Changes in Government Policies Related to Increasing VAT on Various Clean Energy Technologies.
8. Can you provide examples of recent developments in the market?
In August 2021, Reactive Technologies raised USD 15 million in new funding round. Reactive Technologies intends to use the funding, its largest in a single round till 2022, to make its smart grid technology more widely available.
9. What pricing options are available for accessing the report?
Pricing options include single-user, multi-user, and enterprise licenses priced at USD 3800, USD 4500, and USD 5800 respectively.
10. Is the market size provided in terms of value or volume?
The market size is provided in terms of value, measured in billion.
11. Are there any specific market keywords associated with the report?
Yes, the market keyword associated with the report is "UK Smart Grid Network Industry," which aids in identifying and referencing the specific market segment covered.
12. How do I determine which pricing option suits my needs best?
The pricing options vary based on user requirements and access needs. Individual users may opt for single-user licenses, while businesses requiring broader access may choose multi-user or enterprise licenses for cost-effective access to the report.
13. Are there any additional resources or data provided in the UK Smart Grid Network Industry report?
While the report offers comprehensive insights, it's advisable to review the specific contents or supplementary materials provided to ascertain if additional resources or data are available.
14. How can I stay updated on further developments or reports in the UK Smart Grid Network Industry?
To stay informed about further developments, trends, and reports in the UK Smart Grid Network Industry, consider subscribing to industry newsletters, following relevant companies and organizations, or regularly checking reputable industry news sources and publications.
Methodology
Step 1 - Identification of Relevant Samples Size from Population Database


Step 2 - Approaches for Defining Global Market Size (Value, Volume* & Price*)

Note*: In applicable scenarios
Step 3 - Data Sources
Primary Research
- Web Analytics
- Survey Reports
- Research Institute
- Latest Research Reports
- Opinion Leaders
Secondary Research
- Annual Reports
- White Paper
- Latest Press Release
- Industry Association
- Paid Database
- Investor Presentations

Step 4 - Data Triangulation
Involves using different sources of information in order to increase the validity of a study
These sources are likely to be stakeholders in a program - participants, other researchers, program staff, other community members, and so on.
Then we put all data in single framework & apply various statistical tools to find out the dynamic on the market.
During the analysis stage, feedback from the stakeholder groups would be compared to determine areas of agreement as well as areas of divergence