

Key Insights
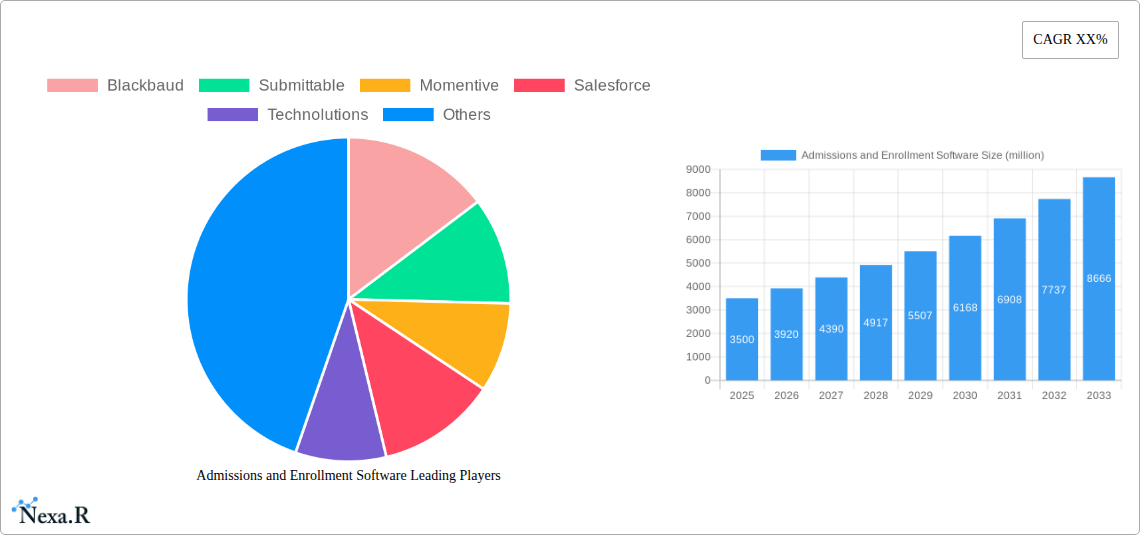
The global Admissions and Enrollment Software market is poised for substantial growth, projected to reach an estimated $3,500 million by 2025, with a robust Compound Annual Growth Rate (CAGR) of 15% over the forecast period of 2025-2033. This expansion is fueled by the increasing adoption of digital solutions across educational institutions, from K-12 schools to universities, to streamline complex admission processes. The shift towards cloud-based solutions, offering greater scalability, accessibility, and cost-effectiveness, is a significant driver, outshining on-premises alternatives. Educational institutions are increasingly recognizing the value of these platforms in enhancing student experience, improving recruitment efficiency, and optimizing resource allocation. The market's dynamism is further propelled by the need for sophisticated tools to manage application tracking, applicant communication, data analytics, and enrollment forecasting. This digital transformation is critical for institutions aiming to attract and retain a diverse student body in a competitive global landscape.
The market's growth trajectory is further supported by key trends such as the integration of AI and machine learning for personalized applicant engagement and predictive enrollment analytics. Furthermore, the demand for comprehensive student lifecycle management solutions, encompassing admissions, enrollment, and even retention, is on the rise. However, potential restraints include the initial investment costs associated with implementing new software, data security concerns, and the need for effective staff training to ensure widespread adoption and utilization. Despite these challenges, the overarching benefits of improved operational efficiency, enhanced data-driven decision-making, and a superior applicant experience are compelling institutions to invest in admissions and enrollment software. Key players like PowerSchool, Ellucian, and Salesforce are continually innovating, offering advanced features and cloud-native solutions to cater to the evolving needs of the education sector. The Asia Pacific region is expected to witness the fastest growth due to rapid digitalization and a burgeoning student population.
This in-depth report provides a critical analysis of the global Admissions and Enrollment Software market, a sector poised for significant expansion driven by the digital transformation of educational institutions worldwide. From K-12 to university settings, institutions are increasingly relying on sophisticated software solutions to streamline admissions processes, enhance student engagement, and optimize enrollment strategies. This report will delve into the intricate market dynamics, growth trends, regional dominance, product innovations, and key players that are shaping this vital industry.
Admissions and Enrollment Software Market Dynamics & Structure
The Admissions and Enrollment Software market is characterized by a dynamic interplay of technological innovation, evolving regulatory landscapes, and a highly competitive vendor ecosystem. Market concentration, while present, is balanced by the emergence of niche players and specialized solutions catering to distinct educational segments. Key drivers of technological innovation include the demand for personalized student experiences, the need for robust data analytics for informed decision-making, and the increasing adoption of AI and machine learning to automate tasks and predict enrollment trends. Regulatory frameworks, particularly concerning data privacy and security, are also playing a crucial role in shaping product development and implementation strategies. Competitive product substitutes, ranging from in-house developed systems to broader CRM solutions with admissions modules, present a continuous challenge for dedicated admissions software vendors. End-user demographics are diversifying, with a growing emphasis on non-traditional students and global recruitment efforts. Mergers and acquisitions (M&A) trends are actively reshaping the market, with larger entities acquiring innovative startups to expand their product portfolios and market reach. For instance, the base year of 2025 is projected to see a significant volume of M&A deals, estimated at approximately 15-20 transactions, with an average deal value of $50 million to $200 million.
- Market Concentration: Moderately concentrated, with a mix of large established vendors and agile smaller players.
- Technological Innovation Drivers: AI-powered application review, predictive analytics for student success, personalized communication platforms, and seamless integration with learning management systems.
- Regulatory Frameworks: Emphasis on GDPR, FERPA, and other data privacy regulations influencing data handling and security protocols.
- Competitive Product Substitutes: General CRM solutions, custom-built internal systems, and specialized point solutions for specific enrollment functions.
- End-User Demographics: K-12 institutions, public and private universities, community colleges, and online learning platforms.
- M&A Trends: Increased consolidation and strategic acquisitions to gain market share and access new technologies, with an estimated M&A deal volume of 15-20 transactions in the base year of 2025, totaling an estimated $1.5 billion to $4 billion in transaction value.
Admissions and Enrollment Software Growth Trends & Insights
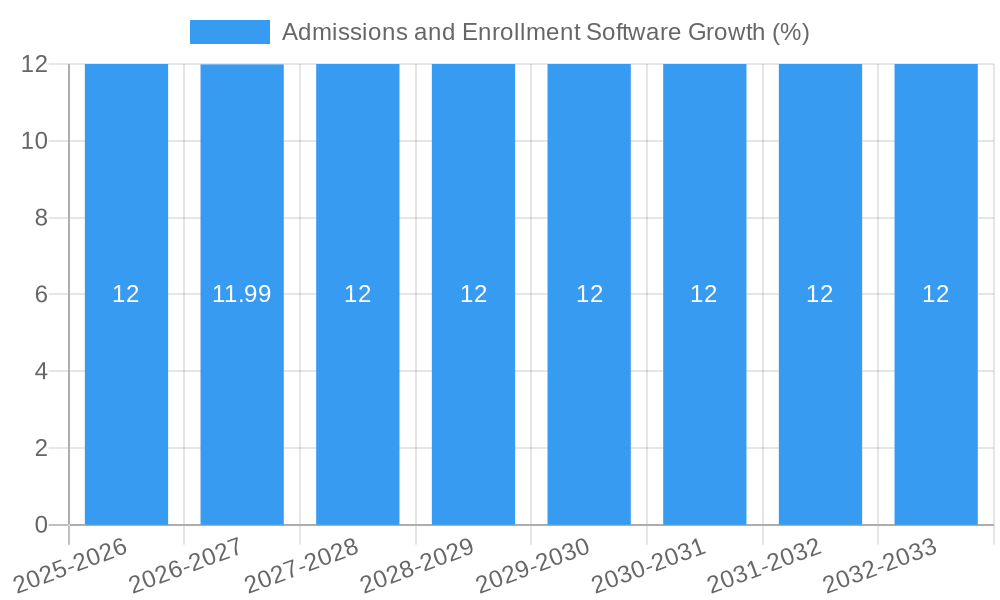
The Admissions and Enrollment Software market is experiencing robust growth, driven by the imperative for educational institutions to adapt to a rapidly changing educational landscape. The market size is projected to witness a Compound Annual Growth Rate (CAGR) of approximately 12.5% during the forecast period of 2025–2033, escalating from an estimated $5.8 billion in 2025 to over $15.5 billion by 2033. This expansion is fueled by escalating adoption rates across both K-12 and university sectors, as institutions recognize the critical role of efficient and data-driven admissions and enrollment management. Technological disruptions, such as the integration of AI for personalized outreach and automated application processing, are fundamentally altering how institutions attract, admit, and retain students. Furthermore, shifts in consumer behavior, including the growing preference for digital application pathways and transparent communication, are compelling institutions to invest in user-friendly and accessible software solutions. The historical period (2019–2024) laid the groundwork, with a CAGR of approximately 10.2%, showcasing a steady upward trajectory. The base year of 2025 is expected to see a market penetration of around 65% among target institutions, indicating significant room for further growth.
The increasing emphasis on student retention and alumni engagement is also a significant growth catalyst. Admissions and enrollment software is no longer solely focused on the initial entry point but is evolving into a comprehensive student lifecycle management tool. This includes features for onboarding, advising, financial aid management, and even post-graduation engagement, contributing to a more holistic approach to student success. The digital native generation entering higher education expects seamless online experiences, pushing institutions to adopt cloud-based solutions that offer scalability, accessibility, and enhanced user interfaces. The global nature of education also plays a role, with institutions increasingly looking to attract international students, requiring sophisticated platforms that can manage diverse application requirements and communication channels. The COVID-19 pandemic acted as an unprecedented accelerant, forcing many institutions to rapidly adopt digital solutions for remote admissions processes, a trend that has largely persisted. This has democratized access to admissions software, making it a more indispensable tool for institutions of all sizes. The market is also witnessing a growing demand for analytics dashboards that provide real-time insights into application funnels, conversion rates, and demographic trends, enabling institutions to make data-informed strategic decisions.
Dominant Regions, Countries, or Segments in Admissions and Enrollment Software
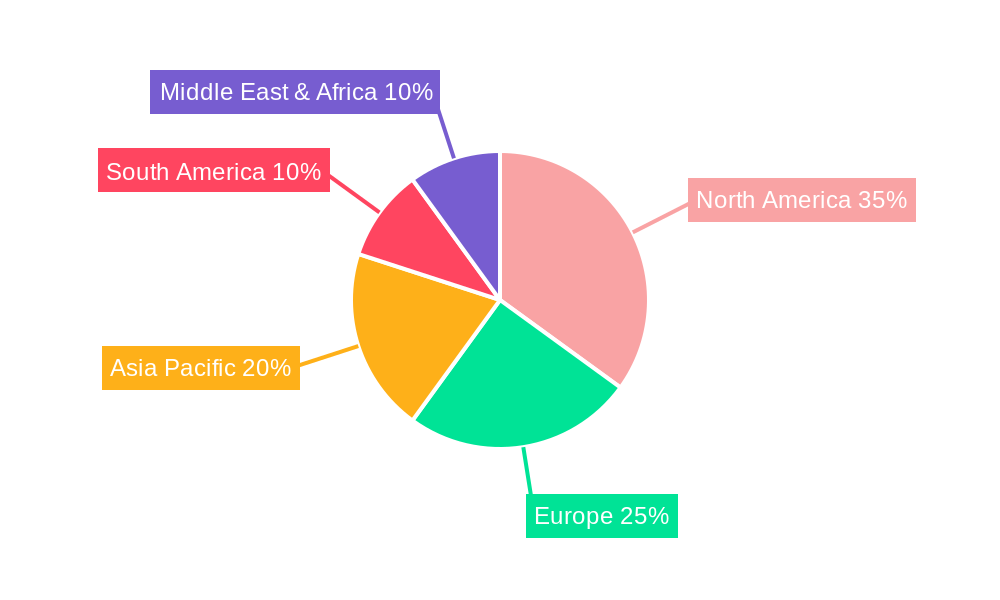
The North American region currently dominates the Admissions and Enrollment Software market, driven by a mature educational infrastructure, substantial investments in educational technology, and a strong demand for sophisticated student management solutions. Within North America, the United States stands out as the leading country, benefiting from a large number of higher education institutions and a highly competitive admissions landscape that necessitates advanced software. The University segment within the application types is a primary driver of market growth, accounting for an estimated 70% of the total market share in 2025. This dominance is attributed to the complex and often multi-stage application processes involved in university admissions, including undergraduate, graduate, and professional programs.
The Cloud-Based type of deployment model is rapidly gaining traction and is projected to capture an overwhelming majority of the market share, estimated at over 85% by 2025, surpassing on-premises solutions. This shift is propelled by the inherent advantages of cloud technology, including scalability, flexibility, cost-effectiveness, and ease of access, which are particularly appealing to educational institutions managing vast amounts of student data. Economic policies in North America, such as government initiatives supporting educational technology adoption and research, further bolster the market. The robust IT infrastructure and high digital literacy rates among educational administrators and students also contribute to the region's leading position.
The market share for the University segment is estimated at $4.2 billion in 2025, with a projected CAGR of 13.0% through 2033. The Cloud-Based segment is valued at an estimated $4.9 billion in 2025 and is expected to grow at a CAGR of 14.5% during the same period. Key drivers for the dominance of the University segment include the increasing number of international student applications, the need for personalized recruitment strategies, and the adoption of advanced analytics for student success prediction. The preference for cloud-based solutions is fueled by the desire for reduced IT overhead, enhanced data security, and seamless integration with other academic systems. While Europe and Asia-Pacific are showing promising growth, North America's established ecosystem and continuous innovation will likely maintain its lead throughout the forecast period.
Admissions and Enrollment Software Product Landscape
The Admissions and Enrollment Software product landscape is characterized by continuous innovation, focusing on delivering intelligent, intuitive, and integrated solutions. Key product innovations include AI-powered predictive analytics for identifying at-risk applicants and optimizing recruitment efforts, blockchain technology for secure and verifiable credential management, and advanced CRM capabilities for personalized student communication and engagement. Performance metrics such as increased application conversion rates (estimated at 15-20% improvement with effective software), reduced administrative workload (estimated 25-30% reduction), and enhanced student satisfaction are key indicators of product success. Unique selling propositions often revolve around the software's ability to streamline complex workflows, provide real-time data insights, and offer a seamless user experience for both administrators and prospective students.
Key Drivers, Barriers & Challenges in Admissions and Enrollment Software
Key Drivers:
- Digital Transformation Mandate: Educational institutions are compelled to modernize their operations for efficiency and competitiveness.
- Demand for Personalized Student Journeys: Software enabling tailored communication and experiences is highly sought after.
- Data Analytics for Strategic Decision-Making: Institutions require robust tools to analyze applicant data and predict enrollment trends.
- Globalization of Education: The need to attract and manage international students drives demand for comprehensive platforms.
- Cost Optimization: Cloud-based solutions offer scalability and reduced IT infrastructure costs.
Barriers & Challenges:
- Implementation Complexity and Cost: Integrating new software can be time-consuming and require significant financial investment, estimated at $50,000 to $500,000 for large universities.
- Data Security and Privacy Concerns: Maintaining compliance with evolving regulations (e.g., GDPR, FERPA) is paramount.
- Resistance to Change: Overcoming institutional inertia and securing buy-in from stakeholders can be challenging.
- Interoperability Issues: Ensuring seamless integration with existing legacy systems can be a significant hurdle.
- Vendor Lock-in: Concerns about long-term dependencies on a single software provider.
- Cybersecurity Threats: The risk of data breaches necessitates continuous investment in security measures, with estimated annual cybersecurity spending for educational institutions in this sector ranging from $10,000 to $100,000.
Emerging Opportunities in Admissions and Enrollment Software
Emerging opportunities in the Admissions and Enrollment Software market are centered around leveraging advanced technologies and catering to evolving educational models. The integration of AI-driven chatbots for instant applicant support and virtual campus tours presents a significant opportunity for enhanced engagement. The growing demand for micro-credentials and lifelong learning programs requires software that can manage diverse application pathways and enrollment for non-traditional students. Furthermore, the expansion of online and hybrid learning models necessitates flexible and scalable solutions that can cater to a geographically dispersed student body. The use of gamification in the application process to increase applicant engagement and the development of sophisticated alumni relationship management (ARM) modules are also promising avenues for growth.
Growth Accelerators in the Admissions and Enrollment Software Industry
Several catalysts are accelerating growth in the Admissions and Enrollment Software industry. Technological breakthroughs in areas like natural language processing (NLP) are enabling more intelligent application review and communication. Strategic partnerships between software vendors and educational institutions are fostering the development of tailored solutions that meet specific institutional needs. Market expansion strategies, including a focus on emerging economies and underserved educational sectors, are opening new revenue streams. The continuous drive for operational efficiency and improved student outcomes remains a fundamental growth accelerator, pushing institutions to adopt best-in-class software.
Key Players Shaping the Admissions and Enrollment Software Market
- Blackbaud
- Submittable
- Momentive
- Salesforce
- Technolutions
- Finalsite
- PowerSchool
- Liaison Software
- GoSignMeUp
- Community Brands
- Ellucian
- iSAMS
Notable Milestones in Admissions and Enrollment Software Sector
- 2019: Launch of AI-powered admissions analytics by major vendors, enhancing predictive capabilities.
- 2020: Accelerated adoption of cloud-based solutions due to the global pandemic, driving significant market shift.
- 2021: Increased focus on data privacy and security features, with vendors investing heavily in compliance.
- 2022: Introduction of advanced CRM functionalities for personalized student outreach and engagement.
- 2023: Emergence of integrated platforms combining admissions, financial aid, and student success modules.
- 2024: Growing adoption of AI-driven conversational agents for prospective student inquiries, projected to reach 30% of inquiries handled by these agents.
In-Depth Admissions and Enrollment Software Market Outlook
The future outlook for the Admissions and Enrollment Software market is exceptionally bright, driven by sustained digital transformation and the evolving needs of educational institutions. Growth accelerators such as advancements in AI and machine learning will continue to enhance the intelligence and automation capabilities of these platforms. Strategic partnerships and market expansion into emerging regions will unlock new opportunities for vendors. The persistent demand for improved student experiences, operational efficiency, and data-driven decision-making ensures that admissions and enrollment software will remain a critical investment for educational institutions globally, with the market projected to exceed $15.5 billion by 2033.
Admissions and Enrollment Software Segmentation
-
1. Application
- 1.1. K-12
- 1.2. University
-
2. Types
- 2.1. Cloud Based
- 2.2. On-premises
Admissions and Enrollment Software Segmentation By Geography
-
1. North America
- 1.1. United States
- 1.2. Canada
- 1.3. Mexico
-
2. South America
- 2.1. Brazil
- 2.2. Argentina
- 2.3. Rest of South America
-
3. Europe
- 3.1. United Kingdom
- 3.2. Germany
- 3.3. France
- 3.4. Italy
- 3.5. Spain
- 3.6. Russia
- 3.7. Benelux
- 3.8. Nordics
- 3.9. Rest of Europe
-
4. Middle East & Africa
- 4.1. Turkey
- 4.2. Israel
- 4.3. GCC
- 4.4. North Africa
- 4.5. South Africa
- 4.6. Rest of Middle East & Africa
-
5. Asia Pacific
- 5.1. China
- 5.2. India
- 5.3. Japan
- 5.4. South Korea
- 5.5. ASEAN
- 5.6. Oceania
- 5.7. Rest of Asia Pacific
Admissions and Enrollment Software REPORT HIGHLIGHTS
| Aspects | Details |
|---|---|
| Study Period | 2019-2033 |
| Base Year | 2024 |
| Estimated Year | 2025 |
| Forecast Period | 2025-2033 |
| Historical Period | 2019-2024 |
| Growth Rate | CAGR of XX% from 2019-2033 |
| Segmentation |
|
Table of Contents
- 1. Introduction
- 1.1. Research Scope
- 1.2. Market Segmentation
- 1.3. Research Methodology
- 1.4. Definitions and Assumptions
- 2. Executive Summary
- 2.1. Introduction
- 3. Market Dynamics
- 3.1. Introduction
- 3.2. Market Drivers
- 3.3. Market Restrains
- 3.4. Market Trends
- 4. Market Factor Analysis
- 4.1. Porters Five Forces
- 4.2. Supply/Value Chain
- 4.3. PESTEL analysis
- 4.4. Market Entropy
- 4.5. Patent/Trademark Analysis
- 5. Global Admissions and Enrollment Software Analysis, Insights and Forecast, 2019-2031
- 5.1. Market Analysis, Insights and Forecast - by Application
- 5.1.1. K-12
- 5.1.2. University
- 5.2. Market Analysis, Insights and Forecast - by Types
- 5.2.1. Cloud Based
- 5.2.2. On-premises
- 5.3. Market Analysis, Insights and Forecast - by Region
- 5.3.1. North America
- 5.3.2. South America
- 5.3.3. Europe
- 5.3.4. Middle East & Africa
- 5.3.5. Asia Pacific
- 5.1. Market Analysis, Insights and Forecast - by Application
- 6. North America Admissions and Enrollment Software Analysis, Insights and Forecast, 2019-2031
- 6.1. Market Analysis, Insights and Forecast - by Application
- 6.1.1. K-12
- 6.1.2. University
- 6.2. Market Analysis, Insights and Forecast - by Types
- 6.2.1. Cloud Based
- 6.2.2. On-premises
- 6.1. Market Analysis, Insights and Forecast - by Application
- 7. South America Admissions and Enrollment Software Analysis, Insights and Forecast, 2019-2031
- 7.1. Market Analysis, Insights and Forecast - by Application
- 7.1.1. K-12
- 7.1.2. University
- 7.2. Market Analysis, Insights and Forecast - by Types
- 7.2.1. Cloud Based
- 7.2.2. On-premises
- 7.1. Market Analysis, Insights and Forecast - by Application
- 8. Europe Admissions and Enrollment Software Analysis, Insights and Forecast, 2019-2031
- 8.1. Market Analysis, Insights and Forecast - by Application
- 8.1.1. K-12
- 8.1.2. University
- 8.2. Market Analysis, Insights and Forecast - by Types
- 8.2.1. Cloud Based
- 8.2.2. On-premises
- 8.1. Market Analysis, Insights and Forecast - by Application
- 9. Middle East & Africa Admissions and Enrollment Software Analysis, Insights and Forecast, 2019-2031
- 9.1. Market Analysis, Insights and Forecast - by Application
- 9.1.1. K-12
- 9.1.2. University
- 9.2. Market Analysis, Insights and Forecast - by Types
- 9.2.1. Cloud Based
- 9.2.2. On-premises
- 9.1. Market Analysis, Insights and Forecast - by Application
- 10. Asia Pacific Admissions and Enrollment Software Analysis, Insights and Forecast, 2019-2031
- 10.1. Market Analysis, Insights and Forecast - by Application
- 10.1.1. K-12
- 10.1.2. University
- 10.2. Market Analysis, Insights and Forecast - by Types
- 10.2.1. Cloud Based
- 10.2.2. On-premises
- 10.1. Market Analysis, Insights and Forecast - by Application
- 11. Competitive Analysis
- 11.1. Global Market Share Analysis 2024
- 11.2. Company Profiles
- 11.2.1 Blackbaud
- 11.2.1.1. Overview
- 11.2.1.2. Products
- 11.2.1.3. SWOT Analysis
- 11.2.1.4. Recent Developments
- 11.2.1.5. Financials (Based on Availability)
- 11.2.2 Submittable
- 11.2.2.1. Overview
- 11.2.2.2. Products
- 11.2.2.3. SWOT Analysis
- 11.2.2.4. Recent Developments
- 11.2.2.5. Financials (Based on Availability)
- 11.2.3 Momentive
- 11.2.3.1. Overview
- 11.2.3.2. Products
- 11.2.3.3. SWOT Analysis
- 11.2.3.4. Recent Developments
- 11.2.3.5. Financials (Based on Availability)
- 11.2.4 Salesforce
- 11.2.4.1. Overview
- 11.2.4.2. Products
- 11.2.4.3. SWOT Analysis
- 11.2.4.4. Recent Developments
- 11.2.4.5. Financials (Based on Availability)
- 11.2.5 Technolutions
- 11.2.5.1. Overview
- 11.2.5.2. Products
- 11.2.5.3. SWOT Analysis
- 11.2.5.4. Recent Developments
- 11.2.5.5. Financials (Based on Availability)
- 11.2.6 Finalsite
- 11.2.6.1. Overview
- 11.2.6.2. Products
- 11.2.6.3. SWOT Analysis
- 11.2.6.4. Recent Developments
- 11.2.6.5. Financials (Based on Availability)
- 11.2.7 PowerSchool
- 11.2.7.1. Overview
- 11.2.7.2. Products
- 11.2.7.3. SWOT Analysis
- 11.2.7.4. Recent Developments
- 11.2.7.5. Financials (Based on Availability)
- 11.2.8 Liaison Software
- 11.2.8.1. Overview
- 11.2.8.2. Products
- 11.2.8.3. SWOT Analysis
- 11.2.8.4. Recent Developments
- 11.2.8.5. Financials (Based on Availability)
- 11.2.9 GoSignMeUp
- 11.2.9.1. Overview
- 11.2.9.2. Products
- 11.2.9.3. SWOT Analysis
- 11.2.9.4. Recent Developments
- 11.2.9.5. Financials (Based on Availability)
- 11.2.10 Community Brands
- 11.2.10.1. Overview
- 11.2.10.2. Products
- 11.2.10.3. SWOT Analysis
- 11.2.10.4. Recent Developments
- 11.2.10.5. Financials (Based on Availability)
- 11.2.11 Ellucian
- 11.2.11.1. Overview
- 11.2.11.2. Products
- 11.2.11.3. SWOT Analysis
- 11.2.11.4. Recent Developments
- 11.2.11.5. Financials (Based on Availability)
- 11.2.12 iSAMS
- 11.2.12.1. Overview
- 11.2.12.2. Products
- 11.2.12.3. SWOT Analysis
- 11.2.12.4. Recent Developments
- 11.2.12.5. Financials (Based on Availability)
- 11.2.1 Blackbaud
List of Figures
- Figure 1: Global Admissions and Enrollment Software Revenue Breakdown (million, %) by Region 2024 & 2032
- Figure 2: North America Admissions and Enrollment Software Revenue (million), by Application 2024 & 2032
- Figure 3: North America Admissions and Enrollment Software Revenue Share (%), by Application 2024 & 2032
- Figure 4: North America Admissions and Enrollment Software Revenue (million), by Types 2024 & 2032
- Figure 5: North America Admissions and Enrollment Software Revenue Share (%), by Types 2024 & 2032
- Figure 6: North America Admissions and Enrollment Software Revenue (million), by Country 2024 & 2032
- Figure 7: North America Admissions and Enrollment Software Revenue Share (%), by Country 2024 & 2032
- Figure 8: South America Admissions and Enrollment Software Revenue (million), by Application 2024 & 2032
- Figure 9: South America Admissions and Enrollment Software Revenue Share (%), by Application 2024 & 2032
- Figure 10: South America Admissions and Enrollment Software Revenue (million), by Types 2024 & 2032
- Figure 11: South America Admissions and Enrollment Software Revenue Share (%), by Types 2024 & 2032
- Figure 12: South America Admissions and Enrollment Software Revenue (million), by Country 2024 & 2032
- Figure 13: South America Admissions and Enrollment Software Revenue Share (%), by Country 2024 & 2032
- Figure 14: Europe Admissions and Enrollment Software Revenue (million), by Application 2024 & 2032
- Figure 15: Europe Admissions and Enrollment Software Revenue Share (%), by Application 2024 & 2032
- Figure 16: Europe Admissions and Enrollment Software Revenue (million), by Types 2024 & 2032
- Figure 17: Europe Admissions and Enrollment Software Revenue Share (%), by Types 2024 & 2032
- Figure 18: Europe Admissions and Enrollment Software Revenue (million), by Country 2024 & 2032
- Figure 19: Europe Admissions and Enrollment Software Revenue Share (%), by Country 2024 & 2032
- Figure 20: Middle East & Africa Admissions and Enrollment Software Revenue (million), by Application 2024 & 2032
- Figure 21: Middle East & Africa Admissions and Enrollment Software Revenue Share (%), by Application 2024 & 2032
- Figure 22: Middle East & Africa Admissions and Enrollment Software Revenue (million), by Types 2024 & 2032
- Figure 23: Middle East & Africa Admissions and Enrollment Software Revenue Share (%), by Types 2024 & 2032
- Figure 24: Middle East & Africa Admissions and Enrollment Software Revenue (million), by Country 2024 & 2032
- Figure 25: Middle East & Africa Admissions and Enrollment Software Revenue Share (%), by Country 2024 & 2032
- Figure 26: Asia Pacific Admissions and Enrollment Software Revenue (million), by Application 2024 & 2032
- Figure 27: Asia Pacific Admissions and Enrollment Software Revenue Share (%), by Application 2024 & 2032
- Figure 28: Asia Pacific Admissions and Enrollment Software Revenue (million), by Types 2024 & 2032
- Figure 29: Asia Pacific Admissions and Enrollment Software Revenue Share (%), by Types 2024 & 2032
- Figure 30: Asia Pacific Admissions and Enrollment Software Revenue (million), by Country 2024 & 2032
- Figure 31: Asia Pacific Admissions and Enrollment Software Revenue Share (%), by Country 2024 & 2032
List of Tables
- Table 1: Global Admissions and Enrollment Software Revenue million Forecast, by Region 2019 & 2032
- Table 2: Global Admissions and Enrollment Software Revenue million Forecast, by Application 2019 & 2032
- Table 3: Global Admissions and Enrollment Software Revenue million Forecast, by Types 2019 & 2032
- Table 4: Global Admissions and Enrollment Software Revenue million Forecast, by Region 2019 & 2032
- Table 5: Global Admissions and Enrollment Software Revenue million Forecast, by Application 2019 & 2032
- Table 6: Global Admissions and Enrollment Software Revenue million Forecast, by Types 2019 & 2032
- Table 7: Global Admissions and Enrollment Software Revenue million Forecast, by Country 2019 & 2032
- Table 8: United States Admissions and Enrollment Software Revenue (million) Forecast, by Application 2019 & 2032
- Table 9: Canada Admissions and Enrollment Software Revenue (million) Forecast, by Application 2019 & 2032
- Table 10: Mexico Admissions and Enrollment Software Revenue (million) Forecast, by Application 2019 & 2032
- Table 11: Global Admissions and Enrollment Software Revenue million Forecast, by Application 2019 & 2032
- Table 12: Global Admissions and Enrollment Software Revenue million Forecast, by Types 2019 & 2032
- Table 13: Global Admissions and Enrollment Software Revenue million Forecast, by Country 2019 & 2032
- Table 14: Brazil Admissions and Enrollment Software Revenue (million) Forecast, by Application 2019 & 2032
- Table 15: Argentina Admissions and Enrollment Software Revenue (million) Forecast, by Application 2019 & 2032
- Table 16: Rest of South America Admissions and Enrollment Software Revenue (million) Forecast, by Application 2019 & 2032
- Table 17: Global Admissions and Enrollment Software Revenue million Forecast, by Application 2019 & 2032
- Table 18: Global Admissions and Enrollment Software Revenue million Forecast, by Types 2019 & 2032
- Table 19: Global Admissions and Enrollment Software Revenue million Forecast, by Country 2019 & 2032
- Table 20: United Kingdom Admissions and Enrollment Software Revenue (million) Forecast, by Application 2019 & 2032
- Table 21: Germany Admissions and Enrollment Software Revenue (million) Forecast, by Application 2019 & 2032
- Table 22: France Admissions and Enrollment Software Revenue (million) Forecast, by Application 2019 & 2032
- Table 23: Italy Admissions and Enrollment Software Revenue (million) Forecast, by Application 2019 & 2032
- Table 24: Spain Admissions and Enrollment Software Revenue (million) Forecast, by Application 2019 & 2032
- Table 25: Russia Admissions and Enrollment Software Revenue (million) Forecast, by Application 2019 & 2032
- Table 26: Benelux Admissions and Enrollment Software Revenue (million) Forecast, by Application 2019 & 2032
- Table 27: Nordics Admissions and Enrollment Software Revenue (million) Forecast, by Application 2019 & 2032
- Table 28: Rest of Europe Admissions and Enrollment Software Revenue (million) Forecast, by Application 2019 & 2032
- Table 29: Global Admissions and Enrollment Software Revenue million Forecast, by Application 2019 & 2032
- Table 30: Global Admissions and Enrollment Software Revenue million Forecast, by Types 2019 & 2032
- Table 31: Global Admissions and Enrollment Software Revenue million Forecast, by Country 2019 & 2032
- Table 32: Turkey Admissions and Enrollment Software Revenue (million) Forecast, by Application 2019 & 2032
- Table 33: Israel Admissions and Enrollment Software Revenue (million) Forecast, by Application 2019 & 2032
- Table 34: GCC Admissions and Enrollment Software Revenue (million) Forecast, by Application 2019 & 2032
- Table 35: North Africa Admissions and Enrollment Software Revenue (million) Forecast, by Application 2019 & 2032
- Table 36: South Africa Admissions and Enrollment Software Revenue (million) Forecast, by Application 2019 & 2032
- Table 37: Rest of Middle East & Africa Admissions and Enrollment Software Revenue (million) Forecast, by Application 2019 & 2032
- Table 38: Global Admissions and Enrollment Software Revenue million Forecast, by Application 2019 & 2032
- Table 39: Global Admissions and Enrollment Software Revenue million Forecast, by Types 2019 & 2032
- Table 40: Global Admissions and Enrollment Software Revenue million Forecast, by Country 2019 & 2032
- Table 41: China Admissions and Enrollment Software Revenue (million) Forecast, by Application 2019 & 2032
- Table 42: India Admissions and Enrollment Software Revenue (million) Forecast, by Application 2019 & 2032
- Table 43: Japan Admissions and Enrollment Software Revenue (million) Forecast, by Application 2019 & 2032
- Table 44: South Korea Admissions and Enrollment Software Revenue (million) Forecast, by Application 2019 & 2032
- Table 45: ASEAN Admissions and Enrollment Software Revenue (million) Forecast, by Application 2019 & 2032
- Table 46: Oceania Admissions and Enrollment Software Revenue (million) Forecast, by Application 2019 & 2032
- Table 47: Rest of Asia Pacific Admissions and Enrollment Software Revenue (million) Forecast, by Application 2019 & 2032
Frequently Asked Questions
1. What is the projected Compound Annual Growth Rate (CAGR) of the Admissions and Enrollment Software?
The projected CAGR is approximately XX%.
2. Which companies are prominent players in the Admissions and Enrollment Software?
Key companies in the market include Blackbaud, Submittable, Momentive, Salesforce, Technolutions, Finalsite, PowerSchool, Liaison Software, GoSignMeUp, Community Brands, Ellucian, iSAMS.
3. What are the main segments of the Admissions and Enrollment Software?
The market segments include Application, Types.
4. Can you provide details about the market size?
The market size is estimated to be USD XXX million as of 2022.
5. What are some drivers contributing to market growth?
N/A
6. What are the notable trends driving market growth?
N/A
7. Are there any restraints impacting market growth?
N/A
8. Can you provide examples of recent developments in the market?
N/A
9. What pricing options are available for accessing the report?
Pricing options include single-user, multi-user, and enterprise licenses priced at USD 3950.00, USD 5925.00, and USD 7900.00 respectively.
10. Is the market size provided in terms of value or volume?
The market size is provided in terms of value, measured in million.
11. Are there any specific market keywords associated with the report?
Yes, the market keyword associated with the report is "Admissions and Enrollment Software," which aids in identifying and referencing the specific market segment covered.
12. How do I determine which pricing option suits my needs best?
The pricing options vary based on user requirements and access needs. Individual users may opt for single-user licenses, while businesses requiring broader access may choose multi-user or enterprise licenses for cost-effective access to the report.
13. Are there any additional resources or data provided in the Admissions and Enrollment Software report?
While the report offers comprehensive insights, it's advisable to review the specific contents or supplementary materials provided to ascertain if additional resources or data are available.
14. How can I stay updated on further developments or reports in the Admissions and Enrollment Software?
To stay informed about further developments, trends, and reports in the Admissions and Enrollment Software, consider subscribing to industry newsletters, following relevant companies and organizations, or regularly checking reputable industry news sources and publications.
Methodology
Step 1 - Identification of Relevant Samples Size from Population Database


Step 2 - Approaches for Defining Global Market Size (Value, Volume* & Price*)

Note*: In applicable scenarios
Step 3 - Data Sources
Primary Research
- Web Analytics
- Survey Reports
- Research Institute
- Latest Research Reports
- Opinion Leaders
Secondary Research
- Annual Reports
- White Paper
- Latest Press Release
- Industry Association
- Paid Database
- Investor Presentations

Step 4 - Data Triangulation
Involves using different sources of information in order to increase the validity of a study
These sources are likely to be stakeholders in a program - participants, other researchers, program staff, other community members, and so on.
Then we put all data in single framework & apply various statistical tools to find out the dynamic on the market.
During the analysis stage, feedback from the stakeholder groups would be compared to determine areas of agreement as well as areas of divergence
