

Key Insights
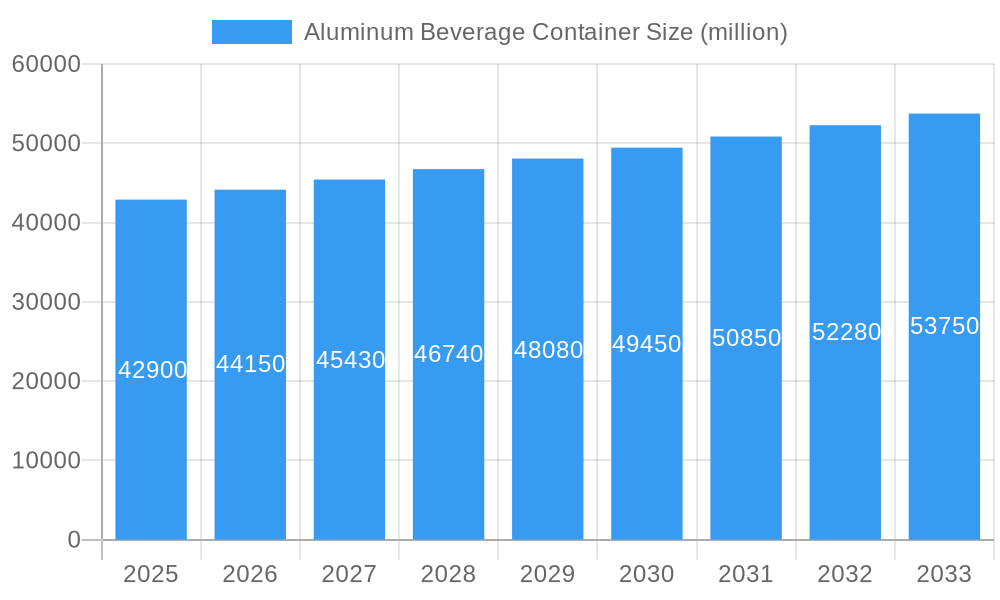
The global Aluminum Beverage Container market is poised for steady growth, with an estimated market size of approximately USD 42.9 billion in 2025. This growth is projected to continue at a Compound Annual Growth Rate (CAGR) of 2.9% through 2033, indicating a robust and sustained demand for these versatile packaging solutions. The primary drivers fueling this expansion are the increasing global consumption of beverages, particularly carbonated drinks and beer, coupled with a growing consumer preference for sustainable and recyclable packaging options. Aluminum cans offer a compelling eco-friendly alternative to plastics, aligning with evolving environmental regulations and corporate sustainability goals. Furthermore, advancements in can manufacturing technologies, such as the widespread adoption of Drawn and Wall Ironed (DWI) cans, contribute to enhanced product integrity and cost-effectiveness, further stimulating market penetration.
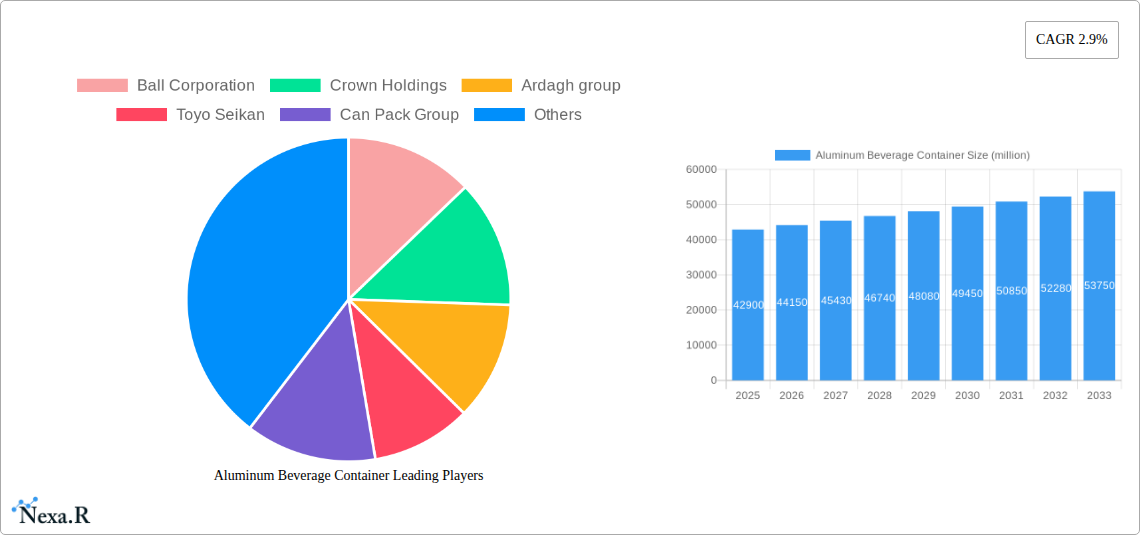
Aluminum Beverage Container Market Size (In Billion)
The market exhibits a clear segmentation across various applications and types. Beer and carbonated drinks represent the dominant application segments, benefiting from the convenience and portability offered by aluminum cans. Within the type segment, both Draw and Redraw (DRD) and Drawn and Wall Ironed (DWI) cans hold significant market share, catering to diverse product requirements and manufacturing processes. The competitive landscape is characterized by the presence of major global players like Ball Corporation, Crown Holdings, and Ardagh Group, alongside significant regional manufacturers. These companies are actively engaged in innovation, focusing on lightweighting initiatives, enhanced barrier properties, and attractive branding to capture market share. Geographically, the Asia Pacific region, driven by rapidly growing economies like China and India, is expected to be a key growth engine, while established markets in North America and Europe will continue to contribute substantially to overall market value.
Aluminum Beverage Container Company Market Share
This in-depth report provides a definitive analysis of the global Aluminum Beverage Container market, offering critical insights for stakeholders seeking to navigate this dynamic industry. Spanning a study period of 2019–2033, with a base and estimated year of 2025 and a forecast period of 2025–2033, this report meticulously examines historical trends, current dynamics, and future projections. We present data in million units for clarity and actionable insights.
Aluminum Beverage Container Market Dynamics & Structure
The global Aluminum Beverage Container market is characterized by a moderate to high concentration, with key players like Ball Corporation, Crown Holdings, and Ardagh Group holding significant market shares. Technological innovation is a pivotal driver, with advancements in can manufacturing processes, lightweighting initiatives, and enhanced recyclability technologies continually shaping the competitive landscape. Regulatory frameworks, particularly those focusing on sustainability and recycling targets, are increasingly influencing market growth and product development. While aluminum beverage containers boast a strong recyclability profile, they face competitive pressure from other packaging materials such as glass, PET, and novel bio-based alternatives. End-user demographics are shifting towards younger, environmentally conscious consumers who prioritize sustainable packaging solutions. Mergers and acquisitions (M&A) remain an active area, with strategic consolidation aimed at expanding market reach, securing raw material supply, and enhancing technological capabilities. For instance, the historical period (2019-2024) witnessed approximately 8 major M&A deals with an estimated combined transaction value of over $5,000 million units, indicating a strategic consolidation trend. Innovation barriers primarily stem from the capital-intensive nature of advanced manufacturing technologies and the need for consistent quality and supply chain stability.
Aluminum Beverage Container Growth Trends & Insights
The global Aluminum Beverage Container market is poised for robust growth, driven by an escalating demand for convenient and sustainable packaging solutions. The market size is projected to expand significantly from an estimated 250,000 million units in 2025 to reach approximately 350,000 million units by 2033, exhibiting a Compound Annual Growth Rate (CAGR) of 4.5% during the forecast period. Adoption rates for aluminum beverage containers are on an upward trajectory, propelled by increasing beverage consumption across various categories, particularly carbonated drinks and beer. Technological disruptions, such as advancements in energy-efficient production methods and the development of thinner yet stronger aluminum alloys, are further enhancing the market's appeal. Consumer behavior shifts are playing a crucial role, with a growing preference for recyclable and eco-friendly packaging. This trend is particularly evident in developed economies where environmental awareness is high. The perceived premium quality and enhanced shelf life offered by aluminum cans also contribute to their adoption. Furthermore, the beverage industry's increasing focus on brand differentiation and visual appeal is driving innovation in can design, printing, and finishing, making aluminum an attractive choice for marketers. The market penetration of aluminum beverage containers is expected to rise from an estimated 65% in 2025 to over 75% by 2033 within the target beverage segments. The increasing disposable income in emerging economies also presents a significant opportunity for market expansion, as more consumers gain access to a wider range of packaged beverages. The convenience factor associated with lightweight and durable aluminum cans further solidifies their position in the rapidly evolving beverage packaging landscape.
Dominant Regions, Countries, or Segments in Aluminum Beverage Container
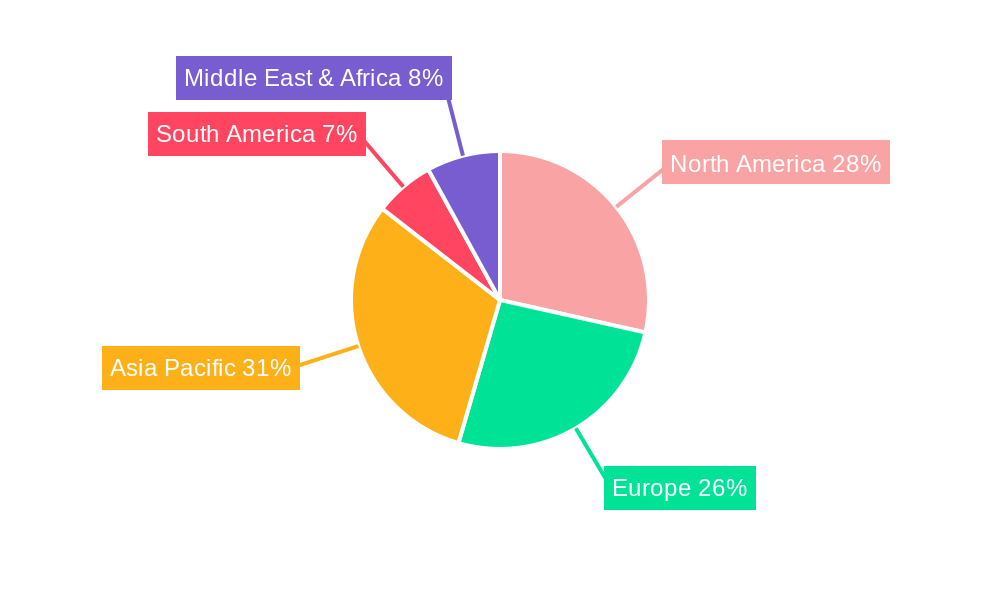
North America currently dominates the global Aluminum Beverage Container market, driven by established beverage industries, strong consumer demand for beer and carbonated drinks, and robust recycling infrastructure. The United States, in particular, accounts for a substantial portion of this regional dominance, with major beverage manufacturers consistently opting for aluminum packaging. The application segment of Carbonated Drinks leads the market, fueled by the immense popularity of sodas, sparkling water, and energy drinks. This segment is projected to command a market share of approximately 45% of the total aluminum beverage container market in 2025, valued at an estimated 112,500 million units. The Beer segment is another significant contributor, expected to hold around 35% of the market in 2025, translating to an estimated 87,500 million units. The “Others” category, encompassing juices, teas, and functional beverages, is also witnessing steady growth, driven by evolving consumer preferences for healthier and diverse beverage options.
From a technological perspective, DWI (Drawn and Wall Ironed) Cans represent the dominant type, accounting for an estimated 80% of the market in 2025, valued at approximately 200,000 million units. This is attributed to their cost-effectiveness, superior strength-to-weight ratio, and suitability for high-speed filling lines. DRD (Draw and Redraw) cans, while still relevant for certain niche applications, hold a smaller market share. Key drivers for North America's dominance include supportive government policies encouraging recycling and the circular economy, significant investments in advanced manufacturing technologies by leading players like Ball Corporation and Crown Holdings, and high per capita consumption of packaged beverages. The region's well-developed supply chains and widespread availability of aluminum raw materials further bolster its leading position. The projected growth potential in Asia-Pacific, particularly China and India, presents a significant opportunity for market expansion in the coming years. However, North America's established infrastructure and consumer loyalty to aluminum packaging are expected to maintain its leading position through the forecast period.
Aluminum Beverage Container Product Landscape
The Aluminum Beverage Container market is defined by continuous innovation aimed at enhancing sustainability, functionality, and consumer appeal. Key product innovations include advancements in lightweighting technologies, reducing the amount of aluminum required per can without compromising structural integrity, and the development of advanced barrier coatings that improve product shelf life and taste preservation. Specialty can formats, such as sleek cans and slim cans, are gaining traction for premium and craft beverages, offering unique aesthetic appeal. Furthermore, the integration of smart packaging features, like QR codes for enhanced consumer engagement and traceability, is emerging. Performance metrics are consistently optimized, focusing on recyclability, energy efficiency in production, and reduced carbon footprint throughout the lifecycle. Unique selling propositions revolve around aluminum's inherent recyclability, its ability to provide a 100% light and oxygen barrier, and its premium feel.
Key Drivers, Barriers & Challenges in Aluminum Beverage Container
Key Drivers:
- Environmental Sustainability: Growing consumer and regulatory demand for recyclable and eco-friendly packaging solutions.
- Beverage Consumption Growth: Increasing global consumption of beer, carbonated drinks, and other beverages.
- Lightweighting Initiatives: Technological advancements leading to lighter and more resource-efficient cans.
- Brand Premiumization: Aluminum's perceived premium quality enhances brand image and shelf appeal.
- Recycling Infrastructure Development: Expansion and improvement of recycling programs globally.
Key Barriers & Challenges:
- Raw Material Price Volatility: Fluctuations in aluminum prices can impact production costs and profitability.
- Competition from Alternatives: Intense competition from PET, glass, and newer sustainable packaging materials.
- Energy-Intensive Production: The aluminum production process is energy-intensive, posing environmental concerns.
- Supply Chain Disruptions: Global events can impact the availability and cost of raw materials and finished goods.
- Lobbying by Competitors: Efforts by rival packaging material industries to influence consumer perception and policy.
Emerging Opportunities in Aluminum Beverage Container
Emerging opportunities in the Aluminum Beverage Container market lie in the expansion of its application into less traditional beverage segments, such as still water, dairy-based beverages, and ready-to-drink (RTD) cocktails, where its barrier properties and premium appeal can be leveraged. The growing demand for smaller, single-serve portions in emerging economies presents a significant market for compact aluminum cans. Furthermore, innovations in printing and finishing technologies are creating new avenues for unique branding and enhanced consumer engagement. The increasing focus on the circular economy is also driving opportunities for closed-loop recycling systems and the development of advanced recycling technologies to further improve the environmental footprint of aluminum beverage containers.
Growth Accelerators in the Aluminum Beverage Container Industry
Several catalysts are accelerating the growth of the Aluminum Beverage Container industry. Technological breakthroughs in can manufacturing, leading to higher speeds and reduced energy consumption, are improving operational efficiency. Strategic partnerships between aluminum producers, can manufacturers, and beverage brands are fostering innovation and market penetration. For instance, collaborations focused on developing fully recycled aluminum cans are gaining momentum. Market expansion strategies targeting developing economies, where the demand for packaged beverages is rapidly increasing, are also crucial growth drivers. The industry's proactive engagement in advocating for favorable recycling policies and its commitment to sustainability are further solidifying its long-term growth trajectory.
Key Players Shaping the Aluminum Beverage Container Market
- Ball Corporation
- Crown Holdings
- Ardagh Group
- Toyo Seikan
- Can Pack Group
- Silgan Holdings Inc
- Daiwa Can Company
- Baosteel Packaging
- ORG Technology
- ShengXing Group
- CPMC Holdings
- Hokkan Holdings
- Showa Aluminum Can Corporation
- United Can (Great China Metal)
- Kingcan Holdings
- Jiamei Food Packaging
- Jiyuan Packaging Holdings
Notable Milestones in Aluminum Beverage Container Sector
- 2019: Ball Corporation launches a new lightweighting technology, reducing can weight by an estimated 5% across its product lines.
- 2020: Crown Holdings acquires a significant portion of Signode Industrial Group's packaging assets, expanding its global footprint.
- 2021: Ardagh Group announces a €2 billion investment in sustainability initiatives and new production facilities.
- 2022: The Aluminum Association releases updated recycling statistics, showing an increase in aluminum can recycling rates to XX%.
- 2023: Toyo Seikan develops a new 100% recycled aluminum can prototype for high-end beverages.
- 2024: Can Pack Group partners with a major beverage brand to introduce a new line of visually striking, decorated aluminum cans.
In-Depth Aluminum Beverage Container Market Outlook
The Aluminum Beverage Container market is set for continued expansion, driven by an unwavering commitment to sustainability and evolving consumer preferences. Growth accelerators such as advancements in lightweighting technologies, the increasing adoption of recycled aluminum content, and strategic market expansion into emerging economies will fuel future growth. The industry's ability to innovate in can design, functionality, and recycling processes will be pivotal in maintaining its competitive edge. Future market potential is substantial, with opportunities arising from the expanding RTD beverage sector and the growing demand for environmentally responsible packaging solutions. Strategic collaborations and a focus on circular economy principles will define the path forward for a robust and sustainable Aluminum Beverage Container industry.
Aluminum Beverage Container Segmentation
-
1. Application
- 1.1. Beer
- 1.2. Carbonated Drinks
- 1.3. Others
- 1.4. Beer
- 1.5. Carbonated Drinks
- 1.6. Others
-
2. Type
- 2.1. DRD (Draw and Redraw) Cans
- 2.2. DWI (Drawn and Wall Ironed) Cans
- 2.3. DRD (Draw and Redraw) Cans
- 2.4. DWI (Drawn and Wall Ironed) Cans
Aluminum Beverage Container Segmentation By Geography
-
1. North America
- 1.1. United States
- 1.2. Canada
- 1.3. Mexico
-
2. South America
- 2.1. Brazil
- 2.2. Argentina
- 2.3. Rest of South America
-
3. Europe
- 3.1. United Kingdom
- 3.2. Germany
- 3.3. France
- 3.4. Italy
- 3.5. Spain
- 3.6. Russia
- 3.7. Benelux
- 3.8. Nordics
- 3.9. Rest of Europe
-
4. Middle East & Africa
- 4.1. Turkey
- 4.2. Israel
- 4.3. GCC
- 4.4. North Africa
- 4.5. South Africa
- 4.6. Rest of Middle East & Africa
-
5. Asia Pacific
- 5.1. China
- 5.2. India
- 5.3. Japan
- 5.4. South Korea
- 5.5. ASEAN
- 5.6. Oceania
- 5.7. Rest of Asia Pacific
Aluminum Beverage Container Regional Market Share
Geographic Coverage of Aluminum Beverage Container
Aluminum Beverage Container REPORT HIGHLIGHTS
| Aspects | Details |
|---|---|
| Study Period | 2020-2034 |
| Base Year | 2025 |
| Estimated Year | 2026 |
| Forecast Period | 2026-2034 |
| Historical Period | 2020-2025 |
| Growth Rate | CAGR of 5.9% from 2020-2034 |
| Segmentation |
|
Table of Contents
- 1. Introduction
- 1.1. Research Scope
- 1.2. Market Segmentation
- 1.3. Research Methodology
- 1.4. Definitions and Assumptions
- 2. Executive Summary
- 2.1. Introduction
- 3. Market Dynamics
- 3.1. Introduction
- 3.2. Market Drivers
- 3.3. Market Restrains
- 3.4. Market Trends
- 4. Market Factor Analysis
- 4.1. Porters Five Forces
- 4.2. Supply/Value Chain
- 4.3. PESTEL analysis
- 4.4. Market Entropy
- 4.5. Patent/Trademark Analysis
- 5. Global Aluminum Beverage Container Analysis, Insights and Forecast, 2020-2032
- 5.1. Market Analysis, Insights and Forecast - by Application
- 5.1.1. Beer
- 5.1.2. Carbonated Drinks
- 5.1.3. Others
- 5.1.4. Beer
- 5.1.5. Carbonated Drinks
- 5.1.6. Others
- 5.2. Market Analysis, Insights and Forecast - by Type
- 5.2.1. DRD (Draw and Redraw) Cans
- 5.2.2. DWI (Drawn and Wall Ironed) Cans
- 5.2.3. DRD (Draw and Redraw) Cans
- 5.2.4. DWI (Drawn and Wall Ironed) Cans
- 5.3. Market Analysis, Insights and Forecast - by Region
- 5.3.1. North America
- 5.3.2. South America
- 5.3.3. Europe
- 5.3.4. Middle East & Africa
- 5.3.5. Asia Pacific
- 5.1. Market Analysis, Insights and Forecast - by Application
- 6. North America Aluminum Beverage Container Analysis, Insights and Forecast, 2020-2032
- 6.1. Market Analysis, Insights and Forecast - by Application
- 6.1.1. Beer
- 6.1.2. Carbonated Drinks
- 6.1.3. Others
- 6.1.4. Beer
- 6.1.5. Carbonated Drinks
- 6.1.6. Others
- 6.2. Market Analysis, Insights and Forecast - by Type
- 6.2.1. DRD (Draw and Redraw) Cans
- 6.2.2. DWI (Drawn and Wall Ironed) Cans
- 6.2.3. DRD (Draw and Redraw) Cans
- 6.2.4. DWI (Drawn and Wall Ironed) Cans
- 6.1. Market Analysis, Insights and Forecast - by Application
- 7. South America Aluminum Beverage Container Analysis, Insights and Forecast, 2020-2032
- 7.1. Market Analysis, Insights and Forecast - by Application
- 7.1.1. Beer
- 7.1.2. Carbonated Drinks
- 7.1.3. Others
- 7.1.4. Beer
- 7.1.5. Carbonated Drinks
- 7.1.6. Others
- 7.2. Market Analysis, Insights and Forecast - by Type
- 7.2.1. DRD (Draw and Redraw) Cans
- 7.2.2. DWI (Drawn and Wall Ironed) Cans
- 7.2.3. DRD (Draw and Redraw) Cans
- 7.2.4. DWI (Drawn and Wall Ironed) Cans
- 7.1. Market Analysis, Insights and Forecast - by Application
- 8. Europe Aluminum Beverage Container Analysis, Insights and Forecast, 2020-2032
- 8.1. Market Analysis, Insights and Forecast - by Application
- 8.1.1. Beer
- 8.1.2. Carbonated Drinks
- 8.1.3. Others
- 8.1.4. Beer
- 8.1.5. Carbonated Drinks
- 8.1.6. Others
- 8.2. Market Analysis, Insights and Forecast - by Type
- 8.2.1. DRD (Draw and Redraw) Cans
- 8.2.2. DWI (Drawn and Wall Ironed) Cans
- 8.2.3. DRD (Draw and Redraw) Cans
- 8.2.4. DWI (Drawn and Wall Ironed) Cans
- 8.1. Market Analysis, Insights and Forecast - by Application
- 9. Middle East & Africa Aluminum Beverage Container Analysis, Insights and Forecast, 2020-2032
- 9.1. Market Analysis, Insights and Forecast - by Application
- 9.1.1. Beer
- 9.1.2. Carbonated Drinks
- 9.1.3. Others
- 9.1.4. Beer
- 9.1.5. Carbonated Drinks
- 9.1.6. Others
- 9.2. Market Analysis, Insights and Forecast - by Type
- 9.2.1. DRD (Draw and Redraw) Cans
- 9.2.2. DWI (Drawn and Wall Ironed) Cans
- 9.2.3. DRD (Draw and Redraw) Cans
- 9.2.4. DWI (Drawn and Wall Ironed) Cans
- 9.1. Market Analysis, Insights and Forecast - by Application
- 10. Asia Pacific Aluminum Beverage Container Analysis, Insights and Forecast, 2020-2032
- 10.1. Market Analysis, Insights and Forecast - by Application
- 10.1.1. Beer
- 10.1.2. Carbonated Drinks
- 10.1.3. Others
- 10.1.4. Beer
- 10.1.5. Carbonated Drinks
- 10.1.6. Others
- 10.2. Market Analysis, Insights and Forecast - by Type
- 10.2.1. DRD (Draw and Redraw) Cans
- 10.2.2. DWI (Drawn and Wall Ironed) Cans
- 10.2.3. DRD (Draw and Redraw) Cans
- 10.2.4. DWI (Drawn and Wall Ironed) Cans
- 10.1. Market Analysis, Insights and Forecast - by Application
- 11. Competitive Analysis
- 11.1. Global Market Share Analysis 2025
- 11.2. Company Profiles
- 11.2.1 Ball Corporation
- 11.2.1.1. Overview
- 11.2.1.2. Products
- 11.2.1.3. SWOT Analysis
- 11.2.1.4. Recent Developments
- 11.2.1.5. Financials (Based on Availability)
- 11.2.2 Crown Holdings
- 11.2.2.1. Overview
- 11.2.2.2. Products
- 11.2.2.3. SWOT Analysis
- 11.2.2.4. Recent Developments
- 11.2.2.5. Financials (Based on Availability)
- 11.2.3 Ardagh group
- 11.2.3.1. Overview
- 11.2.3.2. Products
- 11.2.3.3. SWOT Analysis
- 11.2.3.4. Recent Developments
- 11.2.3.5. Financials (Based on Availability)
- 11.2.4 Toyo Seikan
- 11.2.4.1. Overview
- 11.2.4.2. Products
- 11.2.4.3. SWOT Analysis
- 11.2.4.4. Recent Developments
- 11.2.4.5. Financials (Based on Availability)
- 11.2.5 Can Pack Group
- 11.2.5.1. Overview
- 11.2.5.2. Products
- 11.2.5.3. SWOT Analysis
- 11.2.5.4. Recent Developments
- 11.2.5.5. Financials (Based on Availability)
- 11.2.6 Silgan Holdings Inc
- 11.2.6.1. Overview
- 11.2.6.2. Products
- 11.2.6.3. SWOT Analysis
- 11.2.6.4. Recent Developments
- 11.2.6.5. Financials (Based on Availability)
- 11.2.7 Daiwa Can Company
- 11.2.7.1. Overview
- 11.2.7.2. Products
- 11.2.7.3. SWOT Analysis
- 11.2.7.4. Recent Developments
- 11.2.7.5. Financials (Based on Availability)
- 11.2.8 Baosteel Packaging
- 11.2.8.1. Overview
- 11.2.8.2. Products
- 11.2.8.3. SWOT Analysis
- 11.2.8.4. Recent Developments
- 11.2.8.5. Financials (Based on Availability)
- 11.2.9 ORG Technology
- 11.2.9.1. Overview
- 11.2.9.2. Products
- 11.2.9.3. SWOT Analysis
- 11.2.9.4. Recent Developments
- 11.2.9.5. Financials (Based on Availability)
- 11.2.10 ShengXing Group
- 11.2.10.1. Overview
- 11.2.10.2. Products
- 11.2.10.3. SWOT Analysis
- 11.2.10.4. Recent Developments
- 11.2.10.5. Financials (Based on Availability)
- 11.2.11 CPMC Holdings
- 11.2.11.1. Overview
- 11.2.11.2. Products
- 11.2.11.3. SWOT Analysis
- 11.2.11.4. Recent Developments
- 11.2.11.5. Financials (Based on Availability)
- 11.2.12 Hokkan Holdings
- 11.2.12.1. Overview
- 11.2.12.2. Products
- 11.2.12.3. SWOT Analysis
- 11.2.12.4. Recent Developments
- 11.2.12.5. Financials (Based on Availability)
- 11.2.13 Showa Aluminum Can Corporation
- 11.2.13.1. Overview
- 11.2.13.2. Products
- 11.2.13.3. SWOT Analysis
- 11.2.13.4. Recent Developments
- 11.2.13.5. Financials (Based on Availability)
- 11.2.14 United Can (Great China Metal)
- 11.2.14.1. Overview
- 11.2.14.2. Products
- 11.2.14.3. SWOT Analysis
- 11.2.14.4. Recent Developments
- 11.2.14.5. Financials (Based on Availability)
- 11.2.15 Kingcan Holdings
- 11.2.15.1. Overview
- 11.2.15.2. Products
- 11.2.15.3. SWOT Analysis
- 11.2.15.4. Recent Developments
- 11.2.15.5. Financials (Based on Availability)
- 11.2.16 Jiamei Food Packaging
- 11.2.16.1. Overview
- 11.2.16.2. Products
- 11.2.16.3. SWOT Analysis
- 11.2.16.4. Recent Developments
- 11.2.16.5. Financials (Based on Availability)
- 11.2.17 Jiyuan Packaging Holdings
- 11.2.17.1. Overview
- 11.2.17.2. Products
- 11.2.17.3. SWOT Analysis
- 11.2.17.4. Recent Developments
- 11.2.17.5. Financials (Based on Availability)
- 11.2.18 Ball Corporation
- 11.2.18.1. Overview
- 11.2.18.2. Products
- 11.2.18.3. SWOT Analysis
- 11.2.18.4. Recent Developments
- 11.2.18.5. Financials (Based on Availability)
- 11.2.19 Crown Holdings
- 11.2.19.1. Overview
- 11.2.19.2. Products
- 11.2.19.3. SWOT Analysis
- 11.2.19.4. Recent Developments
- 11.2.19.5. Financials (Based on Availability)
- 11.2.20 Ardagh group
- 11.2.20.1. Overview
- 11.2.20.2. Products
- 11.2.20.3. SWOT Analysis
- 11.2.20.4. Recent Developments
- 11.2.20.5. Financials (Based on Availability)
- 11.2.21 Toyo Seikan
- 11.2.21.1. Overview
- 11.2.21.2. Products
- 11.2.21.3. SWOT Analysis
- 11.2.21.4. Recent Developments
- 11.2.21.5. Financials (Based on Availability)
- 11.2.22 Can Pack Group
- 11.2.22.1. Overview
- 11.2.22.2. Products
- 11.2.22.3. SWOT Analysis
- 11.2.22.4. Recent Developments
- 11.2.22.5. Financials (Based on Availability)
- 11.2.23 Silgan Holdings Inc
- 11.2.23.1. Overview
- 11.2.23.2. Products
- 11.2.23.3. SWOT Analysis
- 11.2.23.4. Recent Developments
- 11.2.23.5. Financials (Based on Availability)
- 11.2.24 Daiwa Can Company
- 11.2.24.1. Overview
- 11.2.24.2. Products
- 11.2.24.3. SWOT Analysis
- 11.2.24.4. Recent Developments
- 11.2.24.5. Financials (Based on Availability)
- 11.2.25 Baosteel Packaging
- 11.2.25.1. Overview
- 11.2.25.2. Products
- 11.2.25.3. SWOT Analysis
- 11.2.25.4. Recent Developments
- 11.2.25.5. Financials (Based on Availability)
- 11.2.26 ORG Technology
- 11.2.26.1. Overview
- 11.2.26.2. Products
- 11.2.26.3. SWOT Analysis
- 11.2.26.4. Recent Developments
- 11.2.26.5. Financials (Based on Availability)
- 11.2.27 ShengXing Group
- 11.2.27.1. Overview
- 11.2.27.2. Products
- 11.2.27.3. SWOT Analysis
- 11.2.27.4. Recent Developments
- 11.2.27.5. Financials (Based on Availability)
- 11.2.28 CPMC Holdings
- 11.2.28.1. Overview
- 11.2.28.2. Products
- 11.2.28.3. SWOT Analysis
- 11.2.28.4. Recent Developments
- 11.2.28.5. Financials (Based on Availability)
- 11.2.29 Hokkan Holdings
- 11.2.29.1. Overview
- 11.2.29.2. Products
- 11.2.29.3. SWOT Analysis
- 11.2.29.4. Recent Developments
- 11.2.29.5. Financials (Based on Availability)
- 11.2.30 Showa Aluminum Can Corporation
- 11.2.30.1. Overview
- 11.2.30.2. Products
- 11.2.30.3. SWOT Analysis
- 11.2.30.4. Recent Developments
- 11.2.30.5. Financials (Based on Availability)
- 11.2.31 United Can (Great China Metal)
- 11.2.31.1. Overview
- 11.2.31.2. Products
- 11.2.31.3. SWOT Analysis
- 11.2.31.4. Recent Developments
- 11.2.31.5. Financials (Based on Availability)
- 11.2.32 Kingcan Holdings
- 11.2.32.1. Overview
- 11.2.32.2. Products
- 11.2.32.3. SWOT Analysis
- 11.2.32.4. Recent Developments
- 11.2.32.5. Financials (Based on Availability)
- 11.2.33 Jiamei Food Packaging
- 11.2.33.1. Overview
- 11.2.33.2. Products
- 11.2.33.3. SWOT Analysis
- 11.2.33.4. Recent Developments
- 11.2.33.5. Financials (Based on Availability)
- 11.2.34 Jiyuan Packaging Holdings
- 11.2.34.1. Overview
- 11.2.34.2. Products
- 11.2.34.3. SWOT Analysis
- 11.2.34.4. Recent Developments
- 11.2.34.5. Financials (Based on Availability)
- 11.2.1 Ball Corporation
List of Figures
- Figure 1: Global Aluminum Beverage Container Revenue Breakdown (undefined, %) by Region 2025 & 2033
- Figure 2: Global Aluminum Beverage Container Volume Breakdown (K, %) by Region 2025 & 2033
- Figure 3: North America Aluminum Beverage Container Revenue (undefined), by Application 2025 & 2033
- Figure 4: North America Aluminum Beverage Container Volume (K), by Application 2025 & 2033
- Figure 5: North America Aluminum Beverage Container Revenue Share (%), by Application 2025 & 2033
- Figure 6: North America Aluminum Beverage Container Volume Share (%), by Application 2025 & 2033
- Figure 7: North America Aluminum Beverage Container Revenue (undefined), by Type 2025 & 2033
- Figure 8: North America Aluminum Beverage Container Volume (K), by Type 2025 & 2033
- Figure 9: North America Aluminum Beverage Container Revenue Share (%), by Type 2025 & 2033
- Figure 10: North America Aluminum Beverage Container Volume Share (%), by Type 2025 & 2033
- Figure 11: North America Aluminum Beverage Container Revenue (undefined), by Country 2025 & 2033
- Figure 12: North America Aluminum Beverage Container Volume (K), by Country 2025 & 2033
- Figure 13: North America Aluminum Beverage Container Revenue Share (%), by Country 2025 & 2033
- Figure 14: North America Aluminum Beverage Container Volume Share (%), by Country 2025 & 2033
- Figure 15: South America Aluminum Beverage Container Revenue (undefined), by Application 2025 & 2033
- Figure 16: South America Aluminum Beverage Container Volume (K), by Application 2025 & 2033
- Figure 17: South America Aluminum Beverage Container Revenue Share (%), by Application 2025 & 2033
- Figure 18: South America Aluminum Beverage Container Volume Share (%), by Application 2025 & 2033
- Figure 19: South America Aluminum Beverage Container Revenue (undefined), by Type 2025 & 2033
- Figure 20: South America Aluminum Beverage Container Volume (K), by Type 2025 & 2033
- Figure 21: South America Aluminum Beverage Container Revenue Share (%), by Type 2025 & 2033
- Figure 22: South America Aluminum Beverage Container Volume Share (%), by Type 2025 & 2033
- Figure 23: South America Aluminum Beverage Container Revenue (undefined), by Country 2025 & 2033
- Figure 24: South America Aluminum Beverage Container Volume (K), by Country 2025 & 2033
- Figure 25: South America Aluminum Beverage Container Revenue Share (%), by Country 2025 & 2033
- Figure 26: South America Aluminum Beverage Container Volume Share (%), by Country 2025 & 2033
- Figure 27: Europe Aluminum Beverage Container Revenue (undefined), by Application 2025 & 2033
- Figure 28: Europe Aluminum Beverage Container Volume (K), by Application 2025 & 2033
- Figure 29: Europe Aluminum Beverage Container Revenue Share (%), by Application 2025 & 2033
- Figure 30: Europe Aluminum Beverage Container Volume Share (%), by Application 2025 & 2033
- Figure 31: Europe Aluminum Beverage Container Revenue (undefined), by Type 2025 & 2033
- Figure 32: Europe Aluminum Beverage Container Volume (K), by Type 2025 & 2033
- Figure 33: Europe Aluminum Beverage Container Revenue Share (%), by Type 2025 & 2033
- Figure 34: Europe Aluminum Beverage Container Volume Share (%), by Type 2025 & 2033
- Figure 35: Europe Aluminum Beverage Container Revenue (undefined), by Country 2025 & 2033
- Figure 36: Europe Aluminum Beverage Container Volume (K), by Country 2025 & 2033
- Figure 37: Europe Aluminum Beverage Container Revenue Share (%), by Country 2025 & 2033
- Figure 38: Europe Aluminum Beverage Container Volume Share (%), by Country 2025 & 2033
- Figure 39: Middle East & Africa Aluminum Beverage Container Revenue (undefined), by Application 2025 & 2033
- Figure 40: Middle East & Africa Aluminum Beverage Container Volume (K), by Application 2025 & 2033
- Figure 41: Middle East & Africa Aluminum Beverage Container Revenue Share (%), by Application 2025 & 2033
- Figure 42: Middle East & Africa Aluminum Beverage Container Volume Share (%), by Application 2025 & 2033
- Figure 43: Middle East & Africa Aluminum Beverage Container Revenue (undefined), by Type 2025 & 2033
- Figure 44: Middle East & Africa Aluminum Beverage Container Volume (K), by Type 2025 & 2033
- Figure 45: Middle East & Africa Aluminum Beverage Container Revenue Share (%), by Type 2025 & 2033
- Figure 46: Middle East & Africa Aluminum Beverage Container Volume Share (%), by Type 2025 & 2033
- Figure 47: Middle East & Africa Aluminum Beverage Container Revenue (undefined), by Country 2025 & 2033
- Figure 48: Middle East & Africa Aluminum Beverage Container Volume (K), by Country 2025 & 2033
- Figure 49: Middle East & Africa Aluminum Beverage Container Revenue Share (%), by Country 2025 & 2033
- Figure 50: Middle East & Africa Aluminum Beverage Container Volume Share (%), by Country 2025 & 2033
- Figure 51: Asia Pacific Aluminum Beverage Container Revenue (undefined), by Application 2025 & 2033
- Figure 52: Asia Pacific Aluminum Beverage Container Volume (K), by Application 2025 & 2033
- Figure 53: Asia Pacific Aluminum Beverage Container Revenue Share (%), by Application 2025 & 2033
- Figure 54: Asia Pacific Aluminum Beverage Container Volume Share (%), by Application 2025 & 2033
- Figure 55: Asia Pacific Aluminum Beverage Container Revenue (undefined), by Type 2025 & 2033
- Figure 56: Asia Pacific Aluminum Beverage Container Volume (K), by Type 2025 & 2033
- Figure 57: Asia Pacific Aluminum Beverage Container Revenue Share (%), by Type 2025 & 2033
- Figure 58: Asia Pacific Aluminum Beverage Container Volume Share (%), by Type 2025 & 2033
- Figure 59: Asia Pacific Aluminum Beverage Container Revenue (undefined), by Country 2025 & 2033
- Figure 60: Asia Pacific Aluminum Beverage Container Volume (K), by Country 2025 & 2033
- Figure 61: Asia Pacific Aluminum Beverage Container Revenue Share (%), by Country 2025 & 2033
- Figure 62: Asia Pacific Aluminum Beverage Container Volume Share (%), by Country 2025 & 2033
List of Tables
- Table 1: Global Aluminum Beverage Container Revenue undefined Forecast, by Application 2020 & 2033
- Table 2: Global Aluminum Beverage Container Volume K Forecast, by Application 2020 & 2033
- Table 3: Global Aluminum Beverage Container Revenue undefined Forecast, by Type 2020 & 2033
- Table 4: Global Aluminum Beverage Container Volume K Forecast, by Type 2020 & 2033
- Table 5: Global Aluminum Beverage Container Revenue undefined Forecast, by Region 2020 & 2033
- Table 6: Global Aluminum Beverage Container Volume K Forecast, by Region 2020 & 2033
- Table 7: Global Aluminum Beverage Container Revenue undefined Forecast, by Application 2020 & 2033
- Table 8: Global Aluminum Beverage Container Volume K Forecast, by Application 2020 & 2033
- Table 9: Global Aluminum Beverage Container Revenue undefined Forecast, by Type 2020 & 2033
- Table 10: Global Aluminum Beverage Container Volume K Forecast, by Type 2020 & 2033
- Table 11: Global Aluminum Beverage Container Revenue undefined Forecast, by Country 2020 & 2033
- Table 12: Global Aluminum Beverage Container Volume K Forecast, by Country 2020 & 2033
- Table 13: United States Aluminum Beverage Container Revenue (undefined) Forecast, by Application 2020 & 2033
- Table 14: United States Aluminum Beverage Container Volume (K) Forecast, by Application 2020 & 2033
- Table 15: Canada Aluminum Beverage Container Revenue (undefined) Forecast, by Application 2020 & 2033
- Table 16: Canada Aluminum Beverage Container Volume (K) Forecast, by Application 2020 & 2033
- Table 17: Mexico Aluminum Beverage Container Revenue (undefined) Forecast, by Application 2020 & 2033
- Table 18: Mexico Aluminum Beverage Container Volume (K) Forecast, by Application 2020 & 2033
- Table 19: Global Aluminum Beverage Container Revenue undefined Forecast, by Application 2020 & 2033
- Table 20: Global Aluminum Beverage Container Volume K Forecast, by Application 2020 & 2033
- Table 21: Global Aluminum Beverage Container Revenue undefined Forecast, by Type 2020 & 2033
- Table 22: Global Aluminum Beverage Container Volume K Forecast, by Type 2020 & 2033
- Table 23: Global Aluminum Beverage Container Revenue undefined Forecast, by Country 2020 & 2033
- Table 24: Global Aluminum Beverage Container Volume K Forecast, by Country 2020 & 2033
- Table 25: Brazil Aluminum Beverage Container Revenue (undefined) Forecast, by Application 2020 & 2033
- Table 26: Brazil Aluminum Beverage Container Volume (K) Forecast, by Application 2020 & 2033
- Table 27: Argentina Aluminum Beverage Container Revenue (undefined) Forecast, by Application 2020 & 2033
- Table 28: Argentina Aluminum Beverage Container Volume (K) Forecast, by Application 2020 & 2033
- Table 29: Rest of South America Aluminum Beverage Container Revenue (undefined) Forecast, by Application 2020 & 2033
- Table 30: Rest of South America Aluminum Beverage Container Volume (K) Forecast, by Application 2020 & 2033
- Table 31: Global Aluminum Beverage Container Revenue undefined Forecast, by Application 2020 & 2033
- Table 32: Global Aluminum Beverage Container Volume K Forecast, by Application 2020 & 2033
- Table 33: Global Aluminum Beverage Container Revenue undefined Forecast, by Type 2020 & 2033
- Table 34: Global Aluminum Beverage Container Volume K Forecast, by Type 2020 & 2033
- Table 35: Global Aluminum Beverage Container Revenue undefined Forecast, by Country 2020 & 2033
- Table 36: Global Aluminum Beverage Container Volume K Forecast, by Country 2020 & 2033
- Table 37: United Kingdom Aluminum Beverage Container Revenue (undefined) Forecast, by Application 2020 & 2033
- Table 38: United Kingdom Aluminum Beverage Container Volume (K) Forecast, by Application 2020 & 2033
- Table 39: Germany Aluminum Beverage Container Revenue (undefined) Forecast, by Application 2020 & 2033
- Table 40: Germany Aluminum Beverage Container Volume (K) Forecast, by Application 2020 & 2033
- Table 41: France Aluminum Beverage Container Revenue (undefined) Forecast, by Application 2020 & 2033
- Table 42: France Aluminum Beverage Container Volume (K) Forecast, by Application 2020 & 2033
- Table 43: Italy Aluminum Beverage Container Revenue (undefined) Forecast, by Application 2020 & 2033
- Table 44: Italy Aluminum Beverage Container Volume (K) Forecast, by Application 2020 & 2033
- Table 45: Spain Aluminum Beverage Container Revenue (undefined) Forecast, by Application 2020 & 2033
- Table 46: Spain Aluminum Beverage Container Volume (K) Forecast, by Application 2020 & 2033
- Table 47: Russia Aluminum Beverage Container Revenue (undefined) Forecast, by Application 2020 & 2033
- Table 48: Russia Aluminum Beverage Container Volume (K) Forecast, by Application 2020 & 2033
- Table 49: Benelux Aluminum Beverage Container Revenue (undefined) Forecast, by Application 2020 & 2033
- Table 50: Benelux Aluminum Beverage Container Volume (K) Forecast, by Application 2020 & 2033
- Table 51: Nordics Aluminum Beverage Container Revenue (undefined) Forecast, by Application 2020 & 2033
- Table 52: Nordics Aluminum Beverage Container Volume (K) Forecast, by Application 2020 & 2033
- Table 53: Rest of Europe Aluminum Beverage Container Revenue (undefined) Forecast, by Application 2020 & 2033
- Table 54: Rest of Europe Aluminum Beverage Container Volume (K) Forecast, by Application 2020 & 2033
- Table 55: Global Aluminum Beverage Container Revenue undefined Forecast, by Application 2020 & 2033
- Table 56: Global Aluminum Beverage Container Volume K Forecast, by Application 2020 & 2033
- Table 57: Global Aluminum Beverage Container Revenue undefined Forecast, by Type 2020 & 2033
- Table 58: Global Aluminum Beverage Container Volume K Forecast, by Type 2020 & 2033
- Table 59: Global Aluminum Beverage Container Revenue undefined Forecast, by Country 2020 & 2033
- Table 60: Global Aluminum Beverage Container Volume K Forecast, by Country 2020 & 2033
- Table 61: Turkey Aluminum Beverage Container Revenue (undefined) Forecast, by Application 2020 & 2033
- Table 62: Turkey Aluminum Beverage Container Volume (K) Forecast, by Application 2020 & 2033
- Table 63: Israel Aluminum Beverage Container Revenue (undefined) Forecast, by Application 2020 & 2033
- Table 64: Israel Aluminum Beverage Container Volume (K) Forecast, by Application 2020 & 2033
- Table 65: GCC Aluminum Beverage Container Revenue (undefined) Forecast, by Application 2020 & 2033
- Table 66: GCC Aluminum Beverage Container Volume (K) Forecast, by Application 2020 & 2033
- Table 67: North Africa Aluminum Beverage Container Revenue (undefined) Forecast, by Application 2020 & 2033
- Table 68: North Africa Aluminum Beverage Container Volume (K) Forecast, by Application 2020 & 2033
- Table 69: South Africa Aluminum Beverage Container Revenue (undefined) Forecast, by Application 2020 & 2033
- Table 70: South Africa Aluminum Beverage Container Volume (K) Forecast, by Application 2020 & 2033
- Table 71: Rest of Middle East & Africa Aluminum Beverage Container Revenue (undefined) Forecast, by Application 2020 & 2033
- Table 72: Rest of Middle East & Africa Aluminum Beverage Container Volume (K) Forecast, by Application 2020 & 2033
- Table 73: Global Aluminum Beverage Container Revenue undefined Forecast, by Application 2020 & 2033
- Table 74: Global Aluminum Beverage Container Volume K Forecast, by Application 2020 & 2033
- Table 75: Global Aluminum Beverage Container Revenue undefined Forecast, by Type 2020 & 2033
- Table 76: Global Aluminum Beverage Container Volume K Forecast, by Type 2020 & 2033
- Table 77: Global Aluminum Beverage Container Revenue undefined Forecast, by Country 2020 & 2033
- Table 78: Global Aluminum Beverage Container Volume K Forecast, by Country 2020 & 2033
- Table 79: China Aluminum Beverage Container Revenue (undefined) Forecast, by Application 2020 & 2033
- Table 80: China Aluminum Beverage Container Volume (K) Forecast, by Application 2020 & 2033
- Table 81: India Aluminum Beverage Container Revenue (undefined) Forecast, by Application 2020 & 2033
- Table 82: India Aluminum Beverage Container Volume (K) Forecast, by Application 2020 & 2033
- Table 83: Japan Aluminum Beverage Container Revenue (undefined) Forecast, by Application 2020 & 2033
- Table 84: Japan Aluminum Beverage Container Volume (K) Forecast, by Application 2020 & 2033
- Table 85: South Korea Aluminum Beverage Container Revenue (undefined) Forecast, by Application 2020 & 2033
- Table 86: South Korea Aluminum Beverage Container Volume (K) Forecast, by Application 2020 & 2033
- Table 87: ASEAN Aluminum Beverage Container Revenue (undefined) Forecast, by Application 2020 & 2033
- Table 88: ASEAN Aluminum Beverage Container Volume (K) Forecast, by Application 2020 & 2033
- Table 89: Oceania Aluminum Beverage Container Revenue (undefined) Forecast, by Application 2020 & 2033
- Table 90: Oceania Aluminum Beverage Container Volume (K) Forecast, by Application 2020 & 2033
- Table 91: Rest of Asia Pacific Aluminum Beverage Container Revenue (undefined) Forecast, by Application 2020 & 2033
- Table 92: Rest of Asia Pacific Aluminum Beverage Container Volume (K) Forecast, by Application 2020 & 2033
Frequently Asked Questions
1. What is the projected Compound Annual Growth Rate (CAGR) of the Aluminum Beverage Container?
The projected CAGR is approximately 5.9%.
2. Which companies are prominent players in the Aluminum Beverage Container?
Key companies in the market include Ball Corporation, Crown Holdings, Ardagh group, Toyo Seikan, Can Pack Group, Silgan Holdings Inc, Daiwa Can Company, Baosteel Packaging, ORG Technology, ShengXing Group, CPMC Holdings, Hokkan Holdings, Showa Aluminum Can Corporation, United Can (Great China Metal), Kingcan Holdings, Jiamei Food Packaging, Jiyuan Packaging Holdings, Ball Corporation, Crown Holdings, Ardagh group, Toyo Seikan, Can Pack Group, Silgan Holdings Inc, Daiwa Can Company, Baosteel Packaging, ORG Technology, ShengXing Group, CPMC Holdings, Hokkan Holdings, Showa Aluminum Can Corporation, United Can (Great China Metal), Kingcan Holdings, Jiamei Food Packaging, Jiyuan Packaging Holdings.
3. What are the main segments of the Aluminum Beverage Container?
The market segments include Application, Type.
4. Can you provide details about the market size?
The market size is estimated to be USD XXX N/A as of 2022.
5. What are some drivers contributing to market growth?
N/A
6. What are the notable trends driving market growth?
N/A
7. Are there any restraints impacting market growth?
N/A
8. Can you provide examples of recent developments in the market?
N/A
9. What pricing options are available for accessing the report?
Pricing options include single-user, multi-user, and enterprise licenses priced at USD 3950.00, USD 5925.00, and USD 7900.00 respectively.
10. Is the market size provided in terms of value or volume?
The market size is provided in terms of value, measured in N/A and volume, measured in K.
11. Are there any specific market keywords associated with the report?
Yes, the market keyword associated with the report is "Aluminum Beverage Container," which aids in identifying and referencing the specific market segment covered.
12. How do I determine which pricing option suits my needs best?
The pricing options vary based on user requirements and access needs. Individual users may opt for single-user licenses, while businesses requiring broader access may choose multi-user or enterprise licenses for cost-effective access to the report.
13. Are there any additional resources or data provided in the Aluminum Beverage Container report?
While the report offers comprehensive insights, it's advisable to review the specific contents or supplementary materials provided to ascertain if additional resources or data are available.
14. How can I stay updated on further developments or reports in the Aluminum Beverage Container?
To stay informed about further developments, trends, and reports in the Aluminum Beverage Container, consider subscribing to industry newsletters, following relevant companies and organizations, or regularly checking reputable industry news sources and publications.
Methodology
Step 1 - Identification of Relevant Samples Size from Population Database


Step 2 - Approaches for Defining Global Market Size (Value, Volume* & Price*)

Note*: In applicable scenarios
Step 3 - Data Sources
Primary Research
- Web Analytics
- Survey Reports
- Research Institute
- Latest Research Reports
- Opinion Leaders
Secondary Research
- Annual Reports
- White Paper
- Latest Press Release
- Industry Association
- Paid Database
- Investor Presentations

Step 4 - Data Triangulation
Involves using different sources of information in order to increase the validity of a study
These sources are likely to be stakeholders in a program - participants, other researchers, program staff, other community members, and so on.
Then we put all data in single framework & apply various statistical tools to find out the dynamic on the market.
During the analysis stage, feedback from the stakeholder groups would be compared to determine areas of agreement as well as areas of divergence