

Key Insights
The Bag-on-Valve (BoV) packaging market is projected to grow at a Compound Annual Growth Rate (CAGR) of 6.2%, reaching an estimated market size of $8.4 billion by 2025. This expansion is driven by escalating demand for efficient, sustainable, and user-friendly dispensing solutions across diverse sectors. Key growth catalysts include the increasing preference for personal care products requiring precise application and waste reduction, the rising adoption of aerosol formats in food and beverage industries for convenience, and the integration of BoV technology in pharmaceuticals and industrial chemicals for superior product containment and controlled dispensing. Continuous innovation in valve design, materials, and functionality by leading manufacturers such as Coster, Aptar Group, and LINDAL Group is shaping a competitive landscape that prioritizes advanced and consumer-centric solutions.
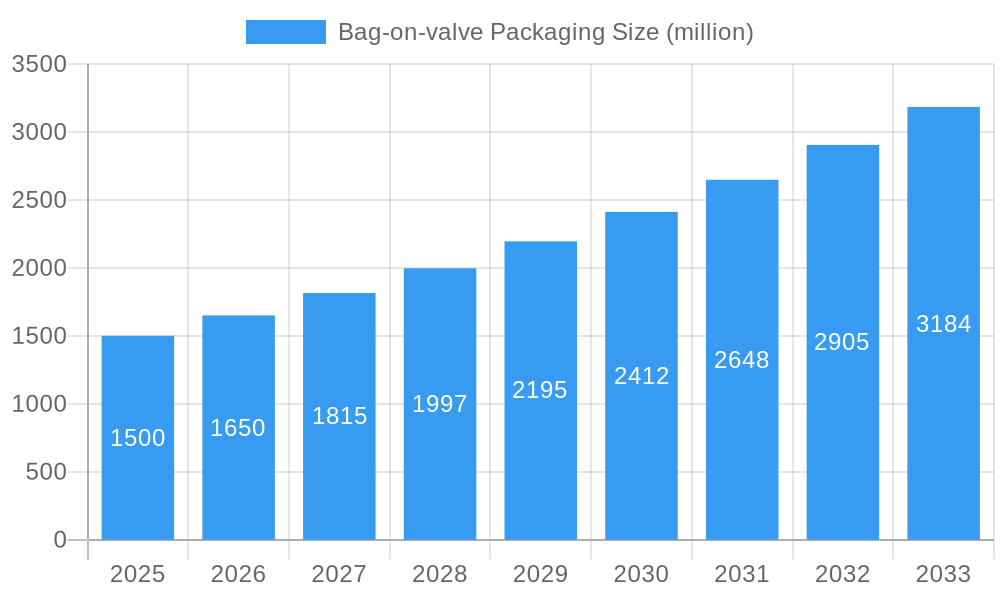
Bag-on-valve Packaging Market Size (In Billion)
While the BoV packaging market presents substantial growth opportunities, it also encounters challenges, including significant initial capital investment for specialized manufacturing and fluctuating raw material costs. Evolving environmental regulations concerning propellants also pose considerations. Nevertheless, the inherent advantages of BoV packaging, such as waste minimization, extended product shelf-life, and enhanced end-user experience, are expected to sustain market expansion. The market is segmented by application (personal care, food & beverage, pharmaceuticals, industrial, etc.), valve type, and material, with developed regions leading current market share and emerging economies poised for significant future growth.
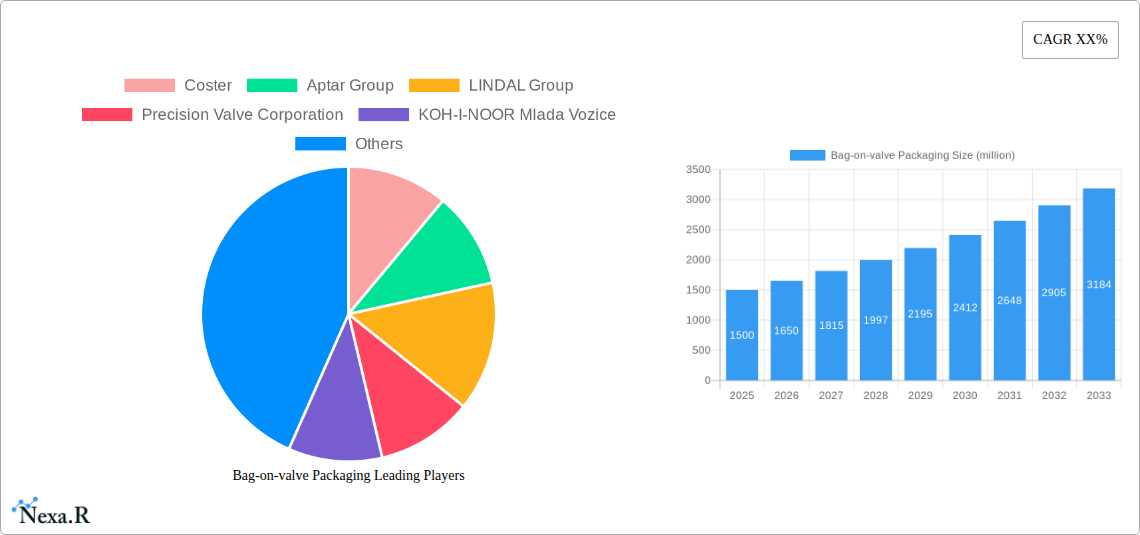
Bag-on-valve Packaging Company Market Share
Bag-on-Valve (BoV) Packaging Market Report: 2019-2033
This comprehensive report provides a detailed analysis of the Bag-on-Valve (BoV) packaging market, encompassing market dynamics, growth trends, regional analysis, competitive landscape, and future outlook. The study period covers 2019-2033, with 2025 as the base year and a forecast period of 2025-2033. This report is invaluable for industry professionals, investors, and strategists seeking to understand and capitalize on opportunities within this dynamic sector. The report analyzes the parent market of packaging and the child market of aerosol packaging. Market values are presented in million units.
Bag-on-valve Packaging Market Dynamics & Structure
This section analyzes the Bag-on-Valve (BoV) packaging market's structure, exploring market concentration, technological innovation drivers, regulatory landscapes, competitive substitutes, end-user demographics, and mergers & acquisitions (M&A) activities. The market is moderately concentrated, with several key players holding significant market share. Innovation in valve technology and material science drives market growth, while stringent regulations regarding volatile organic compounds (VOCs) influence product development. Competition from traditional aerosol cans and other dispensing systems presents a challenge. The end-user demographic is diverse, encompassing personal care, food & beverage, pharmaceutical, and industrial applications. M&A activity has been moderate, with strategic acquisitions aiming to expand product portfolios and geographical reach.
- Market Concentration: Moderately concentrated, with top 5 players holding approximately xx% market share in 2025.
- Technological Drivers: Advancements in valve technology, sustainable materials (e.g., bio-based polymers), and improved dispensing mechanisms.
- Regulatory Framework: Increasingly stringent regulations on VOC emissions and sustainable packaging practices.
- Competitive Substitutes: Traditional aerosol cans, pumps, and other dispensing systems.
- End-User Demographics: Diverse, including personal care, food & beverage, pharmaceuticals, and industrial applications.
- M&A Trends: Moderate activity, focused on expanding product portfolios and market reach; xx M&A deals recorded between 2019 and 2024.
Bag-on-valve Packaging Growth Trends & Insights
The Bag-on-Valve (BoV) packaging market exhibits robust growth, driven by increasing demand for convenient, efficient, and sustainable packaging solutions. The market size has witnessed a Compound Annual Growth Rate (CAGR) of xx% during the historical period (2019-2024) and is projected to grow at a CAGR of xx% during the forecast period (2025-2033), reaching xx million units by 2033. This growth is fueled by rising consumer preference for eco-friendly packaging options, technological advancements, and increasing adoption across various industries. The market penetration of BoV packaging is steadily increasing, particularly in developing economies experiencing rapid industrialization and rising disposable incomes. Technological disruptions, such as the development of innovative valve designs and sustainable materials, further accelerate market expansion. Consumer behavior shifts towards premium and convenient products also contribute to the growth trajectory.
Dominant Regions, Countries, or Segments in Bag-on-valve Packaging
North America currently dominates the Bag-on-Valve (BoV) packaging market, followed by Europe and Asia-Pacific. The dominance of North America is attributed to high consumer spending on personal care and household products, coupled with advanced infrastructure and robust regulatory frameworks. Europe's strong environmental consciousness and regulatory pressures related to sustainable packaging also contribute to significant market growth. The Asia-Pacific region is witnessing rapid growth driven by expanding economies, increasing urbanization, and rising disposable incomes, particularly in developing nations. The personal care segment leads the market, followed by the food and beverage segment.
- North America: High consumer spending on personal care products, advanced infrastructure.
- Europe: Strong environmental consciousness, stringent regulations favoring sustainable packaging.
- Asia-Pacific: Rapidly expanding economies, increasing urbanization, rising disposable incomes.
- Personal Care Segment: Highest market share due to demand for convenient and premium products.
- Food & Beverage Segment: Significant growth driven by increasing demand for convenient food packaging.
Bag-on-valve Packaging Product Landscape
BoV packaging offers a range of innovative products with varying valve designs, materials, and functionalities. Advancements include improved dispensing mechanisms for precise dosage control, sustainable materials like bio-based polymers, and specialized valves for specific product applications. Unique selling propositions include superior oxygen and moisture barrier properties, preventing product degradation and extending shelf life. Technological advancements focus on enhanced functionality, sustainability, and cost-effectiveness.
Key Drivers, Barriers & Challenges in Bag-on-valve Packaging
Key Drivers:
- Increasing demand for sustainable and eco-friendly packaging solutions.
- Growing consumer preference for convenient and easy-to-use products.
- Technological advancements in valve technology and material science.
- Expansion into new applications across various industries.
Challenges & Restraints:
- High initial investment costs associated with BoV packaging adoption.
- Potential supply chain disruptions affecting the availability of raw materials.
- Stringent regulatory requirements related to material safety and VOC emissions.
- Competition from established packaging technologies.
Emerging Opportunities in Bag-on-valve Packaging
Emerging opportunities lie in expanding into untapped markets, particularly in developing economies. Innovative applications in pharmaceuticals and industrial sectors offer significant growth potential. Evolving consumer preferences toward personalized and customized products create opportunities for BoV packaging to cater to niche segments. Furthermore, developing sustainable and recyclable packaging options represents a significant opportunity for market expansion.
Growth Accelerators in the Bag-on-valve Packaging Industry
Technological breakthroughs in valve technology and sustainable material science represent significant growth accelerators. Strategic partnerships and collaborations between packaging manufacturers, valve suppliers, and brand owners can drive innovation and market expansion. Expansion into new geographical markets and the development of customized solutions for specific product applications also contribute to sustained growth.
Key Players Shaping the Bag-on-valve Packaging Market
- Coster
- Aptar Group
- LINDAL Group
- Precision Valve Corporation
- KOH-I-NOOR Mlada Boleslav
- Summit Packaging System
- TOYO & DEUTSCHE AEROSOL
- BOV Solutions
- Majesty Packaging Systems
- Shanghai Qun Tong Spray Packing Material
Notable Milestones in Bag-on-valve Packaging Sector
- 2020: Introduction of a new bio-based polymer for BoV packaging by LINDAL Group.
- 2021: Aptar Group acquired a smaller BoV packaging company, expanding its market reach.
- 2022: Several major personal care brands adopted BoV packaging for their products.
- 2023: New regulations on VOC emissions came into effect in Europe, impacting the market.
In-Depth Bag-on-valve Packaging Market Outlook
The Bag-on-Valve (BoV) packaging market is poised for significant growth in the coming years, driven by technological advancements, expanding applications, and a growing demand for sustainable packaging solutions. Strategic partnerships, innovations in valve technology, and the development of recyclable materials will play a pivotal role in shaping the future market landscape. The increasing focus on sustainability and convenience across various consumer and industrial sectors presents ample opportunities for market expansion and innovation.
Bag-on-valve Packaging Segmentation
-
1. Application
- 1.1. Cosmetics & Personal Care
- 1.2. Pharmaceuticals
- 1.3. Home Care
- 1.4. Food & Beverages
- 1.5. Automotive & Industrial Products
-
2. Types
- 2.1. Aerosol BOV
- 2.2. Standard BOV
- 2.3. Non-spray/Low-pressure BOV
Bag-on-valve Packaging Segmentation By Geography
-
1. North America
- 1.1. United States
- 1.2. Canada
- 1.3. Mexico
-
2. South America
- 2.1. Brazil
- 2.2. Argentina
- 2.3. Rest of South America
-
3. Europe
- 3.1. United Kingdom
- 3.2. Germany
- 3.3. France
- 3.4. Italy
- 3.5. Spain
- 3.6. Russia
- 3.7. Benelux
- 3.8. Nordics
- 3.9. Rest of Europe
-
4. Middle East & Africa
- 4.1. Turkey
- 4.2. Israel
- 4.3. GCC
- 4.4. North Africa
- 4.5. South Africa
- 4.6. Rest of Middle East & Africa
-
5. Asia Pacific
- 5.1. China
- 5.2. India
- 5.3. Japan
- 5.4. South Korea
- 5.5. ASEAN
- 5.6. Oceania
- 5.7. Rest of Asia Pacific

Bag-on-valve Packaging Regional Market Share
Geographic Coverage of Bag-on-valve Packaging
Bag-on-valve Packaging REPORT HIGHLIGHTS
| Aspects | Details |
|---|---|
| Study Period | 2020-2034 |
| Base Year | 2025 |
| Estimated Year | 2026 |
| Forecast Period | 2026-2034 |
| Historical Period | 2020-2025 |
| Growth Rate | CAGR of 6.2% from 2020-2034 |
| Segmentation |
|
Table of Contents
- 1. Introduction
- 1.1. Research Scope
- 1.2. Market Segmentation
- 1.3. Research Methodology
- 1.4. Definitions and Assumptions
- 2. Executive Summary
- 2.1. Introduction
- 3. Market Dynamics
- 3.1. Introduction
- 3.2. Market Drivers
- 3.3. Market Restrains
- 3.4. Market Trends
- 4. Market Factor Analysis
- 4.1. Porters Five Forces
- 4.2. Supply/Value Chain
- 4.3. PESTEL analysis
- 4.4. Market Entropy
- 4.5. Patent/Trademark Analysis
- 5. Global Bag-on-valve Packaging Analysis, Insights and Forecast, 2020-2032
- 5.1. Market Analysis, Insights and Forecast - by Application
- 5.1.1. Cosmetics & Personal Care
- 5.1.2. Pharmaceuticals
- 5.1.3. Home Care
- 5.1.4. Food & Beverages
- 5.1.5. Automotive & Industrial Products
- 5.2. Market Analysis, Insights and Forecast - by Types
- 5.2.1. Aerosol BOV
- 5.2.2. Standard BOV
- 5.2.3. Non-spray/Low-pressure BOV
- 5.3. Market Analysis, Insights and Forecast - by Region
- 5.3.1. North America
- 5.3.2. South America
- 5.3.3. Europe
- 5.3.4. Middle East & Africa
- 5.3.5. Asia Pacific
- 5.1. Market Analysis, Insights and Forecast - by Application
- 6. North America Bag-on-valve Packaging Analysis, Insights and Forecast, 2020-2032
- 6.1. Market Analysis, Insights and Forecast - by Application
- 6.1.1. Cosmetics & Personal Care
- 6.1.2. Pharmaceuticals
- 6.1.3. Home Care
- 6.1.4. Food & Beverages
- 6.1.5. Automotive & Industrial Products
- 6.2. Market Analysis, Insights and Forecast - by Types
- 6.2.1. Aerosol BOV
- 6.2.2. Standard BOV
- 6.2.3. Non-spray/Low-pressure BOV
- 6.1. Market Analysis, Insights and Forecast - by Application
- 7. South America Bag-on-valve Packaging Analysis, Insights and Forecast, 2020-2032
- 7.1. Market Analysis, Insights and Forecast - by Application
- 7.1.1. Cosmetics & Personal Care
- 7.1.2. Pharmaceuticals
- 7.1.3. Home Care
- 7.1.4. Food & Beverages
- 7.1.5. Automotive & Industrial Products
- 7.2. Market Analysis, Insights and Forecast - by Types
- 7.2.1. Aerosol BOV
- 7.2.2. Standard BOV
- 7.2.3. Non-spray/Low-pressure BOV
- 7.1. Market Analysis, Insights and Forecast - by Application
- 8. Europe Bag-on-valve Packaging Analysis, Insights and Forecast, 2020-2032
- 8.1. Market Analysis, Insights and Forecast - by Application
- 8.1.1. Cosmetics & Personal Care
- 8.1.2. Pharmaceuticals
- 8.1.3. Home Care
- 8.1.4. Food & Beverages
- 8.1.5. Automotive & Industrial Products
- 8.2. Market Analysis, Insights and Forecast - by Types
- 8.2.1. Aerosol BOV
- 8.2.2. Standard BOV
- 8.2.3. Non-spray/Low-pressure BOV
- 8.1. Market Analysis, Insights and Forecast - by Application
- 9. Middle East & Africa Bag-on-valve Packaging Analysis, Insights and Forecast, 2020-2032
- 9.1. Market Analysis, Insights and Forecast - by Application
- 9.1.1. Cosmetics & Personal Care
- 9.1.2. Pharmaceuticals
- 9.1.3. Home Care
- 9.1.4. Food & Beverages
- 9.1.5. Automotive & Industrial Products
- 9.2. Market Analysis, Insights and Forecast - by Types
- 9.2.1. Aerosol BOV
- 9.2.2. Standard BOV
- 9.2.3. Non-spray/Low-pressure BOV
- 9.1. Market Analysis, Insights and Forecast - by Application
- 10. Asia Pacific Bag-on-valve Packaging Analysis, Insights and Forecast, 2020-2032
- 10.1. Market Analysis, Insights and Forecast - by Application
- 10.1.1. Cosmetics & Personal Care
- 10.1.2. Pharmaceuticals
- 10.1.3. Home Care
- 10.1.4. Food & Beverages
- 10.1.5. Automotive & Industrial Products
- 10.2. Market Analysis, Insights and Forecast - by Types
- 10.2.1. Aerosol BOV
- 10.2.2. Standard BOV
- 10.2.3. Non-spray/Low-pressure BOV
- 10.1. Market Analysis, Insights and Forecast - by Application
- 11. Competitive Analysis
- 11.1. Global Market Share Analysis 2025
- 11.2. Company Profiles
- 11.2.1 Coster
- 11.2.1.1. Overview
- 11.2.1.2. Products
- 11.2.1.3. SWOT Analysis
- 11.2.1.4. Recent Developments
- 11.2.1.5. Financials (Based on Availability)
- 11.2.2 Aptar Group
- 11.2.2.1. Overview
- 11.2.2.2. Products
- 11.2.2.3. SWOT Analysis
- 11.2.2.4. Recent Developments
- 11.2.2.5. Financials (Based on Availability)
- 11.2.3 LINDAL Group
- 11.2.3.1. Overview
- 11.2.3.2. Products
- 11.2.3.3. SWOT Analysis
- 11.2.3.4. Recent Developments
- 11.2.3.5. Financials (Based on Availability)
- 11.2.4 Precision Valve Corporation
- 11.2.4.1. Overview
- 11.2.4.2. Products
- 11.2.4.3. SWOT Analysis
- 11.2.4.4. Recent Developments
- 11.2.4.5. Financials (Based on Availability)
- 11.2.5 KOH-I-NOOR Mlada Vozice
- 11.2.5.1. Overview
- 11.2.5.2. Products
- 11.2.5.3. SWOT Analysis
- 11.2.5.4. Recent Developments
- 11.2.5.5. Financials (Based on Availability)
- 11.2.6 Summit Packaging System
- 11.2.6.1. Overview
- 11.2.6.2. Products
- 11.2.6.3. SWOT Analysis
- 11.2.6.4. Recent Developments
- 11.2.6.5. Financials (Based on Availability)
- 11.2.7 TOYO & DEUTSCHE AEROSOL
- 11.2.7.1. Overview
- 11.2.7.2. Products
- 11.2.7.3. SWOT Analysis
- 11.2.7.4. Recent Developments
- 11.2.7.5. Financials (Based on Availability)
- 11.2.8 BOV Solutions
- 11.2.8.1. Overview
- 11.2.8.2. Products
- 11.2.8.3. SWOT Analysis
- 11.2.8.4. Recent Developments
- 11.2.8.5. Financials (Based on Availability)
- 11.2.9 Majesty Packaging Systems
- 11.2.9.1. Overview
- 11.2.9.2. Products
- 11.2.9.3. SWOT Analysis
- 11.2.9.4. Recent Developments
- 11.2.9.5. Financials (Based on Availability)
- 11.2.10 Shanghai Qun Tong Spray Packing Material
- 11.2.10.1. Overview
- 11.2.10.2. Products
- 11.2.10.3. SWOT Analysis
- 11.2.10.4. Recent Developments
- 11.2.10.5. Financials (Based on Availability)
- 11.2.1 Coster
List of Figures
- Figure 1: Global Bag-on-valve Packaging Revenue Breakdown (billion, %) by Region 2025 & 2033
- Figure 2: North America Bag-on-valve Packaging Revenue (billion), by Application 2025 & 2033
- Figure 3: North America Bag-on-valve Packaging Revenue Share (%), by Application 2025 & 2033
- Figure 4: North America Bag-on-valve Packaging Revenue (billion), by Types 2025 & 2033
- Figure 5: North America Bag-on-valve Packaging Revenue Share (%), by Types 2025 & 2033
- Figure 6: North America Bag-on-valve Packaging Revenue (billion), by Country 2025 & 2033
- Figure 7: North America Bag-on-valve Packaging Revenue Share (%), by Country 2025 & 2033
- Figure 8: South America Bag-on-valve Packaging Revenue (billion), by Application 2025 & 2033
- Figure 9: South America Bag-on-valve Packaging Revenue Share (%), by Application 2025 & 2033
- Figure 10: South America Bag-on-valve Packaging Revenue (billion), by Types 2025 & 2033
- Figure 11: South America Bag-on-valve Packaging Revenue Share (%), by Types 2025 & 2033
- Figure 12: South America Bag-on-valve Packaging Revenue (billion), by Country 2025 & 2033
- Figure 13: South America Bag-on-valve Packaging Revenue Share (%), by Country 2025 & 2033
- Figure 14: Europe Bag-on-valve Packaging Revenue (billion), by Application 2025 & 2033
- Figure 15: Europe Bag-on-valve Packaging Revenue Share (%), by Application 2025 & 2033
- Figure 16: Europe Bag-on-valve Packaging Revenue (billion), by Types 2025 & 2033
- Figure 17: Europe Bag-on-valve Packaging Revenue Share (%), by Types 2025 & 2033
- Figure 18: Europe Bag-on-valve Packaging Revenue (billion), by Country 2025 & 2033
- Figure 19: Europe Bag-on-valve Packaging Revenue Share (%), by Country 2025 & 2033
- Figure 20: Middle East & Africa Bag-on-valve Packaging Revenue (billion), by Application 2025 & 2033
- Figure 21: Middle East & Africa Bag-on-valve Packaging Revenue Share (%), by Application 2025 & 2033
- Figure 22: Middle East & Africa Bag-on-valve Packaging Revenue (billion), by Types 2025 & 2033
- Figure 23: Middle East & Africa Bag-on-valve Packaging Revenue Share (%), by Types 2025 & 2033
- Figure 24: Middle East & Africa Bag-on-valve Packaging Revenue (billion), by Country 2025 & 2033
- Figure 25: Middle East & Africa Bag-on-valve Packaging Revenue Share (%), by Country 2025 & 2033
- Figure 26: Asia Pacific Bag-on-valve Packaging Revenue (billion), by Application 2025 & 2033
- Figure 27: Asia Pacific Bag-on-valve Packaging Revenue Share (%), by Application 2025 & 2033
- Figure 28: Asia Pacific Bag-on-valve Packaging Revenue (billion), by Types 2025 & 2033
- Figure 29: Asia Pacific Bag-on-valve Packaging Revenue Share (%), by Types 2025 & 2033
- Figure 30: Asia Pacific Bag-on-valve Packaging Revenue (billion), by Country 2025 & 2033
- Figure 31: Asia Pacific Bag-on-valve Packaging Revenue Share (%), by Country 2025 & 2033
List of Tables
- Table 1: Global Bag-on-valve Packaging Revenue billion Forecast, by Application 2020 & 2033
- Table 2: Global Bag-on-valve Packaging Revenue billion Forecast, by Types 2020 & 2033
- Table 3: Global Bag-on-valve Packaging Revenue billion Forecast, by Region 2020 & 2033
- Table 4: Global Bag-on-valve Packaging Revenue billion Forecast, by Application 2020 & 2033
- Table 5: Global Bag-on-valve Packaging Revenue billion Forecast, by Types 2020 & 2033
- Table 6: Global Bag-on-valve Packaging Revenue billion Forecast, by Country 2020 & 2033
- Table 7: United States Bag-on-valve Packaging Revenue (billion) Forecast, by Application 2020 & 2033
- Table 8: Canada Bag-on-valve Packaging Revenue (billion) Forecast, by Application 2020 & 2033
- Table 9: Mexico Bag-on-valve Packaging Revenue (billion) Forecast, by Application 2020 & 2033
- Table 10: Global Bag-on-valve Packaging Revenue billion Forecast, by Application 2020 & 2033
- Table 11: Global Bag-on-valve Packaging Revenue billion Forecast, by Types 2020 & 2033
- Table 12: Global Bag-on-valve Packaging Revenue billion Forecast, by Country 2020 & 2033
- Table 13: Brazil Bag-on-valve Packaging Revenue (billion) Forecast, by Application 2020 & 2033
- Table 14: Argentina Bag-on-valve Packaging Revenue (billion) Forecast, by Application 2020 & 2033
- Table 15: Rest of South America Bag-on-valve Packaging Revenue (billion) Forecast, by Application 2020 & 2033
- Table 16: Global Bag-on-valve Packaging Revenue billion Forecast, by Application 2020 & 2033
- Table 17: Global Bag-on-valve Packaging Revenue billion Forecast, by Types 2020 & 2033
- Table 18: Global Bag-on-valve Packaging Revenue billion Forecast, by Country 2020 & 2033
- Table 19: United Kingdom Bag-on-valve Packaging Revenue (billion) Forecast, by Application 2020 & 2033
- Table 20: Germany Bag-on-valve Packaging Revenue (billion) Forecast, by Application 2020 & 2033
- Table 21: France Bag-on-valve Packaging Revenue (billion) Forecast, by Application 2020 & 2033
- Table 22: Italy Bag-on-valve Packaging Revenue (billion) Forecast, by Application 2020 & 2033
- Table 23: Spain Bag-on-valve Packaging Revenue (billion) Forecast, by Application 2020 & 2033
- Table 24: Russia Bag-on-valve Packaging Revenue (billion) Forecast, by Application 2020 & 2033
- Table 25: Benelux Bag-on-valve Packaging Revenue (billion) Forecast, by Application 2020 & 2033
- Table 26: Nordics Bag-on-valve Packaging Revenue (billion) Forecast, by Application 2020 & 2033
- Table 27: Rest of Europe Bag-on-valve Packaging Revenue (billion) Forecast, by Application 2020 & 2033
- Table 28: Global Bag-on-valve Packaging Revenue billion Forecast, by Application 2020 & 2033
- Table 29: Global Bag-on-valve Packaging Revenue billion Forecast, by Types 2020 & 2033
- Table 30: Global Bag-on-valve Packaging Revenue billion Forecast, by Country 2020 & 2033
- Table 31: Turkey Bag-on-valve Packaging Revenue (billion) Forecast, by Application 2020 & 2033
- Table 32: Israel Bag-on-valve Packaging Revenue (billion) Forecast, by Application 2020 & 2033
- Table 33: GCC Bag-on-valve Packaging Revenue (billion) Forecast, by Application 2020 & 2033
- Table 34: North Africa Bag-on-valve Packaging Revenue (billion) Forecast, by Application 2020 & 2033
- Table 35: South Africa Bag-on-valve Packaging Revenue (billion) Forecast, by Application 2020 & 2033
- Table 36: Rest of Middle East & Africa Bag-on-valve Packaging Revenue (billion) Forecast, by Application 2020 & 2033
- Table 37: Global Bag-on-valve Packaging Revenue billion Forecast, by Application 2020 & 2033
- Table 38: Global Bag-on-valve Packaging Revenue billion Forecast, by Types 2020 & 2033
- Table 39: Global Bag-on-valve Packaging Revenue billion Forecast, by Country 2020 & 2033
- Table 40: China Bag-on-valve Packaging Revenue (billion) Forecast, by Application 2020 & 2033
- Table 41: India Bag-on-valve Packaging Revenue (billion) Forecast, by Application 2020 & 2033
- Table 42: Japan Bag-on-valve Packaging Revenue (billion) Forecast, by Application 2020 & 2033
- Table 43: South Korea Bag-on-valve Packaging Revenue (billion) Forecast, by Application 2020 & 2033
- Table 44: ASEAN Bag-on-valve Packaging Revenue (billion) Forecast, by Application 2020 & 2033
- Table 45: Oceania Bag-on-valve Packaging Revenue (billion) Forecast, by Application 2020 & 2033
- Table 46: Rest of Asia Pacific Bag-on-valve Packaging Revenue (billion) Forecast, by Application 2020 & 2033
Frequently Asked Questions
1. What is the projected Compound Annual Growth Rate (CAGR) of the Bag-on-valve Packaging?
The projected CAGR is approximately 6.2%.
2. Which companies are prominent players in the Bag-on-valve Packaging?
Key companies in the market include Coster, Aptar Group, LINDAL Group, Precision Valve Corporation, KOH-I-NOOR Mlada Vozice, Summit Packaging System, TOYO & DEUTSCHE AEROSOL, BOV Solutions, Majesty Packaging Systems, Shanghai Qun Tong Spray Packing Material.
3. What are the main segments of the Bag-on-valve Packaging?
The market segments include Application, Types.
4. Can you provide details about the market size?
The market size is estimated to be USD 8.4 billion as of 2022.
5. What are some drivers contributing to market growth?
N/A
6. What are the notable trends driving market growth?
N/A
7. Are there any restraints impacting market growth?
N/A
8. Can you provide examples of recent developments in the market?
N/A
9. What pricing options are available for accessing the report?
Pricing options include single-user, multi-user, and enterprise licenses priced at USD 2900.00, USD 4350.00, and USD 5800.00 respectively.
10. Is the market size provided in terms of value or volume?
The market size is provided in terms of value, measured in billion.
11. Are there any specific market keywords associated with the report?
Yes, the market keyword associated with the report is "Bag-on-valve Packaging," which aids in identifying and referencing the specific market segment covered.
12. How do I determine which pricing option suits my needs best?
The pricing options vary based on user requirements and access needs. Individual users may opt for single-user licenses, while businesses requiring broader access may choose multi-user or enterprise licenses for cost-effective access to the report.
13. Are there any additional resources or data provided in the Bag-on-valve Packaging report?
While the report offers comprehensive insights, it's advisable to review the specific contents or supplementary materials provided to ascertain if additional resources or data are available.
14. How can I stay updated on further developments or reports in the Bag-on-valve Packaging?
To stay informed about further developments, trends, and reports in the Bag-on-valve Packaging, consider subscribing to industry newsletters, following relevant companies and organizations, or regularly checking reputable industry news sources and publications.
Methodology
Step 1 - Identification of Relevant Samples Size from Population Database


Step 2 - Approaches for Defining Global Market Size (Value, Volume* & Price*)

Note*: In applicable scenarios
Step 3 - Data Sources
Primary Research
- Web Analytics
- Survey Reports
- Research Institute
- Latest Research Reports
- Opinion Leaders
Secondary Research
- Annual Reports
- White Paper
- Latest Press Release
- Industry Association
- Paid Database
- Investor Presentations

Step 4 - Data Triangulation
Involves using different sources of information in order to increase the validity of a study
These sources are likely to be stakeholders in a program - participants, other researchers, program staff, other community members, and so on.
Then we put all data in single framework & apply various statistical tools to find out the dynamic on the market.
During the analysis stage, feedback from the stakeholder groups would be compared to determine areas of agreement as well as areas of divergence