

Key Insights
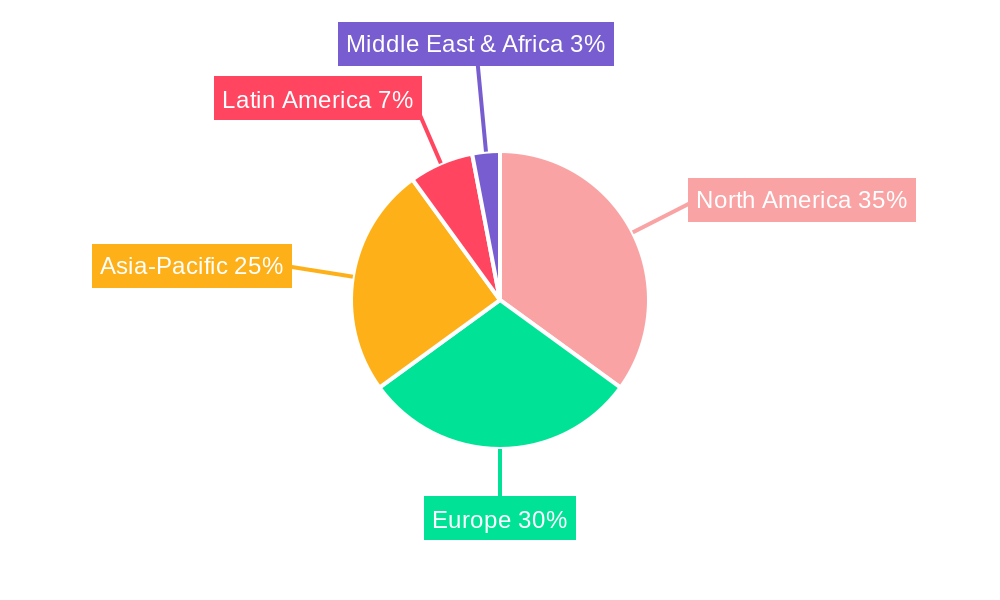
The global beverages plastic bottles market is projected for strong expansion, fueled by the escalating demand for convenient and lightweight packaging across diverse beverage segments. Factors such as ease of use, cost-effectiveness, and efficient transportation make plastic bottles a preferred choice for manufacturers and consumers alike. While environmental sustainability presents a considerable hurdle, the industry is proactively adopting solutions like enhanced recycling initiatives, the incorporation of recycled PET (rPET), and the development of biodegradable materials. This shift towards eco-conscious practices is reshaping market trends, influencing consumer choices, and driving regulatory adjustments that will define the market's future. Leading entities such as ALPLA, Amcor, and Berry Plastics are substantially investing in R&D to deliver sustainable yet functional and economical packaging. North America and Europe currently dominate market share owing to high per capita beverage consumption and developed infrastructure. However, emerging markets in Asia-Pacific and Latin America are anticipated to experience significant growth driven by increasing disposable incomes and evolving consumption habits. The forecast period (2025-2033) indicates continued market growth, with an estimated CAGR of 4.39%. The market size is expected to reach $9.71 billion by 2025.
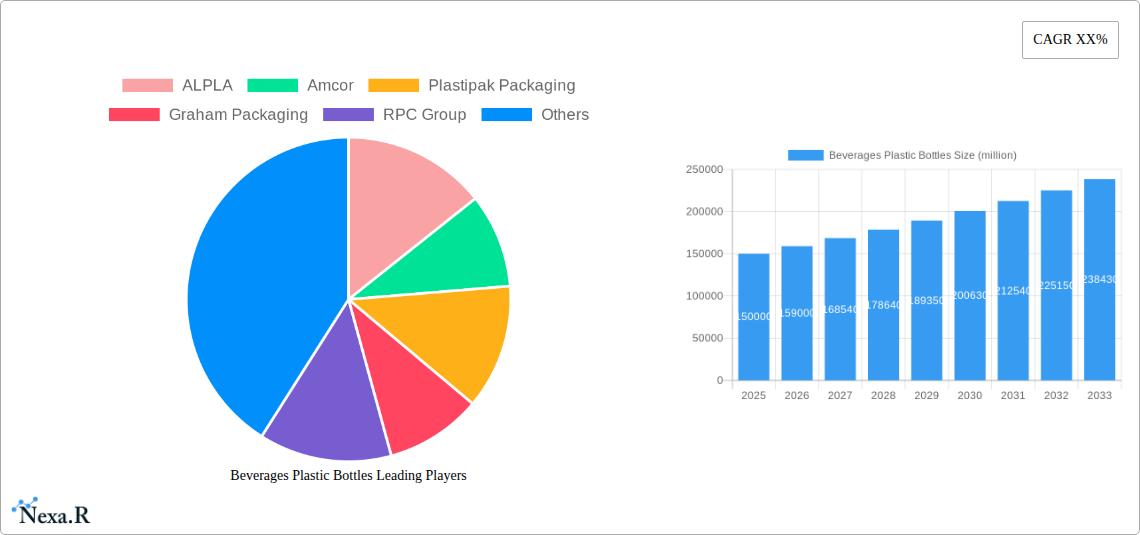
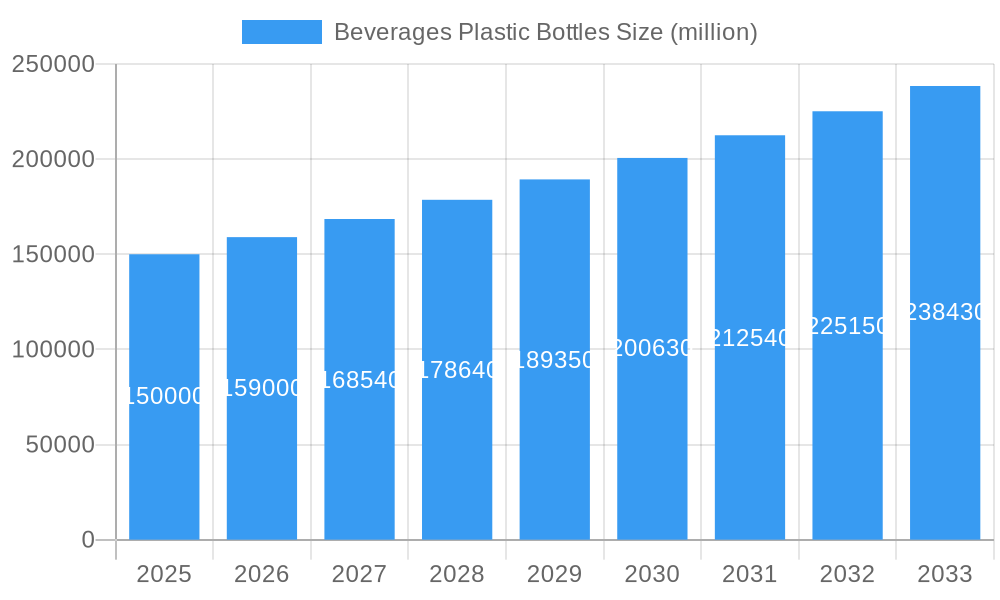
Beverages Plastic Bottles Market Size (In Billion)
The competitive environment features a blend of large multinational corporations and regional manufacturers. Established companies leverage economies of scale and extensive distribution channels, while smaller players often target niche markets. Innovations in plastic manufacturing, including enhanced barrier properties and lighter designs, are boosting efficiency and reducing environmental impact. However, volatile raw material prices and strict environmental regulations remain key challenges. The market is segmented by bottle type (PET, HDPE, etc.), beverage type (carbonated soft drinks, juices, water, etc.), and region. Understanding these segments is crucial for identifying growth drivers and opportunities. In essence, the beverages plastic bottles market is dynamic and set for sustained growth, contingent upon adaptability, innovation, and a strong commitment to sustainable practices.
Beverages Plastic Bottles Company Market Share
Beverages Plastic Bottles Market Report: 2019-2033
This comprehensive report provides an in-depth analysis of the global Beverages Plastic Bottles market, offering invaluable insights for industry professionals, investors, and strategic decision-makers. The study covers the period 2019-2033, with a focus on the forecast period 2025-2033 and a base year of 2025. The report meticulously examines market dynamics, growth trends, regional dominance, product landscapes, key players, and emerging opportunities within the parent market of plastic packaging and the child market of beverage containers. Market values are presented in million units.
Beverages Plastic Bottles Market Dynamics & Structure
This section analyzes the competitive landscape of the Beverages Plastic Bottles market, exploring market concentration, technological innovation, regulatory frameworks, and industry trends. We delve into the impact of substitute products, end-user demographics, and mergers & acquisitions (M&A) activities.
- Market Concentration: The global market is moderately concentrated, with the top five players—Amcor, ALPLA, Plastipak Packaging, Graham Packaging, and Berry Plastics—holding an estimated xx% market share in 2025. Smaller players, including regional and specialized manufacturers, constitute the remaining market share.
- Technological Innovation: Significant advancements in lightweighting, barrier technologies (e.g., PETG, multilayer films), and recyclability are driving innovation. However, high R&D costs and the need for specialized machinery represent barriers to entry.
- Regulatory Frameworks: Growing environmental concerns are pushing for stricter regulations on plastic waste, impacting material choices and driving the adoption of recycled content and sustainable packaging solutions. Extended Producer Responsibility (EPR) schemes are also influencing market dynamics.
- Competitive Product Substitutes: Alternatives such as glass, aluminum, and cartons compete with plastic bottles, particularly in niche segments like premium beverages. However, plastic's cost-effectiveness, lightweight nature, and versatility maintain its dominance.
- End-User Demographics: Changing consumer preferences, particularly towards health and sustainability, are shaping demand for functional and environmentally friendly beverage packaging.
- M&A Trends: The industry has witnessed significant M&A activity in recent years, driven by consolidation efforts, technological acquisitions, and expansion into new markets. An estimated xx M&A deals were completed between 2019 and 2024.
Beverages Plastic Bottles Growth Trends & Insights
This section provides a detailed analysis of the Beverages Plastic Bottles market's historical and projected growth trajectory. We leverage proprietary data and industry benchmarks to project market size, adoption rates, technological disruptions, and shifts in consumer behavior.
The global Beverages Plastic Bottles market witnessed a CAGR of xx% during the historical period (2019-2024), reaching an estimated value of xx million units in 2024. Driven by sustained growth in the beverage industry, particularly in emerging economies, and the rising preference for convenient packaging, the market is expected to register a CAGR of xx% during the forecast period (2025-2033), reaching xx million units by 2033. This growth is further fueled by increasing adoption of lightweighting technologies and innovation in barrier materials to enhance shelf life and product quality. However, rising concerns over plastic pollution and growing popularity of eco-friendly alternatives might slightly moderate market growth in the later forecast years. The market penetration of recyclable PET bottles continues to rise, reaching xx% in 2025. Technological advancements in bio-based and biodegradable polymers offer a potential disruptive force, albeit still at an early adoption stage.
Dominant Regions, Countries, or Segments in Beverages Plastic Bottles
This section identifies the leading geographical regions and segments driving market growth.
Asia Pacific is the dominant region, accounting for an estimated xx% market share in 2025, driven by robust economic growth, a large and growing population, and increasing per capita consumption of beverages. Key growth drivers in the region include:
- Rapid urbanization and rising disposable incomes
- Expansion of organized retail and e-commerce
- Favorable government policies supporting the beverage and packaging industries
North America and Europe follow as significant markets, with established beverage industries and advanced packaging technologies. However, increasing environmental regulations are impacting material choices and adoption of sustainable packaging solutions in these regions.
Within the segments, carbonated soft drinks (CSDs) and bottled water are major drivers of demand, accounting for a combined xx% of the market in 2025. Growth in the functional beverages and ready-to-drink (RTD) segments also contributes significantly.
Beverages Plastic Bottles Product Landscape
The Beverages Plastic Bottles market offers a diverse range of products, tailored to different beverage types and customer needs. Innovations focus on enhanced barrier properties to extend shelf life, lightweight designs to reduce material costs and carbon footprint, and improved recyclability through the use of mono-material structures and recycled content. Key features include enhanced strength, improved clarity, and advanced printing capabilities for enhanced branding. Technological advancements include the integration of smart packaging features, such as QR codes for traceability and consumer engagement.
Key Drivers, Barriers & Challenges in Beverages Plastic Bottles
Key Drivers: The market is propelled by factors like the increasing demand for convenient and portable beverage packaging, growth of the beverage industry in emerging economies, and continuous innovations in material science and manufacturing technologies. Government initiatives promoting industrial growth and ease of doing business also contribute positively.
Key Challenges: The market faces significant challenges, including stringent environmental regulations, concerns about plastic waste, and fluctuating raw material prices. Supply chain disruptions and the rising cost of recycled PET can further constrain market growth. The competitive pressure from alternative packaging materials also presents a significant challenge. The estimated impact of these challenges on market growth is around xx% by 2033.
Emerging Opportunities in Beverages Plastic Bottles
Emerging opportunities include the growing demand for sustainable and eco-friendly packaging solutions, expansion into untapped markets in developing countries, and the potential for growth in niche segments like functional beverages and premium drinks. Innovative applications of smart packaging and personalized beverage experiences also present exciting possibilities.
Growth Accelerators in the Beverages Plastic Bottles Industry
Long-term growth is accelerated by technological breakthroughs in lightweighting and barrier technologies, strategic partnerships between packaging manufacturers and beverage companies, and expansion into new geographic markets. Focus on improving recyclability and reducing plastic waste is a critical aspect of long-term growth.
Key Players Shaping the Beverages Plastic Bottles Market
- ALPLA
- Amcor
- Plastipak Packaging
- Graham Packaging
- RPC Group
- Berry Plastics
- Greiner Packaging
- Alpha Packaging
- Zijiang
- Visy
- Zhongfu
- XLZT
- Polycon Industries
- KW Plastics
- Boxmore Packaging
Notable Milestones in Beverages Plastic Bottles Sector
- 2020: Increased focus on recycled PET content across major brands.
- 2021: Several key players announce investments in advanced recycling technologies.
- 2022: Launch of several new lightweight bottle designs with improved barrier properties.
- 2023: Growing adoption of plant-based polymers in specific beverage applications.
- 2024: Several mergers and acquisitions to consolidate the market and enhance technological capabilities.
In-Depth Beverages Plastic Bottles Market Outlook
The Beverages Plastic Bottles market presents significant growth potential over the next decade, driven by a combination of factors, including sustained demand for convenient beverage packaging, innovation in sustainable materials, and strategic partnerships across the value chain. Companies focusing on sustainable solutions, efficient supply chains, and customer-centric innovation are best positioned to capitalize on future opportunities. Further penetration in emerging markets and the development of innovative packaging designs will significantly influence future market dynamics.
Beverages Plastic Bottles Segmentation
-
1. Application
- 1.1. Water
- 1.2. Juice
- 1.3. Carbonated Drinks
-
2. Types
- 2.1. PET
- 2.2. PP
Beverages Plastic Bottles Segmentation By Geography
-
1. North America
- 1.1. United States
- 1.2. Canada
- 1.3. Mexico
-
2. South America
- 2.1. Brazil
- 2.2. Argentina
- 2.3. Rest of South America
-
3. Europe
- 3.1. United Kingdom
- 3.2. Germany
- 3.3. France
- 3.4. Italy
- 3.5. Spain
- 3.6. Russia
- 3.7. Benelux
- 3.8. Nordics
- 3.9. Rest of Europe
-
4. Middle East & Africa
- 4.1. Turkey
- 4.2. Israel
- 4.3. GCC
- 4.4. North Africa
- 4.5. South Africa
- 4.6. Rest of Middle East & Africa
-
5. Asia Pacific
- 5.1. China
- 5.2. India
- 5.3. Japan
- 5.4. South Korea
- 5.5. ASEAN
- 5.6. Oceania
- 5.7. Rest of Asia Pacific
Beverages Plastic Bottles Regional Market Share
Geographic Coverage of Beverages Plastic Bottles
Beverages Plastic Bottles REPORT HIGHLIGHTS
| Aspects | Details |
|---|---|
| Study Period | 2020-2034 |
| Base Year | 2025 |
| Estimated Year | 2026 |
| Forecast Period | 2026-2034 |
| Historical Period | 2020-2025 |
| Growth Rate | CAGR of 4.39% from 2020-2034 |
| Segmentation |
|
Table of Contents
- 1. Introduction
- 1.1. Research Scope
- 1.2. Market Segmentation
- 1.3. Research Methodology
- 1.4. Definitions and Assumptions
- 2. Executive Summary
- 2.1. Introduction
- 3. Market Dynamics
- 3.1. Introduction
- 3.2. Market Drivers
- 3.3. Market Restrains
- 3.4. Market Trends
- 4. Market Factor Analysis
- 4.1. Porters Five Forces
- 4.2. Supply/Value Chain
- 4.3. PESTEL analysis
- 4.4. Market Entropy
- 4.5. Patent/Trademark Analysis
- 5. Global Beverages Plastic Bottles Analysis, Insights and Forecast, 2020-2032
- 5.1. Market Analysis, Insights and Forecast - by Application
- 5.1.1. Water
- 5.1.2. Juice
- 5.1.3. Carbonated Drinks
- 5.2. Market Analysis, Insights and Forecast - by Types
- 5.2.1. PET
- 5.2.2. PP
- 5.3. Market Analysis, Insights and Forecast - by Region
- 5.3.1. North America
- 5.3.2. South America
- 5.3.3. Europe
- 5.3.4. Middle East & Africa
- 5.3.5. Asia Pacific
- 5.1. Market Analysis, Insights and Forecast - by Application
- 6. North America Beverages Plastic Bottles Analysis, Insights and Forecast, 2020-2032
- 6.1. Market Analysis, Insights and Forecast - by Application
- 6.1.1. Water
- 6.1.2. Juice
- 6.1.3. Carbonated Drinks
- 6.2. Market Analysis, Insights and Forecast - by Types
- 6.2.1. PET
- 6.2.2. PP
- 6.1. Market Analysis, Insights and Forecast - by Application
- 7. South America Beverages Plastic Bottles Analysis, Insights and Forecast, 2020-2032
- 7.1. Market Analysis, Insights and Forecast - by Application
- 7.1.1. Water
- 7.1.2. Juice
- 7.1.3. Carbonated Drinks
- 7.2. Market Analysis, Insights and Forecast - by Types
- 7.2.1. PET
- 7.2.2. PP
- 7.1. Market Analysis, Insights and Forecast - by Application
- 8. Europe Beverages Plastic Bottles Analysis, Insights and Forecast, 2020-2032
- 8.1. Market Analysis, Insights and Forecast - by Application
- 8.1.1. Water
- 8.1.2. Juice
- 8.1.3. Carbonated Drinks
- 8.2. Market Analysis, Insights and Forecast - by Types
- 8.2.1. PET
- 8.2.2. PP
- 8.1. Market Analysis, Insights and Forecast - by Application
- 9. Middle East & Africa Beverages Plastic Bottles Analysis, Insights and Forecast, 2020-2032
- 9.1. Market Analysis, Insights and Forecast - by Application
- 9.1.1. Water
- 9.1.2. Juice
- 9.1.3. Carbonated Drinks
- 9.2. Market Analysis, Insights and Forecast - by Types
- 9.2.1. PET
- 9.2.2. PP
- 9.1. Market Analysis, Insights and Forecast - by Application
- 10. Asia Pacific Beverages Plastic Bottles Analysis, Insights and Forecast, 2020-2032
- 10.1. Market Analysis, Insights and Forecast - by Application
- 10.1.1. Water
- 10.1.2. Juice
- 10.1.3. Carbonated Drinks
- 10.2. Market Analysis, Insights and Forecast - by Types
- 10.2.1. PET
- 10.2.2. PP
- 10.1. Market Analysis, Insights and Forecast - by Application
- 11. Competitive Analysis
- 11.1. Global Market Share Analysis 2025
- 11.2. Company Profiles
- 11.2.1 ALPLA
- 11.2.1.1. Overview
- 11.2.1.2. Products
- 11.2.1.3. SWOT Analysis
- 11.2.1.4. Recent Developments
- 11.2.1.5. Financials (Based on Availability)
- 11.2.2 Amcor
- 11.2.2.1. Overview
- 11.2.2.2. Products
- 11.2.2.3. SWOT Analysis
- 11.2.2.4. Recent Developments
- 11.2.2.5. Financials (Based on Availability)
- 11.2.3 Plastipak Packaging
- 11.2.3.1. Overview
- 11.2.3.2. Products
- 11.2.3.3. SWOT Analysis
- 11.2.3.4. Recent Developments
- 11.2.3.5. Financials (Based on Availability)
- 11.2.4 Graham Packaging
- 11.2.4.1. Overview
- 11.2.4.2. Products
- 11.2.4.3. SWOT Analysis
- 11.2.4.4. Recent Developments
- 11.2.4.5. Financials (Based on Availability)
- 11.2.5 RPC Group
- 11.2.5.1. Overview
- 11.2.5.2. Products
- 11.2.5.3. SWOT Analysis
- 11.2.5.4. Recent Developments
- 11.2.5.5. Financials (Based on Availability)
- 11.2.6 Berry Plastics
- 11.2.6.1. Overview
- 11.2.6.2. Products
- 11.2.6.3. SWOT Analysis
- 11.2.6.4. Recent Developments
- 11.2.6.5. Financials (Based on Availability)
- 11.2.7 Greiner Packaging
- 11.2.7.1. Overview
- 11.2.7.2. Products
- 11.2.7.3. SWOT Analysis
- 11.2.7.4. Recent Developments
- 11.2.7.5. Financials (Based on Availability)
- 11.2.8 Alpha Packaging
- 11.2.8.1. Overview
- 11.2.8.2. Products
- 11.2.8.3. SWOT Analysis
- 11.2.8.4. Recent Developments
- 11.2.8.5. Financials (Based on Availability)
- 11.2.9 Zijiang
- 11.2.9.1. Overview
- 11.2.9.2. Products
- 11.2.9.3. SWOT Analysis
- 11.2.9.4. Recent Developments
- 11.2.9.5. Financials (Based on Availability)
- 11.2.10 Visy
- 11.2.10.1. Overview
- 11.2.10.2. Products
- 11.2.10.3. SWOT Analysis
- 11.2.10.4. Recent Developments
- 11.2.10.5. Financials (Based on Availability)
- 11.2.11 Zhongfu
- 11.2.11.1. Overview
- 11.2.11.2. Products
- 11.2.11.3. SWOT Analysis
- 11.2.11.4. Recent Developments
- 11.2.11.5. Financials (Based on Availability)
- 11.2.12 XLZT
- 11.2.12.1. Overview
- 11.2.12.2. Products
- 11.2.12.3. SWOT Analysis
- 11.2.12.4. Recent Developments
- 11.2.12.5. Financials (Based on Availability)
- 11.2.13 Polycon Industries
- 11.2.13.1. Overview
- 11.2.13.2. Products
- 11.2.13.3. SWOT Analysis
- 11.2.13.4. Recent Developments
- 11.2.13.5. Financials (Based on Availability)
- 11.2.14 KW Plastics
- 11.2.14.1. Overview
- 11.2.14.2. Products
- 11.2.14.3. SWOT Analysis
- 11.2.14.4. Recent Developments
- 11.2.14.5. Financials (Based on Availability)
- 11.2.15 Boxmore Packaging
- 11.2.15.1. Overview
- 11.2.15.2. Products
- 11.2.15.3. SWOT Analysis
- 11.2.15.4. Recent Developments
- 11.2.15.5. Financials (Based on Availability)
- 11.2.1 ALPLA
List of Figures
- Figure 1: Global Beverages Plastic Bottles Revenue Breakdown (billion, %) by Region 2025 & 2033
- Figure 2: Global Beverages Plastic Bottles Volume Breakdown (K, %) by Region 2025 & 2033
- Figure 3: North America Beverages Plastic Bottles Revenue (billion), by Application 2025 & 2033
- Figure 4: North America Beverages Plastic Bottles Volume (K), by Application 2025 & 2033
- Figure 5: North America Beverages Plastic Bottles Revenue Share (%), by Application 2025 & 2033
- Figure 6: North America Beverages Plastic Bottles Volume Share (%), by Application 2025 & 2033
- Figure 7: North America Beverages Plastic Bottles Revenue (billion), by Types 2025 & 2033
- Figure 8: North America Beverages Plastic Bottles Volume (K), by Types 2025 & 2033
- Figure 9: North America Beverages Plastic Bottles Revenue Share (%), by Types 2025 & 2033
- Figure 10: North America Beverages Plastic Bottles Volume Share (%), by Types 2025 & 2033
- Figure 11: North America Beverages Plastic Bottles Revenue (billion), by Country 2025 & 2033
- Figure 12: North America Beverages Plastic Bottles Volume (K), by Country 2025 & 2033
- Figure 13: North America Beverages Plastic Bottles Revenue Share (%), by Country 2025 & 2033
- Figure 14: North America Beverages Plastic Bottles Volume Share (%), by Country 2025 & 2033
- Figure 15: South America Beverages Plastic Bottles Revenue (billion), by Application 2025 & 2033
- Figure 16: South America Beverages Plastic Bottles Volume (K), by Application 2025 & 2033
- Figure 17: South America Beverages Plastic Bottles Revenue Share (%), by Application 2025 & 2033
- Figure 18: South America Beverages Plastic Bottles Volume Share (%), by Application 2025 & 2033
- Figure 19: South America Beverages Plastic Bottles Revenue (billion), by Types 2025 & 2033
- Figure 20: South America Beverages Plastic Bottles Volume (K), by Types 2025 & 2033
- Figure 21: South America Beverages Plastic Bottles Revenue Share (%), by Types 2025 & 2033
- Figure 22: South America Beverages Plastic Bottles Volume Share (%), by Types 2025 & 2033
- Figure 23: South America Beverages Plastic Bottles Revenue (billion), by Country 2025 & 2033
- Figure 24: South America Beverages Plastic Bottles Volume (K), by Country 2025 & 2033
- Figure 25: South America Beverages Plastic Bottles Revenue Share (%), by Country 2025 & 2033
- Figure 26: South America Beverages Plastic Bottles Volume Share (%), by Country 2025 & 2033
- Figure 27: Europe Beverages Plastic Bottles Revenue (billion), by Application 2025 & 2033
- Figure 28: Europe Beverages Plastic Bottles Volume (K), by Application 2025 & 2033
- Figure 29: Europe Beverages Plastic Bottles Revenue Share (%), by Application 2025 & 2033
- Figure 30: Europe Beverages Plastic Bottles Volume Share (%), by Application 2025 & 2033
- Figure 31: Europe Beverages Plastic Bottles Revenue (billion), by Types 2025 & 2033
- Figure 32: Europe Beverages Plastic Bottles Volume (K), by Types 2025 & 2033
- Figure 33: Europe Beverages Plastic Bottles Revenue Share (%), by Types 2025 & 2033
- Figure 34: Europe Beverages Plastic Bottles Volume Share (%), by Types 2025 & 2033
- Figure 35: Europe Beverages Plastic Bottles Revenue (billion), by Country 2025 & 2033
- Figure 36: Europe Beverages Plastic Bottles Volume (K), by Country 2025 & 2033
- Figure 37: Europe Beverages Plastic Bottles Revenue Share (%), by Country 2025 & 2033
- Figure 38: Europe Beverages Plastic Bottles Volume Share (%), by Country 2025 & 2033
- Figure 39: Middle East & Africa Beverages Plastic Bottles Revenue (billion), by Application 2025 & 2033
- Figure 40: Middle East & Africa Beverages Plastic Bottles Volume (K), by Application 2025 & 2033
- Figure 41: Middle East & Africa Beverages Plastic Bottles Revenue Share (%), by Application 2025 & 2033
- Figure 42: Middle East & Africa Beverages Plastic Bottles Volume Share (%), by Application 2025 & 2033
- Figure 43: Middle East & Africa Beverages Plastic Bottles Revenue (billion), by Types 2025 & 2033
- Figure 44: Middle East & Africa Beverages Plastic Bottles Volume (K), by Types 2025 & 2033
- Figure 45: Middle East & Africa Beverages Plastic Bottles Revenue Share (%), by Types 2025 & 2033
- Figure 46: Middle East & Africa Beverages Plastic Bottles Volume Share (%), by Types 2025 & 2033
- Figure 47: Middle East & Africa Beverages Plastic Bottles Revenue (billion), by Country 2025 & 2033
- Figure 48: Middle East & Africa Beverages Plastic Bottles Volume (K), by Country 2025 & 2033
- Figure 49: Middle East & Africa Beverages Plastic Bottles Revenue Share (%), by Country 2025 & 2033
- Figure 50: Middle East & Africa Beverages Plastic Bottles Volume Share (%), by Country 2025 & 2033
- Figure 51: Asia Pacific Beverages Plastic Bottles Revenue (billion), by Application 2025 & 2033
- Figure 52: Asia Pacific Beverages Plastic Bottles Volume (K), by Application 2025 & 2033
- Figure 53: Asia Pacific Beverages Plastic Bottles Revenue Share (%), by Application 2025 & 2033
- Figure 54: Asia Pacific Beverages Plastic Bottles Volume Share (%), by Application 2025 & 2033
- Figure 55: Asia Pacific Beverages Plastic Bottles Revenue (billion), by Types 2025 & 2033
- Figure 56: Asia Pacific Beverages Plastic Bottles Volume (K), by Types 2025 & 2033
- Figure 57: Asia Pacific Beverages Plastic Bottles Revenue Share (%), by Types 2025 & 2033
- Figure 58: Asia Pacific Beverages Plastic Bottles Volume Share (%), by Types 2025 & 2033
- Figure 59: Asia Pacific Beverages Plastic Bottles Revenue (billion), by Country 2025 & 2033
- Figure 60: Asia Pacific Beverages Plastic Bottles Volume (K), by Country 2025 & 2033
- Figure 61: Asia Pacific Beverages Plastic Bottles Revenue Share (%), by Country 2025 & 2033
- Figure 62: Asia Pacific Beverages Plastic Bottles Volume Share (%), by Country 2025 & 2033
List of Tables
- Table 1: Global Beverages Plastic Bottles Revenue billion Forecast, by Application 2020 & 2033
- Table 2: Global Beverages Plastic Bottles Volume K Forecast, by Application 2020 & 2033
- Table 3: Global Beverages Plastic Bottles Revenue billion Forecast, by Types 2020 & 2033
- Table 4: Global Beverages Plastic Bottles Volume K Forecast, by Types 2020 & 2033
- Table 5: Global Beverages Plastic Bottles Revenue billion Forecast, by Region 2020 & 2033
- Table 6: Global Beverages Plastic Bottles Volume K Forecast, by Region 2020 & 2033
- Table 7: Global Beverages Plastic Bottles Revenue billion Forecast, by Application 2020 & 2033
- Table 8: Global Beverages Plastic Bottles Volume K Forecast, by Application 2020 & 2033
- Table 9: Global Beverages Plastic Bottles Revenue billion Forecast, by Types 2020 & 2033
- Table 10: Global Beverages Plastic Bottles Volume K Forecast, by Types 2020 & 2033
- Table 11: Global Beverages Plastic Bottles Revenue billion Forecast, by Country 2020 & 2033
- Table 12: Global Beverages Plastic Bottles Volume K Forecast, by Country 2020 & 2033
- Table 13: United States Beverages Plastic Bottles Revenue (billion) Forecast, by Application 2020 & 2033
- Table 14: United States Beverages Plastic Bottles Volume (K) Forecast, by Application 2020 & 2033
- Table 15: Canada Beverages Plastic Bottles Revenue (billion) Forecast, by Application 2020 & 2033
- Table 16: Canada Beverages Plastic Bottles Volume (K) Forecast, by Application 2020 & 2033
- Table 17: Mexico Beverages Plastic Bottles Revenue (billion) Forecast, by Application 2020 & 2033
- Table 18: Mexico Beverages Plastic Bottles Volume (K) Forecast, by Application 2020 & 2033
- Table 19: Global Beverages Plastic Bottles Revenue billion Forecast, by Application 2020 & 2033
- Table 20: Global Beverages Plastic Bottles Volume K Forecast, by Application 2020 & 2033
- Table 21: Global Beverages Plastic Bottles Revenue billion Forecast, by Types 2020 & 2033
- Table 22: Global Beverages Plastic Bottles Volume K Forecast, by Types 2020 & 2033
- Table 23: Global Beverages Plastic Bottles Revenue billion Forecast, by Country 2020 & 2033
- Table 24: Global Beverages Plastic Bottles Volume K Forecast, by Country 2020 & 2033
- Table 25: Brazil Beverages Plastic Bottles Revenue (billion) Forecast, by Application 2020 & 2033
- Table 26: Brazil Beverages Plastic Bottles Volume (K) Forecast, by Application 2020 & 2033
- Table 27: Argentina Beverages Plastic Bottles Revenue (billion) Forecast, by Application 2020 & 2033
- Table 28: Argentina Beverages Plastic Bottles Volume (K) Forecast, by Application 2020 & 2033
- Table 29: Rest of South America Beverages Plastic Bottles Revenue (billion) Forecast, by Application 2020 & 2033
- Table 30: Rest of South America Beverages Plastic Bottles Volume (K) Forecast, by Application 2020 & 2033
- Table 31: Global Beverages Plastic Bottles Revenue billion Forecast, by Application 2020 & 2033
- Table 32: Global Beverages Plastic Bottles Volume K Forecast, by Application 2020 & 2033
- Table 33: Global Beverages Plastic Bottles Revenue billion Forecast, by Types 2020 & 2033
- Table 34: Global Beverages Plastic Bottles Volume K Forecast, by Types 2020 & 2033
- Table 35: Global Beverages Plastic Bottles Revenue billion Forecast, by Country 2020 & 2033
- Table 36: Global Beverages Plastic Bottles Volume K Forecast, by Country 2020 & 2033
- Table 37: United Kingdom Beverages Plastic Bottles Revenue (billion) Forecast, by Application 2020 & 2033
- Table 38: United Kingdom Beverages Plastic Bottles Volume (K) Forecast, by Application 2020 & 2033
- Table 39: Germany Beverages Plastic Bottles Revenue (billion) Forecast, by Application 2020 & 2033
- Table 40: Germany Beverages Plastic Bottles Volume (K) Forecast, by Application 2020 & 2033
- Table 41: France Beverages Plastic Bottles Revenue (billion) Forecast, by Application 2020 & 2033
- Table 42: France Beverages Plastic Bottles Volume (K) Forecast, by Application 2020 & 2033
- Table 43: Italy Beverages Plastic Bottles Revenue (billion) Forecast, by Application 2020 & 2033
- Table 44: Italy Beverages Plastic Bottles Volume (K) Forecast, by Application 2020 & 2033
- Table 45: Spain Beverages Plastic Bottles Revenue (billion) Forecast, by Application 2020 & 2033
- Table 46: Spain Beverages Plastic Bottles Volume (K) Forecast, by Application 2020 & 2033
- Table 47: Russia Beverages Plastic Bottles Revenue (billion) Forecast, by Application 2020 & 2033
- Table 48: Russia Beverages Plastic Bottles Volume (K) Forecast, by Application 2020 & 2033
- Table 49: Benelux Beverages Plastic Bottles Revenue (billion) Forecast, by Application 2020 & 2033
- Table 50: Benelux Beverages Plastic Bottles Volume (K) Forecast, by Application 2020 & 2033
- Table 51: Nordics Beverages Plastic Bottles Revenue (billion) Forecast, by Application 2020 & 2033
- Table 52: Nordics Beverages Plastic Bottles Volume (K) Forecast, by Application 2020 & 2033
- Table 53: Rest of Europe Beverages Plastic Bottles Revenue (billion) Forecast, by Application 2020 & 2033
- Table 54: Rest of Europe Beverages Plastic Bottles Volume (K) Forecast, by Application 2020 & 2033
- Table 55: Global Beverages Plastic Bottles Revenue billion Forecast, by Application 2020 & 2033
- Table 56: Global Beverages Plastic Bottles Volume K Forecast, by Application 2020 & 2033
- Table 57: Global Beverages Plastic Bottles Revenue billion Forecast, by Types 2020 & 2033
- Table 58: Global Beverages Plastic Bottles Volume K Forecast, by Types 2020 & 2033
- Table 59: Global Beverages Plastic Bottles Revenue billion Forecast, by Country 2020 & 2033
- Table 60: Global Beverages Plastic Bottles Volume K Forecast, by Country 2020 & 2033
- Table 61: Turkey Beverages Plastic Bottles Revenue (billion) Forecast, by Application 2020 & 2033
- Table 62: Turkey Beverages Plastic Bottles Volume (K) Forecast, by Application 2020 & 2033
- Table 63: Israel Beverages Plastic Bottles Revenue (billion) Forecast, by Application 2020 & 2033
- Table 64: Israel Beverages Plastic Bottles Volume (K) Forecast, by Application 2020 & 2033
- Table 65: GCC Beverages Plastic Bottles Revenue (billion) Forecast, by Application 2020 & 2033
- Table 66: GCC Beverages Plastic Bottles Volume (K) Forecast, by Application 2020 & 2033
- Table 67: North Africa Beverages Plastic Bottles Revenue (billion) Forecast, by Application 2020 & 2033
- Table 68: North Africa Beverages Plastic Bottles Volume (K) Forecast, by Application 2020 & 2033
- Table 69: South Africa Beverages Plastic Bottles Revenue (billion) Forecast, by Application 2020 & 2033
- Table 70: South Africa Beverages Plastic Bottles Volume (K) Forecast, by Application 2020 & 2033
- Table 71: Rest of Middle East & Africa Beverages Plastic Bottles Revenue (billion) Forecast, by Application 2020 & 2033
- Table 72: Rest of Middle East & Africa Beverages Plastic Bottles Volume (K) Forecast, by Application 2020 & 2033
- Table 73: Global Beverages Plastic Bottles Revenue billion Forecast, by Application 2020 & 2033
- Table 74: Global Beverages Plastic Bottles Volume K Forecast, by Application 2020 & 2033
- Table 75: Global Beverages Plastic Bottles Revenue billion Forecast, by Types 2020 & 2033
- Table 76: Global Beverages Plastic Bottles Volume K Forecast, by Types 2020 & 2033
- Table 77: Global Beverages Plastic Bottles Revenue billion Forecast, by Country 2020 & 2033
- Table 78: Global Beverages Plastic Bottles Volume K Forecast, by Country 2020 & 2033
- Table 79: China Beverages Plastic Bottles Revenue (billion) Forecast, by Application 2020 & 2033
- Table 80: China Beverages Plastic Bottles Volume (K) Forecast, by Application 2020 & 2033
- Table 81: India Beverages Plastic Bottles Revenue (billion) Forecast, by Application 2020 & 2033
- Table 82: India Beverages Plastic Bottles Volume (K) Forecast, by Application 2020 & 2033
- Table 83: Japan Beverages Plastic Bottles Revenue (billion) Forecast, by Application 2020 & 2033
- Table 84: Japan Beverages Plastic Bottles Volume (K) Forecast, by Application 2020 & 2033
- Table 85: South Korea Beverages Plastic Bottles Revenue (billion) Forecast, by Application 2020 & 2033
- Table 86: South Korea Beverages Plastic Bottles Volume (K) Forecast, by Application 2020 & 2033
- Table 87: ASEAN Beverages Plastic Bottles Revenue (billion) Forecast, by Application 2020 & 2033
- Table 88: ASEAN Beverages Plastic Bottles Volume (K) Forecast, by Application 2020 & 2033
- Table 89: Oceania Beverages Plastic Bottles Revenue (billion) Forecast, by Application 2020 & 2033
- Table 90: Oceania Beverages Plastic Bottles Volume (K) Forecast, by Application 2020 & 2033
- Table 91: Rest of Asia Pacific Beverages Plastic Bottles Revenue (billion) Forecast, by Application 2020 & 2033
- Table 92: Rest of Asia Pacific Beverages Plastic Bottles Volume (K) Forecast, by Application 2020 & 2033
Frequently Asked Questions
1. What is the projected Compound Annual Growth Rate (CAGR) of the Beverages Plastic Bottles?
The projected CAGR is approximately 4.39%.
2. Which companies are prominent players in the Beverages Plastic Bottles?
Key companies in the market include ALPLA, Amcor, Plastipak Packaging, Graham Packaging, RPC Group, Berry Plastics, Greiner Packaging, Alpha Packaging, Zijiang, Visy, Zhongfu, XLZT, Polycon Industries, KW Plastics, Boxmore Packaging.
3. What are the main segments of the Beverages Plastic Bottles?
The market segments include Application, Types.
4. Can you provide details about the market size?
The market size is estimated to be USD 9.71 billion as of 2022.
5. What are some drivers contributing to market growth?
N/A
6. What are the notable trends driving market growth?
N/A
7. Are there any restraints impacting market growth?
N/A
8. Can you provide examples of recent developments in the market?
N/A
9. What pricing options are available for accessing the report?
Pricing options include single-user, multi-user, and enterprise licenses priced at USD 3350.00, USD 5025.00, and USD 6700.00 respectively.
10. Is the market size provided in terms of value or volume?
The market size is provided in terms of value, measured in billion and volume, measured in K.
11. Are there any specific market keywords associated with the report?
Yes, the market keyword associated with the report is "Beverages Plastic Bottles," which aids in identifying and referencing the specific market segment covered.
12. How do I determine which pricing option suits my needs best?
The pricing options vary based on user requirements and access needs. Individual users may opt for single-user licenses, while businesses requiring broader access may choose multi-user or enterprise licenses for cost-effective access to the report.
13. Are there any additional resources or data provided in the Beverages Plastic Bottles report?
While the report offers comprehensive insights, it's advisable to review the specific contents or supplementary materials provided to ascertain if additional resources or data are available.
14. How can I stay updated on further developments or reports in the Beverages Plastic Bottles?
To stay informed about further developments, trends, and reports in the Beverages Plastic Bottles, consider subscribing to industry newsletters, following relevant companies and organizations, or regularly checking reputable industry news sources and publications.
Methodology
Step 1 - Identification of Relevant Samples Size from Population Database


Step 2 - Approaches for Defining Global Market Size (Value, Volume* & Price*)

Note*: In applicable scenarios
Step 3 - Data Sources
Primary Research
- Web Analytics
- Survey Reports
- Research Institute
- Latest Research Reports
- Opinion Leaders
Secondary Research
- Annual Reports
- White Paper
- Latest Press Release
- Industry Association
- Paid Database
- Investor Presentations

Step 4 - Data Triangulation
Involves using different sources of information in order to increase the validity of a study
These sources are likely to be stakeholders in a program - participants, other researchers, program staff, other community members, and so on.
Then we put all data in single framework & apply various statistical tools to find out the dynamic on the market.
During the analysis stage, feedback from the stakeholder groups would be compared to determine areas of agreement as well as areas of divergence