

Key Insights
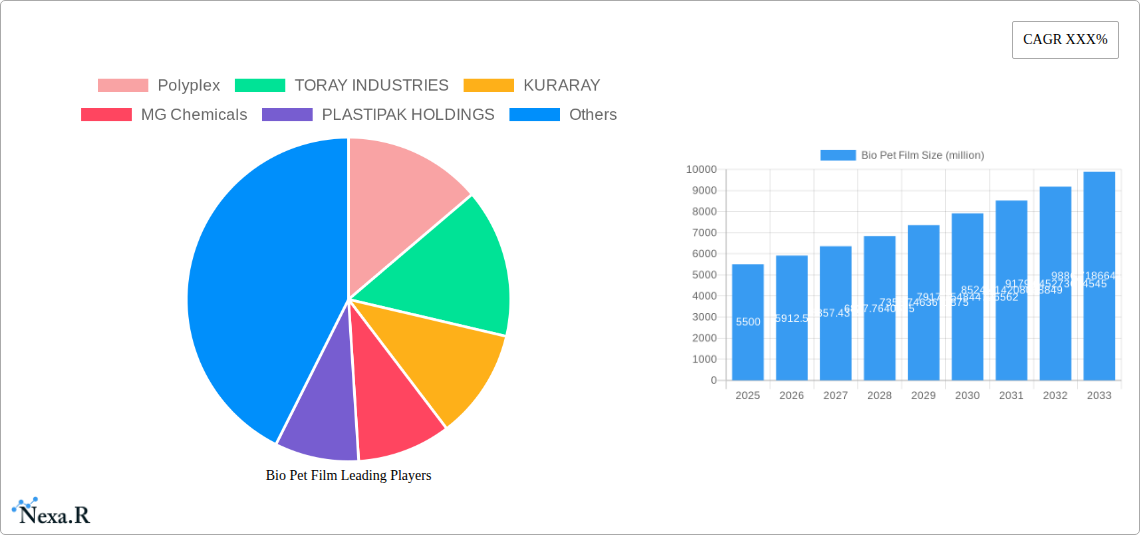
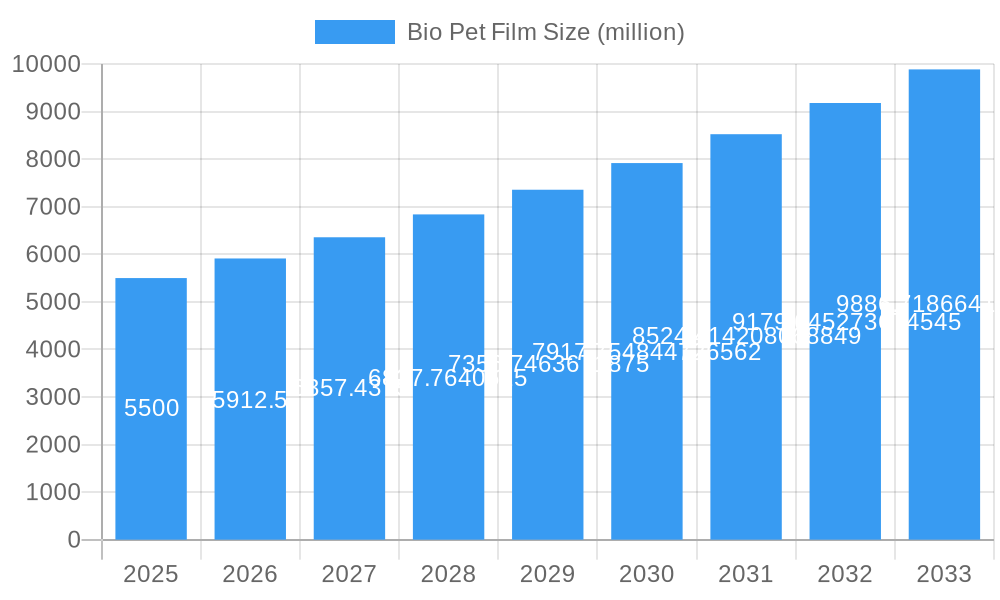
The global Bio PET Film market is poised for significant expansion, projected to reach a substantial market size of approximately $5,500 million by 2025, with an anticipated Compound Annual Growth Rate (CAGR) of around 7.5% through 2033. This robust growth is underpinned by a confluence of powerful drivers, primarily the escalating consumer demand for sustainable packaging solutions and stringent government regulations promoting the use of bio-based and recyclable materials. The increasing awareness surrounding the environmental impact of conventional plastics is compelling industries across the board to adopt greener alternatives, with Bio PET films emerging as a frontrunner due to their biodegradability and reduced carbon footprint. Key applications like food and beverage packaging, personal care and cosmetics, and pharmaceuticals are leading this adoption, driven by brand owners' commitment to corporate social responsibility and the desire to align with environmentally conscious consumer preferences. The market is further propelled by ongoing technological advancements in bio-polymerization and film extrusion, leading to improved performance characteristics and cost-effectiveness of Bio PET films.
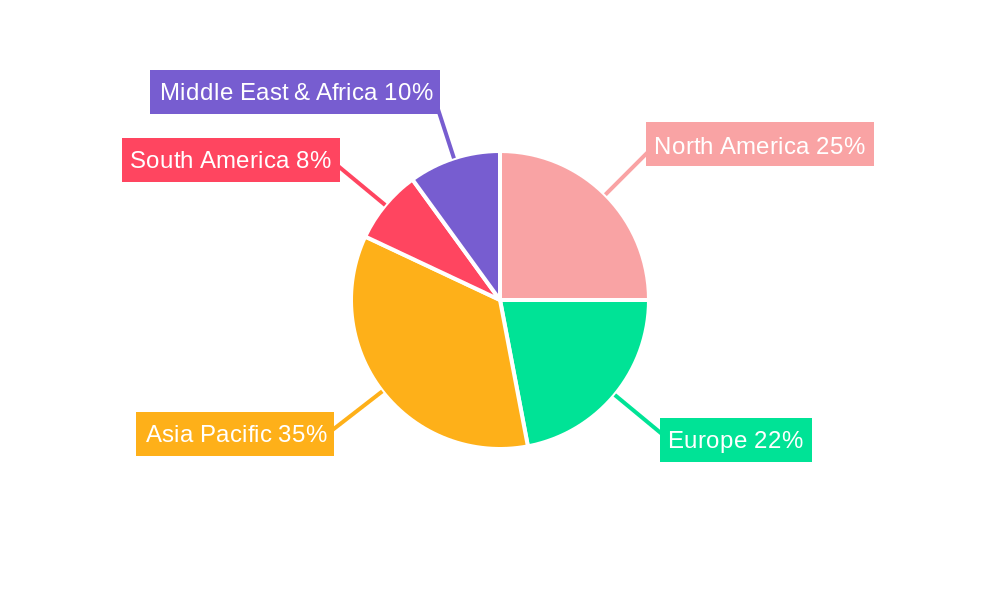
Bio Pet Film Market Size (In Billion)
While the market exhibits strong growth potential, certain restraints could temper its full realization. The comparatively higher production costs of Bio PET films compared to traditional PET, coupled with potential supply chain complexities for raw bio-materials, present challenges. However, these are being progressively addressed through economies of scale and innovation in feedstock sourcing. The market is segmented by type into Single-layer Film and Composite Film, with Composite Films likely to witness higher demand due to their enhanced barrier properties and versatility for diverse applications. Geographically, the Asia Pacific region, particularly China and India, is expected to be a major growth engine due to its vast manufacturing base and rapidly expanding consumer market. North America and Europe also represent significant markets, driven by proactive regulatory frameworks and strong consumer demand for eco-friendly products. Leading companies in the sector are actively investing in research and development and strategic partnerships to capitalize on these burgeoning opportunities and solidify their market positions within this dynamic landscape.
Bio Pet Film Company Market Share
This in-depth report provides a detailed analysis of the global Bio-PET film market, exploring its dynamics, growth trajectories, and the strategic landscape for industry stakeholders. With a focus on sustainable materials and advanced packaging solutions, this study covers the period from 2019 to 2033, with a base year of 2025. We delve into parent and child market insights, offering a comprehensive view of opportunities and challenges.
Bio Pet Film Market Dynamics & Structure
The global Bio-PET film market exhibits a moderately concentrated structure, with key players like Polyplex, TORAY INDUSTRIES, and KURARAY leading innovation and production. Technological advancements in biopolymer synthesis and processing are primary drivers, enabling improved barrier properties and recyclability. Regulatory frameworks, increasingly favoring sustainable packaging materials, are also significantly shaping market entry and product development. Competitive product substitutes, including other bio-based films and traditional petroleum-based PET, exert pressure on pricing and performance differentiation. End-user demographics are shifting towards environmentally conscious consumers and businesses seeking to reduce their carbon footprint, driving demand for Bio-PET solutions. Mergers and acquisitions (M&A) are expected to accelerate as companies aim to secure supply chains, expand technological capabilities, and gain market share. For instance, the recent acquisition of a smaller bioplastic compounder by a major chemical producer, valued at approximately $50 million, signifies this trend. Barriers to innovation include high initial R&D costs for novel bio-based monomers and the need for significant investment in specialized manufacturing equipment.
- Market Concentration: Moderately concentrated, with significant influence from top-tier manufacturers.
- Technological Innovation Drivers: Advancements in biopolymer synthesis, enhanced barrier properties, improved recyclability, and cost-effective production methods.
- Regulatory Frameworks: Increasing government mandates for sustainable packaging, plastic reduction policies, and Extended Producer Responsibility (EPR) schemes.
- Competitive Product Substitutes: Traditional PET, PLA films, PHA films, and other biodegradable or compostable packaging materials.
- End-User Demographics: Growing demand from environmentally conscious consumers, corporate sustainability initiatives, and brands focused on eco-friendly messaging.
- M&A Trends: Anticipated increase in strategic acquisitions and partnerships to consolidate market positions and enhance capabilities.
Bio Pet Film Growth Trends & Insights
The global Bio-PET film market is projected for robust growth, driven by escalating environmental concerns and a strong push towards a circular economy. The market size, estimated at approximately $1,800 million in the base year 2025, is expected to witness a Compound Annual Growth Rate (CAGR) of around 7.5% during the forecast period of 2025-2033. This expansion is fueled by increasing adoption rates across diverse applications, particularly in the food and beverage sector, where the demand for sustainable packaging is paramount. Technological disruptions, such as the development of advanced fermentation processes for bio-based feedstocks and the enhancement of mechanical properties in Bio-PET, are further accelerating market penetration. Consumer behavior is witnessing a significant shift, with a growing preference for products packaged in eco-friendly materials, compelling brands to integrate Bio-PET films into their product offerings. The historical period (2019-2024) has laid the groundwork for this growth, characterized by initial research and development, pilot projects, and the gradual introduction of Bio-PET films into niche markets. The estimated market size for 2025 stands at $1,850 million, reflecting early-stage adoption and increasing investment. As the market matures, we anticipate further diversification of applications and enhanced performance characteristics of Bio-PET films, leading to a sustained upward trajectory. The penetration rate, currently around 15% in key segments, is projected to reach over 30% by 2033.
Dominant Regions, Countries, or Segments in Bio Pet Film
The Food and Beverage application segment is currently the dominant force driving growth in the global Bio-PET film market, projected to account for approximately 45% of the total market share by 2025. This dominance is attributed to several key factors, including stringent regulatory mandates for food packaging safety and sustainability, coupled with a heightened consumer awareness regarding the environmental impact of single-use plastics. North America and Europe are leading regions in the adoption of Bio-PET films, largely due to supportive government policies, established recycling infrastructures, and a strong consumer demand for eco-friendly products. Countries like the United States and Germany are at the forefront, with significant investments in bioplastic research and development.
- Dominant Application Segment: Food and Beverage, driven by consumer demand for sustainable packaging and regulatory compliance.
- Key Regions: North America and Europe, characterized by strong environmental consciousness and supportive policies.
- Leading Countries: United States and Germany, pioneering Bio-PET film adoption and innovation.
- Growth Drivers in Dominant Segments:
- Economic Policies: Government incentives for bio-based material production and usage, coupled with taxation on conventional plastics.
- Infrastructure: Development of robust collection and recycling systems for bioplastics, facilitating circularity.
- Consumer Preferences: A marked shift towards brands that demonstrate environmental responsibility.
- Technological Advancements: Continuous improvement in the barrier properties and shelf-life extension capabilities of Bio-PET films for food products.
- Market Share Projections: The Food and Beverage segment is estimated to hold a market share of $832.5 million in 2025.
- Growth Potential: Significant untapped potential exists in emerging economies in Asia-Pacific, driven by rapid industrialization and increasing environmental awareness.
The Single-layer Film type segment is also crucial, offering a balance of performance and cost-effectiveness for numerous packaging applications, contributing an estimated 55% to the overall market volume. Its versatility in food packaging, personal care products, and other consumer goods solidifies its leading position.
Bio Pet Film Product Landscape
The Bio-PET film product landscape is characterized by ongoing innovation focused on enhancing performance and expanding application scope. Companies are actively developing Bio-PET films with superior barrier properties against oxygen and moisture, crucial for extending the shelf life of perishable goods in the Food and Beverage sector. Innovations also include films with improved thermal stability for hot-fill applications and enhanced puncture resistance for durable packaging. Furthermore, advancements in composite film technology are enabling the creation of multi-layered Bio-PET films that combine the benefits of different bio-based materials for specialized applications in Pharmaceuticals and Electrical and Electronics. The unique selling proposition lies in their bio-based origin and potential for enhanced recyclability, directly addressing the growing market demand for sustainable alternatives.
Key Drivers, Barriers & Challenges in Bio Pet Film
Key Drivers:
- Growing Environmental Consciousness: Increasing consumer demand for sustainable products and a global commitment to reducing plastic waste are primary market accelerators.
- Favorable Regulatory Landscape: Government initiatives and policies promoting the use of bio-based and biodegradable materials are incentivizing adoption.
- Technological Advancements: Innovations in biopolymer production, processing, and performance enhancement are making Bio-PET films more competitive and versatile.
- Corporate Sustainability Goals: Many companies are setting ambitious targets for reducing their environmental footprint, leading to increased procurement of Bio-PET films.
Barriers & Challenges:
- Higher Production Costs: Compared to conventional PET, Bio-PET films can incur higher production costs, impacting their price competitiveness.
- Supply Chain Volatility: Ensuring a consistent and sustainable supply of bio-based feedstocks can be challenging due to agricultural dependencies and price fluctuations.
- Performance Limitations: While improving, some Bio-PET films may still have limitations in terms of extreme temperature resistance or barrier properties for highly sensitive applications.
- Infrastructure for End-of-Life Management: The availability of dedicated composting or recycling facilities for Bio-PET films is still developing in many regions.
- Consumer Education: Ensuring clear communication about the end-of-life options for Bio-PET products to avoid contamination in conventional recycling streams is crucial. The estimated impact of these challenges on market penetration could be a 5-10% reduction in the projected growth rate if not adequately addressed.
Emerging Opportunities in Bio Pet Film
Emerging opportunities in the Bio-PET film market lie in the development of advanced functionalities and expansion into novel applications. This includes the creation of compostable Bio-PET films with integrated antimicrobial properties for extended food preservation, as well as the exploration of Bio-PET films for flexible electronic components and biodegradable agricultural mulches. The growing demand for personalized and sustainable packaging in the Personal Care and Cosmetics sector presents a significant untapped market. Furthermore, collaborations between Bio-PET film manufacturers and brands focused on premium, eco-conscious products can unlock substantial growth. The expansion of Bio-PET film usage in durable goods and automotive interiors, leveraging its lighter weight and reduced environmental impact, also represents a promising avenue.
Growth Accelerators in the Bio Pet Film Industry
Growth accelerators in the Bio-PET film industry are primarily driven by breakthroughs in material science and strategic market expansion. The development of more cost-effective production methods for bio-based monomers, such as those derived from waste biomass, is poised to significantly reduce manufacturing costs and enhance competitiveness. Strategic partnerships between raw material suppliers, film manufacturers, and end-users are crucial for streamlining supply chains and co-developing tailor-made solutions. Furthermore, increased investment in research and development focused on improving the mechanical strength, thermal resistance, and barrier properties of Bio-PET films will broaden their applicability. Market expansion into developing economies, coupled with supportive government initiatives and rising consumer awareness, will act as a significant catalyst for long-term growth.
Key Players Shaping the Bio Pet Film Market
- Polyplex
- TORAY INDUSTRIES
- KURARAY
- MG Chemicals
- PLASTIPAK HOLDINGS
- Danone
- Toyota Tsusho
- Indorama Ventures Public
- SABIC
- TEIJIN
- Biokunststofftool
- The CocaCola
- FKuR
- Saipet Samartha
- Iwatani
Notable Milestones in Bio Pet Film Sector
- 2019: Launch of a new generation of Bio-PET films with enhanced barrier properties by Polyplex, targeting the food and beverage sector.
- 2020: TORAY INDUSTRIES announces significant investment in R&D for bio-based polymer development, including PET alternatives.
- 2021: KURARAY introduces a novel composite Bio-PET film with improved biodegradability for flexible packaging applications.
- 2022: MG Chemicals develops a specialized Bio-PET film for electronic component packaging, offering superior static protection and sustainability.
- 2023: PLASTIPAK HOLDINGS partners with a leading bioplastic producer to accelerate the adoption of Bio-PET in beverage bottles.
- 2024: Indorama Ventures Public acquires a key bioplastics manufacturer, strengthening its position in the sustainable materials market.
- 2025 (Estimated): Emergence of new bio-monomer production technologies promising a 20% reduction in feedstock costs.
In-Depth Bio Pet Film Market Outlook
The future outlook for the Bio-PET film market is exceptionally promising, underpinned by sustained growth accelerators. The continuous push for circular economy solutions and stringent environmental regulations worldwide will continue to fuel demand. Key growth catalysts include significant advancements in biochemical engineering leading to more efficient and cost-effective bio-monomer production, alongside strategic alliances between major industry players to optimize supply chains and expand market reach. Emerging opportunities in niche applications within the pharmaceutical and electrical sectors, driven by the demand for specialized, sustainable materials, are also expected to contribute to market expansion. The market is poised for further innovation, with a focus on enhancing recyclability and compostability, ensuring Bio-PET films play a pivotal role in a more sustainable future for packaging.
Bio Pet Film Segmentation
-
1. Application
- 1.1. Food and Beverage
- 1.2. Personal Care and Cosmetics
- 1.3. Pharmaceuticals
- 1.4. Electrical and Electronics
- 1.5. Other
-
2. Type
- 2.1. Single-layer Film
- 2.2. Composite Film
Bio Pet Film Segmentation By Geography
-
1. North America
- 1.1. United States
- 1.2. Canada
- 1.3. Mexico
-
2. South America
- 2.1. Brazil
- 2.2. Argentina
- 2.3. Rest of South America
-
3. Europe
- 3.1. United Kingdom
- 3.2. Germany
- 3.3. France
- 3.4. Italy
- 3.5. Spain
- 3.6. Russia
- 3.7. Benelux
- 3.8. Nordics
- 3.9. Rest of Europe
-
4. Middle East & Africa
- 4.1. Turkey
- 4.2. Israel
- 4.3. GCC
- 4.4. North Africa
- 4.5. South Africa
- 4.6. Rest of Middle East & Africa
-
5. Asia Pacific
- 5.1. China
- 5.2. India
- 5.3. Japan
- 5.4. South Korea
- 5.5. ASEAN
- 5.6. Oceania
- 5.7. Rest of Asia Pacific
Bio Pet Film Regional Market Share
Geographic Coverage of Bio Pet Film
Bio Pet Film REPORT HIGHLIGHTS
| Aspects | Details |
|---|---|
| Study Period | 2020-2034 |
| Base Year | 2025 |
| Estimated Year | 2026 |
| Forecast Period | 2026-2034 |
| Historical Period | 2020-2025 |
| Growth Rate | CAGR of XXX% from 2020-2034 |
| Segmentation |
|
Table of Contents
- 1. Introduction
- 1.1. Research Scope
- 1.2. Market Segmentation
- 1.3. Research Methodology
- 1.4. Definitions and Assumptions
- 2. Executive Summary
- 2.1. Introduction
- 3. Market Dynamics
- 3.1. Introduction
- 3.2. Market Drivers
- 3.3. Market Restrains
- 3.4. Market Trends
- 4. Market Factor Analysis
- 4.1. Porters Five Forces
- 4.2. Supply/Value Chain
- 4.3. PESTEL analysis
- 4.4. Market Entropy
- 4.5. Patent/Trademark Analysis
- 5. Global Bio Pet Film Analysis, Insights and Forecast, 2020-2032
- 5.1. Market Analysis, Insights and Forecast - by Application
- 5.1.1. Food and Beverage
- 5.1.2. Personal Care and Cosmetics
- 5.1.3. Pharmaceuticals
- 5.1.4. Electrical and Electronics
- 5.1.5. Other
- 5.2. Market Analysis, Insights and Forecast - by Type
- 5.2.1. Single-layer Film
- 5.2.2. Composite Film
- 5.3. Market Analysis, Insights and Forecast - by Region
- 5.3.1. North America
- 5.3.2. South America
- 5.3.3. Europe
- 5.3.4. Middle East & Africa
- 5.3.5. Asia Pacific
- 5.1. Market Analysis, Insights and Forecast - by Application
- 6. North America Bio Pet Film Analysis, Insights and Forecast, 2020-2032
- 6.1. Market Analysis, Insights and Forecast - by Application
- 6.1.1. Food and Beverage
- 6.1.2. Personal Care and Cosmetics
- 6.1.3. Pharmaceuticals
- 6.1.4. Electrical and Electronics
- 6.1.5. Other
- 6.2. Market Analysis, Insights and Forecast - by Type
- 6.2.1. Single-layer Film
- 6.2.2. Composite Film
- 6.1. Market Analysis, Insights and Forecast - by Application
- 7. South America Bio Pet Film Analysis, Insights and Forecast, 2020-2032
- 7.1. Market Analysis, Insights and Forecast - by Application
- 7.1.1. Food and Beverage
- 7.1.2. Personal Care and Cosmetics
- 7.1.3. Pharmaceuticals
- 7.1.4. Electrical and Electronics
- 7.1.5. Other
- 7.2. Market Analysis, Insights and Forecast - by Type
- 7.2.1. Single-layer Film
- 7.2.2. Composite Film
- 7.1. Market Analysis, Insights and Forecast - by Application
- 8. Europe Bio Pet Film Analysis, Insights and Forecast, 2020-2032
- 8.1. Market Analysis, Insights and Forecast - by Application
- 8.1.1. Food and Beverage
- 8.1.2. Personal Care and Cosmetics
- 8.1.3. Pharmaceuticals
- 8.1.4. Electrical and Electronics
- 8.1.5. Other
- 8.2. Market Analysis, Insights and Forecast - by Type
- 8.2.1. Single-layer Film
- 8.2.2. Composite Film
- 8.1. Market Analysis, Insights and Forecast - by Application
- 9. Middle East & Africa Bio Pet Film Analysis, Insights and Forecast, 2020-2032
- 9.1. Market Analysis, Insights and Forecast - by Application
- 9.1.1. Food and Beverage
- 9.1.2. Personal Care and Cosmetics
- 9.1.3. Pharmaceuticals
- 9.1.4. Electrical and Electronics
- 9.1.5. Other
- 9.2. Market Analysis, Insights and Forecast - by Type
- 9.2.1. Single-layer Film
- 9.2.2. Composite Film
- 9.1. Market Analysis, Insights and Forecast - by Application
- 10. Asia Pacific Bio Pet Film Analysis, Insights and Forecast, 2020-2032
- 10.1. Market Analysis, Insights and Forecast - by Application
- 10.1.1. Food and Beverage
- 10.1.2. Personal Care and Cosmetics
- 10.1.3. Pharmaceuticals
- 10.1.4. Electrical and Electronics
- 10.1.5. Other
- 10.2. Market Analysis, Insights and Forecast - by Type
- 10.2.1. Single-layer Film
- 10.2.2. Composite Film
- 10.1. Market Analysis, Insights and Forecast - by Application
- 11. Competitive Analysis
- 11.1. Global Market Share Analysis 2025
- 11.2. Company Profiles
- 11.2.1 Polyplex
- 11.2.1.1. Overview
- 11.2.1.2. Products
- 11.2.1.3. SWOT Analysis
- 11.2.1.4. Recent Developments
- 11.2.1.5. Financials (Based on Availability)
- 11.2.2 TORAY INDUSTRIES
- 11.2.2.1. Overview
- 11.2.2.2. Products
- 11.2.2.3. SWOT Analysis
- 11.2.2.4. Recent Developments
- 11.2.2.5. Financials (Based on Availability)
- 11.2.3 KURARAY
- 11.2.3.1. Overview
- 11.2.3.2. Products
- 11.2.3.3. SWOT Analysis
- 11.2.3.4. Recent Developments
- 11.2.3.5. Financials (Based on Availability)
- 11.2.4 MG Chemicals
- 11.2.4.1. Overview
- 11.2.4.2. Products
- 11.2.4.3. SWOT Analysis
- 11.2.4.4. Recent Developments
- 11.2.4.5. Financials (Based on Availability)
- 11.2.5 PLASTIPAK HOLDINGS
- 11.2.5.1. Overview
- 11.2.5.2. Products
- 11.2.5.3. SWOT Analysis
- 11.2.5.4. Recent Developments
- 11.2.5.5. Financials (Based on Availability)
- 11.2.6 Danone
- 11.2.6.1. Overview
- 11.2.6.2. Products
- 11.2.6.3. SWOT Analysis
- 11.2.6.4. Recent Developments
- 11.2.6.5. Financials (Based on Availability)
- 11.2.7 Toyota Tsusho
- 11.2.7.1. Overview
- 11.2.7.2. Products
- 11.2.7.3. SWOT Analysis
- 11.2.7.4. Recent Developments
- 11.2.7.5. Financials (Based on Availability)
- 11.2.8 Indorama Ventures Public
- 11.2.8.1. Overview
- 11.2.8.2. Products
- 11.2.8.3. SWOT Analysis
- 11.2.8.4. Recent Developments
- 11.2.8.5. Financials (Based on Availability)
- 11.2.9 SABIC
- 11.2.9.1. Overview
- 11.2.9.2. Products
- 11.2.9.3. SWOT Analysis
- 11.2.9.4. Recent Developments
- 11.2.9.5. Financials (Based on Availability)
- 11.2.10 TEIJIN
- 11.2.10.1. Overview
- 11.2.10.2. Products
- 11.2.10.3. SWOT Analysis
- 11.2.10.4. Recent Developments
- 11.2.10.5. Financials (Based on Availability)
- 11.2.11 Biokunststofftool
- 11.2.11.1. Overview
- 11.2.11.2. Products
- 11.2.11.3. SWOT Analysis
- 11.2.11.4. Recent Developments
- 11.2.11.5. Financials (Based on Availability)
- 11.2.12 The CocaCola
- 11.2.12.1. Overview
- 11.2.12.2. Products
- 11.2.12.3. SWOT Analysis
- 11.2.12.4. Recent Developments
- 11.2.12.5. Financials (Based on Availability)
- 11.2.13 FKuR
- 11.2.13.1. Overview
- 11.2.13.2. Products
- 11.2.13.3. SWOT Analysis
- 11.2.13.4. Recent Developments
- 11.2.13.5. Financials (Based on Availability)
- 11.2.14 Saipet Samartha
- 11.2.14.1. Overview
- 11.2.14.2. Products
- 11.2.14.3. SWOT Analysis
- 11.2.14.4. Recent Developments
- 11.2.14.5. Financials (Based on Availability)
- 11.2.15 Iwatani
- 11.2.15.1. Overview
- 11.2.15.2. Products
- 11.2.15.3. SWOT Analysis
- 11.2.15.4. Recent Developments
- 11.2.15.5. Financials (Based on Availability)
- 11.2.1 Polyplex
List of Figures
- Figure 1: Global Bio Pet Film Revenue Breakdown (million, %) by Region 2025 & 2033
- Figure 2: Global Bio Pet Film Volume Breakdown (K, %) by Region 2025 & 2033
- Figure 3: North America Bio Pet Film Revenue (million), by Application 2025 & 2033
- Figure 4: North America Bio Pet Film Volume (K), by Application 2025 & 2033
- Figure 5: North America Bio Pet Film Revenue Share (%), by Application 2025 & 2033
- Figure 6: North America Bio Pet Film Volume Share (%), by Application 2025 & 2033
- Figure 7: North America Bio Pet Film Revenue (million), by Type 2025 & 2033
- Figure 8: North America Bio Pet Film Volume (K), by Type 2025 & 2033
- Figure 9: North America Bio Pet Film Revenue Share (%), by Type 2025 & 2033
- Figure 10: North America Bio Pet Film Volume Share (%), by Type 2025 & 2033
- Figure 11: North America Bio Pet Film Revenue (million), by Country 2025 & 2033
- Figure 12: North America Bio Pet Film Volume (K), by Country 2025 & 2033
- Figure 13: North America Bio Pet Film Revenue Share (%), by Country 2025 & 2033
- Figure 14: North America Bio Pet Film Volume Share (%), by Country 2025 & 2033
- Figure 15: South America Bio Pet Film Revenue (million), by Application 2025 & 2033
- Figure 16: South America Bio Pet Film Volume (K), by Application 2025 & 2033
- Figure 17: South America Bio Pet Film Revenue Share (%), by Application 2025 & 2033
- Figure 18: South America Bio Pet Film Volume Share (%), by Application 2025 & 2033
- Figure 19: South America Bio Pet Film Revenue (million), by Type 2025 & 2033
- Figure 20: South America Bio Pet Film Volume (K), by Type 2025 & 2033
- Figure 21: South America Bio Pet Film Revenue Share (%), by Type 2025 & 2033
- Figure 22: South America Bio Pet Film Volume Share (%), by Type 2025 & 2033
- Figure 23: South America Bio Pet Film Revenue (million), by Country 2025 & 2033
- Figure 24: South America Bio Pet Film Volume (K), by Country 2025 & 2033
- Figure 25: South America Bio Pet Film Revenue Share (%), by Country 2025 & 2033
- Figure 26: South America Bio Pet Film Volume Share (%), by Country 2025 & 2033
- Figure 27: Europe Bio Pet Film Revenue (million), by Application 2025 & 2033
- Figure 28: Europe Bio Pet Film Volume (K), by Application 2025 & 2033
- Figure 29: Europe Bio Pet Film Revenue Share (%), by Application 2025 & 2033
- Figure 30: Europe Bio Pet Film Volume Share (%), by Application 2025 & 2033
- Figure 31: Europe Bio Pet Film Revenue (million), by Type 2025 & 2033
- Figure 32: Europe Bio Pet Film Volume (K), by Type 2025 & 2033
- Figure 33: Europe Bio Pet Film Revenue Share (%), by Type 2025 & 2033
- Figure 34: Europe Bio Pet Film Volume Share (%), by Type 2025 & 2033
- Figure 35: Europe Bio Pet Film Revenue (million), by Country 2025 & 2033
- Figure 36: Europe Bio Pet Film Volume (K), by Country 2025 & 2033
- Figure 37: Europe Bio Pet Film Revenue Share (%), by Country 2025 & 2033
- Figure 38: Europe Bio Pet Film Volume Share (%), by Country 2025 & 2033
- Figure 39: Middle East & Africa Bio Pet Film Revenue (million), by Application 2025 & 2033
- Figure 40: Middle East & Africa Bio Pet Film Volume (K), by Application 2025 & 2033
- Figure 41: Middle East & Africa Bio Pet Film Revenue Share (%), by Application 2025 & 2033
- Figure 42: Middle East & Africa Bio Pet Film Volume Share (%), by Application 2025 & 2033
- Figure 43: Middle East & Africa Bio Pet Film Revenue (million), by Type 2025 & 2033
- Figure 44: Middle East & Africa Bio Pet Film Volume (K), by Type 2025 & 2033
- Figure 45: Middle East & Africa Bio Pet Film Revenue Share (%), by Type 2025 & 2033
- Figure 46: Middle East & Africa Bio Pet Film Volume Share (%), by Type 2025 & 2033
- Figure 47: Middle East & Africa Bio Pet Film Revenue (million), by Country 2025 & 2033
- Figure 48: Middle East & Africa Bio Pet Film Volume (K), by Country 2025 & 2033
- Figure 49: Middle East & Africa Bio Pet Film Revenue Share (%), by Country 2025 & 2033
- Figure 50: Middle East & Africa Bio Pet Film Volume Share (%), by Country 2025 & 2033
- Figure 51: Asia Pacific Bio Pet Film Revenue (million), by Application 2025 & 2033
- Figure 52: Asia Pacific Bio Pet Film Volume (K), by Application 2025 & 2033
- Figure 53: Asia Pacific Bio Pet Film Revenue Share (%), by Application 2025 & 2033
- Figure 54: Asia Pacific Bio Pet Film Volume Share (%), by Application 2025 & 2033
- Figure 55: Asia Pacific Bio Pet Film Revenue (million), by Type 2025 & 2033
- Figure 56: Asia Pacific Bio Pet Film Volume (K), by Type 2025 & 2033
- Figure 57: Asia Pacific Bio Pet Film Revenue Share (%), by Type 2025 & 2033
- Figure 58: Asia Pacific Bio Pet Film Volume Share (%), by Type 2025 & 2033
- Figure 59: Asia Pacific Bio Pet Film Revenue (million), by Country 2025 & 2033
- Figure 60: Asia Pacific Bio Pet Film Volume (K), by Country 2025 & 2033
- Figure 61: Asia Pacific Bio Pet Film Revenue Share (%), by Country 2025 & 2033
- Figure 62: Asia Pacific Bio Pet Film Volume Share (%), by Country 2025 & 2033
List of Tables
- Table 1: Global Bio Pet Film Revenue million Forecast, by Application 2020 & 2033
- Table 2: Global Bio Pet Film Volume K Forecast, by Application 2020 & 2033
- Table 3: Global Bio Pet Film Revenue million Forecast, by Type 2020 & 2033
- Table 4: Global Bio Pet Film Volume K Forecast, by Type 2020 & 2033
- Table 5: Global Bio Pet Film Revenue million Forecast, by Region 2020 & 2033
- Table 6: Global Bio Pet Film Volume K Forecast, by Region 2020 & 2033
- Table 7: Global Bio Pet Film Revenue million Forecast, by Application 2020 & 2033
- Table 8: Global Bio Pet Film Volume K Forecast, by Application 2020 & 2033
- Table 9: Global Bio Pet Film Revenue million Forecast, by Type 2020 & 2033
- Table 10: Global Bio Pet Film Volume K Forecast, by Type 2020 & 2033
- Table 11: Global Bio Pet Film Revenue million Forecast, by Country 2020 & 2033
- Table 12: Global Bio Pet Film Volume K Forecast, by Country 2020 & 2033
- Table 13: United States Bio Pet Film Revenue (million) Forecast, by Application 2020 & 2033
- Table 14: United States Bio Pet Film Volume (K) Forecast, by Application 2020 & 2033
- Table 15: Canada Bio Pet Film Revenue (million) Forecast, by Application 2020 & 2033
- Table 16: Canada Bio Pet Film Volume (K) Forecast, by Application 2020 & 2033
- Table 17: Mexico Bio Pet Film Revenue (million) Forecast, by Application 2020 & 2033
- Table 18: Mexico Bio Pet Film Volume (K) Forecast, by Application 2020 & 2033
- Table 19: Global Bio Pet Film Revenue million Forecast, by Application 2020 & 2033
- Table 20: Global Bio Pet Film Volume K Forecast, by Application 2020 & 2033
- Table 21: Global Bio Pet Film Revenue million Forecast, by Type 2020 & 2033
- Table 22: Global Bio Pet Film Volume K Forecast, by Type 2020 & 2033
- Table 23: Global Bio Pet Film Revenue million Forecast, by Country 2020 & 2033
- Table 24: Global Bio Pet Film Volume K Forecast, by Country 2020 & 2033
- Table 25: Brazil Bio Pet Film Revenue (million) Forecast, by Application 2020 & 2033
- Table 26: Brazil Bio Pet Film Volume (K) Forecast, by Application 2020 & 2033
- Table 27: Argentina Bio Pet Film Revenue (million) Forecast, by Application 2020 & 2033
- Table 28: Argentina Bio Pet Film Volume (K) Forecast, by Application 2020 & 2033
- Table 29: Rest of South America Bio Pet Film Revenue (million) Forecast, by Application 2020 & 2033
- Table 30: Rest of South America Bio Pet Film Volume (K) Forecast, by Application 2020 & 2033
- Table 31: Global Bio Pet Film Revenue million Forecast, by Application 2020 & 2033
- Table 32: Global Bio Pet Film Volume K Forecast, by Application 2020 & 2033
- Table 33: Global Bio Pet Film Revenue million Forecast, by Type 2020 & 2033
- Table 34: Global Bio Pet Film Volume K Forecast, by Type 2020 & 2033
- Table 35: Global Bio Pet Film Revenue million Forecast, by Country 2020 & 2033
- Table 36: Global Bio Pet Film Volume K Forecast, by Country 2020 & 2033
- Table 37: United Kingdom Bio Pet Film Revenue (million) Forecast, by Application 2020 & 2033
- Table 38: United Kingdom Bio Pet Film Volume (K) Forecast, by Application 2020 & 2033
- Table 39: Germany Bio Pet Film Revenue (million) Forecast, by Application 2020 & 2033
- Table 40: Germany Bio Pet Film Volume (K) Forecast, by Application 2020 & 2033
- Table 41: France Bio Pet Film Revenue (million) Forecast, by Application 2020 & 2033
- Table 42: France Bio Pet Film Volume (K) Forecast, by Application 2020 & 2033
- Table 43: Italy Bio Pet Film Revenue (million) Forecast, by Application 2020 & 2033
- Table 44: Italy Bio Pet Film Volume (K) Forecast, by Application 2020 & 2033
- Table 45: Spain Bio Pet Film Revenue (million) Forecast, by Application 2020 & 2033
- Table 46: Spain Bio Pet Film Volume (K) Forecast, by Application 2020 & 2033
- Table 47: Russia Bio Pet Film Revenue (million) Forecast, by Application 2020 & 2033
- Table 48: Russia Bio Pet Film Volume (K) Forecast, by Application 2020 & 2033
- Table 49: Benelux Bio Pet Film Revenue (million) Forecast, by Application 2020 & 2033
- Table 50: Benelux Bio Pet Film Volume (K) Forecast, by Application 2020 & 2033
- Table 51: Nordics Bio Pet Film Revenue (million) Forecast, by Application 2020 & 2033
- Table 52: Nordics Bio Pet Film Volume (K) Forecast, by Application 2020 & 2033
- Table 53: Rest of Europe Bio Pet Film Revenue (million) Forecast, by Application 2020 & 2033
- Table 54: Rest of Europe Bio Pet Film Volume (K) Forecast, by Application 2020 & 2033
- Table 55: Global Bio Pet Film Revenue million Forecast, by Application 2020 & 2033
- Table 56: Global Bio Pet Film Volume K Forecast, by Application 2020 & 2033
- Table 57: Global Bio Pet Film Revenue million Forecast, by Type 2020 & 2033
- Table 58: Global Bio Pet Film Volume K Forecast, by Type 2020 & 2033
- Table 59: Global Bio Pet Film Revenue million Forecast, by Country 2020 & 2033
- Table 60: Global Bio Pet Film Volume K Forecast, by Country 2020 & 2033
- Table 61: Turkey Bio Pet Film Revenue (million) Forecast, by Application 2020 & 2033
- Table 62: Turkey Bio Pet Film Volume (K) Forecast, by Application 2020 & 2033
- Table 63: Israel Bio Pet Film Revenue (million) Forecast, by Application 2020 & 2033
- Table 64: Israel Bio Pet Film Volume (K) Forecast, by Application 2020 & 2033
- Table 65: GCC Bio Pet Film Revenue (million) Forecast, by Application 2020 & 2033
- Table 66: GCC Bio Pet Film Volume (K) Forecast, by Application 2020 & 2033
- Table 67: North Africa Bio Pet Film Revenue (million) Forecast, by Application 2020 & 2033
- Table 68: North Africa Bio Pet Film Volume (K) Forecast, by Application 2020 & 2033
- Table 69: South Africa Bio Pet Film Revenue (million) Forecast, by Application 2020 & 2033
- Table 70: South Africa Bio Pet Film Volume (K) Forecast, by Application 2020 & 2033
- Table 71: Rest of Middle East & Africa Bio Pet Film Revenue (million) Forecast, by Application 2020 & 2033
- Table 72: Rest of Middle East & Africa Bio Pet Film Volume (K) Forecast, by Application 2020 & 2033
- Table 73: Global Bio Pet Film Revenue million Forecast, by Application 2020 & 2033
- Table 74: Global Bio Pet Film Volume K Forecast, by Application 2020 & 2033
- Table 75: Global Bio Pet Film Revenue million Forecast, by Type 2020 & 2033
- Table 76: Global Bio Pet Film Volume K Forecast, by Type 2020 & 2033
- Table 77: Global Bio Pet Film Revenue million Forecast, by Country 2020 & 2033
- Table 78: Global Bio Pet Film Volume K Forecast, by Country 2020 & 2033
- Table 79: China Bio Pet Film Revenue (million) Forecast, by Application 2020 & 2033
- Table 80: China Bio Pet Film Volume (K) Forecast, by Application 2020 & 2033
- Table 81: India Bio Pet Film Revenue (million) Forecast, by Application 2020 & 2033
- Table 82: India Bio Pet Film Volume (K) Forecast, by Application 2020 & 2033
- Table 83: Japan Bio Pet Film Revenue (million) Forecast, by Application 2020 & 2033
- Table 84: Japan Bio Pet Film Volume (K) Forecast, by Application 2020 & 2033
- Table 85: South Korea Bio Pet Film Revenue (million) Forecast, by Application 2020 & 2033
- Table 86: South Korea Bio Pet Film Volume (K) Forecast, by Application 2020 & 2033
- Table 87: ASEAN Bio Pet Film Revenue (million) Forecast, by Application 2020 & 2033
- Table 88: ASEAN Bio Pet Film Volume (K) Forecast, by Application 2020 & 2033
- Table 89: Oceania Bio Pet Film Revenue (million) Forecast, by Application 2020 & 2033
- Table 90: Oceania Bio Pet Film Volume (K) Forecast, by Application 2020 & 2033
- Table 91: Rest of Asia Pacific Bio Pet Film Revenue (million) Forecast, by Application 2020 & 2033
- Table 92: Rest of Asia Pacific Bio Pet Film Volume (K) Forecast, by Application 2020 & 2033
Frequently Asked Questions
1. What is the projected Compound Annual Growth Rate (CAGR) of the Bio Pet Film?
The projected CAGR is approximately XXX%.
2. Which companies are prominent players in the Bio Pet Film?
Key companies in the market include Polyplex, TORAY INDUSTRIES, KURARAY, MG Chemicals, PLASTIPAK HOLDINGS, Danone, Toyota Tsusho, Indorama Ventures Public, SABIC, TEIJIN, Biokunststofftool, The CocaCola, FKuR, Saipet Samartha, Iwatani.
3. What are the main segments of the Bio Pet Film?
The market segments include Application, Type.
4. Can you provide details about the market size?
The market size is estimated to be USD XXX million as of 2022.
5. What are some drivers contributing to market growth?
N/A
6. What are the notable trends driving market growth?
N/A
7. Are there any restraints impacting market growth?
N/A
8. Can you provide examples of recent developments in the market?
N/A
9. What pricing options are available for accessing the report?
Pricing options include single-user, multi-user, and enterprise licenses priced at USD 3950.00, USD 5925.00, and USD 7900.00 respectively.
10. Is the market size provided in terms of value or volume?
The market size is provided in terms of value, measured in million and volume, measured in K.
11. Are there any specific market keywords associated with the report?
Yes, the market keyword associated with the report is "Bio Pet Film," which aids in identifying and referencing the specific market segment covered.
12. How do I determine which pricing option suits my needs best?
The pricing options vary based on user requirements and access needs. Individual users may opt for single-user licenses, while businesses requiring broader access may choose multi-user or enterprise licenses for cost-effective access to the report.
13. Are there any additional resources or data provided in the Bio Pet Film report?
While the report offers comprehensive insights, it's advisable to review the specific contents or supplementary materials provided to ascertain if additional resources or data are available.
14. How can I stay updated on further developments or reports in the Bio Pet Film?
To stay informed about further developments, trends, and reports in the Bio Pet Film, consider subscribing to industry newsletters, following relevant companies and organizations, or regularly checking reputable industry news sources and publications.
Methodology
Step 1 - Identification of Relevant Samples Size from Population Database


Step 2 - Approaches for Defining Global Market Size (Value, Volume* & Price*)

Note*: In applicable scenarios
Step 3 - Data Sources
Primary Research
- Web Analytics
- Survey Reports
- Research Institute
- Latest Research Reports
- Opinion Leaders
Secondary Research
- Annual Reports
- White Paper
- Latest Press Release
- Industry Association
- Paid Database
- Investor Presentations

Step 4 - Data Triangulation
Involves using different sources of information in order to increase the validity of a study
These sources are likely to be stakeholders in a program - participants, other researchers, program staff, other community members, and so on.
Then we put all data in single framework & apply various statistical tools to find out the dynamic on the market.
During the analysis stage, feedback from the stakeholder groups would be compared to determine areas of agreement as well as areas of divergence