

Key Insights
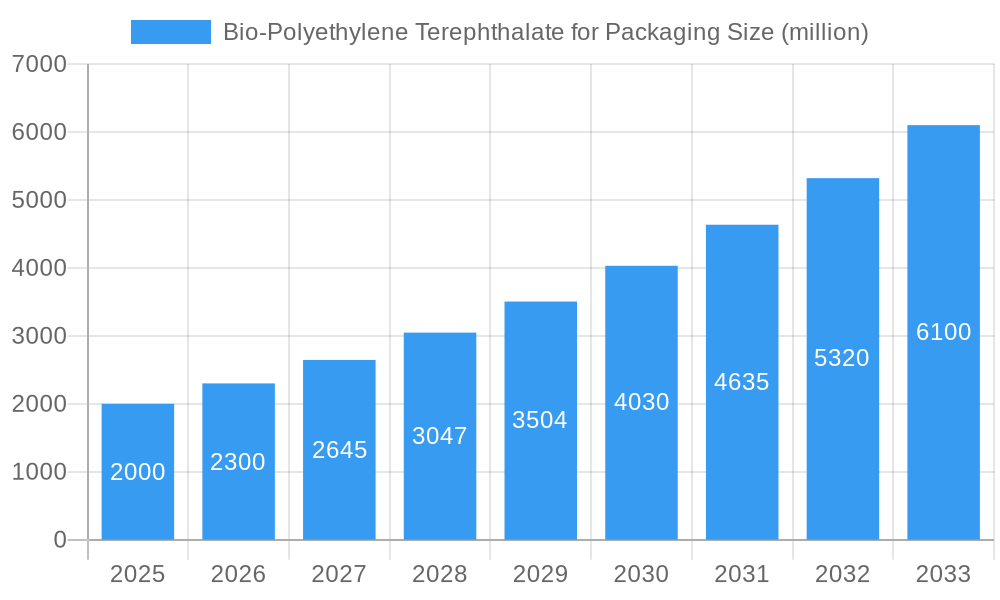
The bio-polyethylene terephthalate (bio-PET) for packaging market is experiencing significant growth, driven by the increasing demand for sustainable and eco-friendly packaging solutions. The rising consumer awareness regarding environmental issues and the stringent regulations imposed by governments worldwide on plastic waste are key factors propelling this market expansion. Major players like The Siam Cement Public Company, Teijin, Toray Industries, Gruppo Mossi Ghisolfi, and Toyota Tsusho are actively investing in research and development to improve the bio-PET's properties and reduce its production cost, thereby making it a more competitive alternative to conventional PET. The market is segmented by various factors, including type of packaging (bottles, films, etc.), application (food and beverages, personal care, etc.), and geographic region. While precise market sizing data is unavailable, a conservative estimate based on general industry growth trends in bioplastics suggests a market size of approximately $2 billion in 2025, with a Compound Annual Growth Rate (CAGR) of around 15% between 2025 and 2033, indicating robust future growth. This positive projection considers increasing production capacity, broadening applications across various industries, and escalating consumer preference for sustainable solutions.
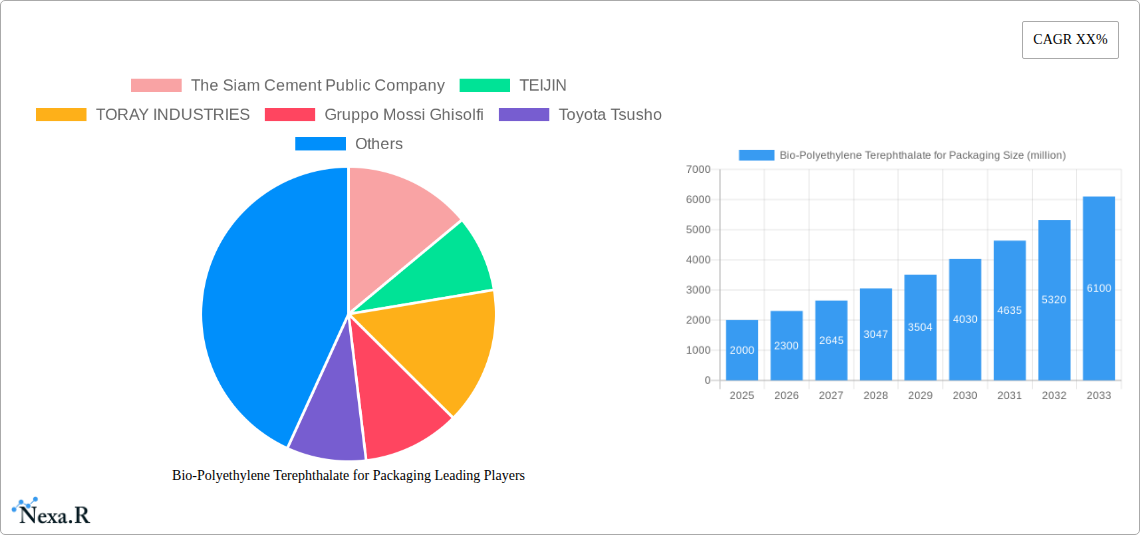
Bio-Polyethylene Terephthalate for Packaging Market Size (In Billion)
Challenges remain, however. The higher production costs of bio-PET compared to conventional PET are a significant restraint, impacting wider market penetration. Furthermore, variations in bio-based feedstock availability and price fluctuations can influence the overall market dynamics. Nevertheless, ongoing technological advancements focusing on cost reduction and enhanced bio-PET performance are expected to mitigate these challenges gradually. The market's future trajectory depends on continued innovation, sustainable feedstock sourcing, and favorable government policies that incentivize the adoption of bio-based packaging alternatives. The market's regional distribution is likely to see strong growth in regions with established recycling infrastructure and supportive government regulations regarding sustainable packaging.
Bio-Polyethylene Terephthalate for Packaging Company Market Share
Bio-Polyethylene Terephthalate (Bio-PET) for Packaging Market Report: 2019-2033
This comprehensive report provides a detailed analysis of the Bio-Polyethylene Terephthalate (Bio-PET) for packaging market, offering invaluable insights for industry professionals, investors, and strategic decision-makers. Covering the period from 2019 to 2033, with a focus on the 2025-2033 forecast, this report unveils market dynamics, growth trends, and key players shaping this rapidly evolving sector. The study includes a detailed analysis of parent and child markets, offering a granular understanding of the market segments.
Bio-Polyethylene Terephthalate for Packaging Market Dynamics & Structure
This section analyzes the Bio-PET packaging market's competitive landscape, encompassing market concentration, technological innovation, regulatory influences, substitute products, end-user demographics, and merger & acquisition (M&A) activities.
Market Concentration: The market exhibits moderate concentration, with key players holding significant shares. The top five companies—The Siam Cement Public Company, TEIJIN, TORAY INDUSTRIES, Gruppo Mossi Ghisolfi, and Toyota Tsusho—collectively account for approximately xx% of the market share in 2025. Smaller players focus on niche applications and regional markets.
Technological Innovation: Continuous advancements in bio-based PET production techniques, focusing on improved biodegradability and performance characteristics, are driving market growth. However, scaling up sustainable and cost-effective production remains a significant challenge.
Regulatory Framework: Stringent regulations concerning plastic waste and environmental sustainability are pushing the adoption of bio-based alternatives like Bio-PET. Government initiatives promoting sustainable packaging are further fueling market growth.
Competitive Product Substitutes: Bio-PET faces competition from other sustainable packaging materials, including bioplastics and paper-based alternatives. However, its superior barrier properties and recyclability offer a competitive edge.
End-User Demographics: The food and beverage industry is the primary end-user, followed by the cosmetics and personal care industry. Growing consumer demand for eco-friendly products is driving market expansion.
M&A Trends: The Bio-PET packaging market has witnessed a moderate level of M&A activity in recent years. xx major deals were recorded between 2019 and 2024, primarily driven by companies seeking to expand their product portfolios and geographic reach.
Bio-Polyethylene Terephthalate for Packaging Growth Trends & Insights
The global Bio-PET packaging market experienced substantial growth during the historical period (2019-2024), with a Compound Annual Growth Rate (CAGR) of xx%. This growth trajectory is projected to continue throughout the forecast period (2025-2033), with an estimated CAGR of xx%. Market size is projected to reach xx million units by 2033, driven by increasing consumer preference for sustainable packaging solutions and stringent environmental regulations. Technological advancements, including improved bio-based PET production processes and enhanced material properties, further contribute to this expansion. Market penetration is currently estimated at xx% and is expected to increase to xx% by 2033.
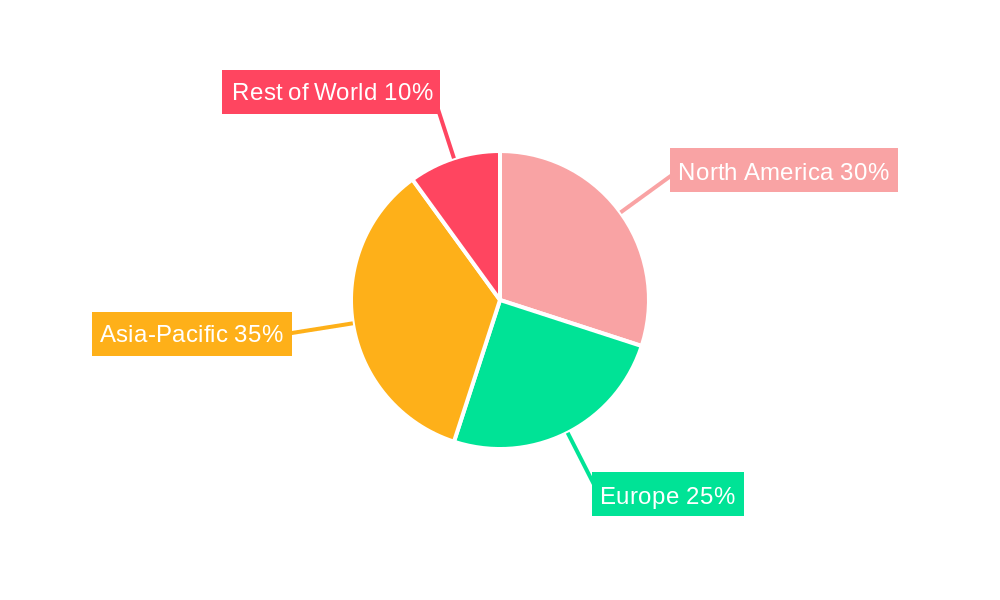
Dominant Regions, Countries, or Segments in Bio-Polyethylene Terephthalate for Packaging
North America and Europe currently dominate the Bio-PET packaging market, owing to stringent environmental regulations, strong consumer awareness of sustainable products, and robust infrastructure supporting the adoption of bio-based alternatives. Asia Pacific is anticipated to witness the highest growth rate during the forecast period, driven by rapid economic development, a rising middle class with increasing disposable incomes, and growing government support for eco-friendly initiatives.
Key Drivers:
- Stringent environmental regulations in North America and Europe.
- Growing consumer preference for sustainable and eco-friendly products.
- Government incentives and subsidies promoting bio-based materials.
- Rapid economic growth and increasing disposable incomes in Asia Pacific.
- Development of advanced bio-based PET production technologies.
Bio-Polyethylene Terephthalate for Packaging Product Landscape
Bio-PET packaging products exhibit diverse applications, ranging from bottles and containers for food and beverages to packaging for cosmetics and personal care products. Ongoing innovations focus on enhancing the biodegradability, barrier properties, and overall performance of Bio-PET, while maintaining cost-effectiveness. Key selling propositions include its superior recyclability, comparable performance to traditional PET, and reduced environmental footprint.
Key Drivers, Barriers & Challenges in Bio-Polyethylene Terephthalate for Packaging
Key Drivers:
- Growing consumer demand for eco-friendly packaging.
- Stringent government regulations restricting the use of conventional plastics.
- Technological advancements leading to improved bio-based PET production.
Challenges and Restraints:
- Higher production costs compared to conventional PET.
- Limited availability of sustainable raw materials.
- Scaling up cost-effective and efficient bio-based PET production remains a major challenge. xx% of producers are still facing significant hurdles in this area, impacting overall market growth.
Emerging Opportunities in Bio-Polyethylene Terephthalate for Packaging
Emerging opportunities lie in expanding into untapped markets in developing economies and exploring innovative applications in sectors such as pharmaceuticals and medical devices. Further advancements in material properties and processing technologies can unlock new market segments and enhance the competitiveness of Bio-PET packaging.
Growth Accelerators in the Bio-Polyethylene Terephthalate for Packaging Industry
Strategic partnerships between bio-based PET producers, packaging companies, and brand owners are accelerating market growth. Technological breakthroughs, particularly in improving the biodegradability and cost-effectiveness of Bio-PET, are crucial for sustained expansion. Further market penetration hinges on efficient supply chains and effective communication of the environmental benefits of Bio-PET packaging to consumers.
Key Players Shaping the Bio-Polyethylene Terephthalate for Packaging Market
- The Siam Cement Public Company
- TEIJIN
- TORAY INDUSTRIES
- Gruppo Mossi Ghisolfi
- Toyota Tsusho
Notable Milestones in Bio-Polyethylene Terephthalate for Packaging Sector
- 2021: Launch of a new high-performance bio-based PET resin by [Company Name].
- 2022: [Company Name] announces a significant investment in expanding its bio-based PET production capacity.
- 2023: Several major brands commit to using 100% bio-based PET packaging by [year].
In-Depth Bio-Polyethylene Terephthalate for Packaging Market Outlook
The future of the Bio-PET packaging market is bright, driven by strong growth potential in developing economies and continued advancements in material science and manufacturing technologies. Strategic partnerships, focused research and development, and sustained consumer demand for sustainable products will be pivotal in shaping the long-term market outlook. The market is poised for significant expansion, presenting attractive opportunities for companies seeking to invest in and capitalize on the growing demand for eco-friendly packaging solutions.
Bio-Polyethylene Terephthalate for Packaging Segmentation
-
1. Application
- 1.1. Chemical Industry
- 1.2. Food and Beverage Industry
- 1.3. Pharmaceutical Industry
- 1.4. Others
-
2. Types
- 2.1. Lids
- 2.2. Pouches
- 2.3. Bags
- 2.4. Others
Bio-Polyethylene Terephthalate for Packaging Segmentation By Geography
-
1. North America
- 1.1. United States
- 1.2. Canada
- 1.3. Mexico
-
2. South America
- 2.1. Brazil
- 2.2. Argentina
- 2.3. Rest of South America
-
3. Europe
- 3.1. United Kingdom
- 3.2. Germany
- 3.3. France
- 3.4. Italy
- 3.5. Spain
- 3.6. Russia
- 3.7. Benelux
- 3.8. Nordics
- 3.9. Rest of Europe
-
4. Middle East & Africa
- 4.1. Turkey
- 4.2. Israel
- 4.3. GCC
- 4.4. North Africa
- 4.5. South Africa
- 4.6. Rest of Middle East & Africa
-
5. Asia Pacific
- 5.1. China
- 5.2. India
- 5.3. Japan
- 5.4. South Korea
- 5.5. ASEAN
- 5.6. Oceania
- 5.7. Rest of Asia Pacific
Bio-Polyethylene Terephthalate for Packaging Regional Market Share
Geographic Coverage of Bio-Polyethylene Terephthalate for Packaging
Bio-Polyethylene Terephthalate for Packaging REPORT HIGHLIGHTS
| Aspects | Details |
|---|---|
| Study Period | 2020-2034 |
| Base Year | 2025 |
| Estimated Year | 2026 |
| Forecast Period | 2026-2034 |
| Historical Period | 2020-2025 |
| Growth Rate | CAGR of 12.6% from 2020-2034 |
| Segmentation |
|
Table of Contents
- 1. Introduction
- 1.1. Research Scope
- 1.2. Market Segmentation
- 1.3. Research Methodology
- 1.4. Definitions and Assumptions
- 2. Executive Summary
- 2.1. Introduction
- 3. Market Dynamics
- 3.1. Introduction
- 3.2. Market Drivers
- 3.3. Market Restrains
- 3.4. Market Trends
- 4. Market Factor Analysis
- 4.1. Porters Five Forces
- 4.2. Supply/Value Chain
- 4.3. PESTEL analysis
- 4.4. Market Entropy
- 4.5. Patent/Trademark Analysis
- 5. Global Bio-Polyethylene Terephthalate for Packaging Analysis, Insights and Forecast, 2020-2032
- 5.1. Market Analysis, Insights and Forecast - by Application
- 5.1.1. Chemical Industry
- 5.1.2. Food and Beverage Industry
- 5.1.3. Pharmaceutical Industry
- 5.1.4. Others
- 5.2. Market Analysis, Insights and Forecast - by Types
- 5.2.1. Lids
- 5.2.2. Pouches
- 5.2.3. Bags
- 5.2.4. Others
- 5.3. Market Analysis, Insights and Forecast - by Region
- 5.3.1. North America
- 5.3.2. South America
- 5.3.3. Europe
- 5.3.4. Middle East & Africa
- 5.3.5. Asia Pacific
- 5.1. Market Analysis, Insights and Forecast - by Application
- 6. North America Bio-Polyethylene Terephthalate for Packaging Analysis, Insights and Forecast, 2020-2032
- 6.1. Market Analysis, Insights and Forecast - by Application
- 6.1.1. Chemical Industry
- 6.1.2. Food and Beverage Industry
- 6.1.3. Pharmaceutical Industry
- 6.1.4. Others
- 6.2. Market Analysis, Insights and Forecast - by Types
- 6.2.1. Lids
- 6.2.2. Pouches
- 6.2.3. Bags
- 6.2.4. Others
- 6.1. Market Analysis, Insights and Forecast - by Application
- 7. South America Bio-Polyethylene Terephthalate for Packaging Analysis, Insights and Forecast, 2020-2032
- 7.1. Market Analysis, Insights and Forecast - by Application
- 7.1.1. Chemical Industry
- 7.1.2. Food and Beverage Industry
- 7.1.3. Pharmaceutical Industry
- 7.1.4. Others
- 7.2. Market Analysis, Insights and Forecast - by Types
- 7.2.1. Lids
- 7.2.2. Pouches
- 7.2.3. Bags
- 7.2.4. Others
- 7.1. Market Analysis, Insights and Forecast - by Application
- 8. Europe Bio-Polyethylene Terephthalate for Packaging Analysis, Insights and Forecast, 2020-2032
- 8.1. Market Analysis, Insights and Forecast - by Application
- 8.1.1. Chemical Industry
- 8.1.2. Food and Beverage Industry
- 8.1.3. Pharmaceutical Industry
- 8.1.4. Others
- 8.2. Market Analysis, Insights and Forecast - by Types
- 8.2.1. Lids
- 8.2.2. Pouches
- 8.2.3. Bags
- 8.2.4. Others
- 8.1. Market Analysis, Insights and Forecast - by Application
- 9. Middle East & Africa Bio-Polyethylene Terephthalate for Packaging Analysis, Insights and Forecast, 2020-2032
- 9.1. Market Analysis, Insights and Forecast - by Application
- 9.1.1. Chemical Industry
- 9.1.2. Food and Beverage Industry
- 9.1.3. Pharmaceutical Industry
- 9.1.4. Others
- 9.2. Market Analysis, Insights and Forecast - by Types
- 9.2.1. Lids
- 9.2.2. Pouches
- 9.2.3. Bags
- 9.2.4. Others
- 9.1. Market Analysis, Insights and Forecast - by Application
- 10. Asia Pacific Bio-Polyethylene Terephthalate for Packaging Analysis, Insights and Forecast, 2020-2032
- 10.1. Market Analysis, Insights and Forecast - by Application
- 10.1.1. Chemical Industry
- 10.1.2. Food and Beverage Industry
- 10.1.3. Pharmaceutical Industry
- 10.1.4. Others
- 10.2. Market Analysis, Insights and Forecast - by Types
- 10.2.1. Lids
- 10.2.2. Pouches
- 10.2.3. Bags
- 10.2.4. Others
- 10.1. Market Analysis, Insights and Forecast - by Application
- 11. Competitive Analysis
- 11.1. Global Market Share Analysis 2025
- 11.2. Company Profiles
- 11.2.1 The Siam Cement Public Company
- 11.2.1.1. Overview
- 11.2.1.2. Products
- 11.2.1.3. SWOT Analysis
- 11.2.1.4. Recent Developments
- 11.2.1.5. Financials (Based on Availability)
- 11.2.2 TEIJIN
- 11.2.2.1. Overview
- 11.2.2.2. Products
- 11.2.2.3. SWOT Analysis
- 11.2.2.4. Recent Developments
- 11.2.2.5. Financials (Based on Availability)
- 11.2.3 TORAY INDUSTRIES
- 11.2.3.1. Overview
- 11.2.3.2. Products
- 11.2.3.3. SWOT Analysis
- 11.2.3.4. Recent Developments
- 11.2.3.5. Financials (Based on Availability)
- 11.2.4 Gruppo Mossi Ghisolfi
- 11.2.4.1. Overview
- 11.2.4.2. Products
- 11.2.4.3. SWOT Analysis
- 11.2.4.4. Recent Developments
- 11.2.4.5. Financials (Based on Availability)
- 11.2.5 Toyota Tsusho
- 11.2.5.1. Overview
- 11.2.5.2. Products
- 11.2.5.3. SWOT Analysis
- 11.2.5.4. Recent Developments
- 11.2.5.5. Financials (Based on Availability)
- 11.2.1 The Siam Cement Public Company
List of Figures
- Figure 1: Global Bio-Polyethylene Terephthalate for Packaging Revenue Breakdown (undefined, %) by Region 2025 & 2033
- Figure 2: Global Bio-Polyethylene Terephthalate for Packaging Volume Breakdown (K, %) by Region 2025 & 2033
- Figure 3: North America Bio-Polyethylene Terephthalate for Packaging Revenue (undefined), by Application 2025 & 2033
- Figure 4: North America Bio-Polyethylene Terephthalate for Packaging Volume (K), by Application 2025 & 2033
- Figure 5: North America Bio-Polyethylene Terephthalate for Packaging Revenue Share (%), by Application 2025 & 2033
- Figure 6: North America Bio-Polyethylene Terephthalate for Packaging Volume Share (%), by Application 2025 & 2033
- Figure 7: North America Bio-Polyethylene Terephthalate for Packaging Revenue (undefined), by Types 2025 & 2033
- Figure 8: North America Bio-Polyethylene Terephthalate for Packaging Volume (K), by Types 2025 & 2033
- Figure 9: North America Bio-Polyethylene Terephthalate for Packaging Revenue Share (%), by Types 2025 & 2033
- Figure 10: North America Bio-Polyethylene Terephthalate for Packaging Volume Share (%), by Types 2025 & 2033
- Figure 11: North America Bio-Polyethylene Terephthalate for Packaging Revenue (undefined), by Country 2025 & 2033
- Figure 12: North America Bio-Polyethylene Terephthalate for Packaging Volume (K), by Country 2025 & 2033
- Figure 13: North America Bio-Polyethylene Terephthalate for Packaging Revenue Share (%), by Country 2025 & 2033
- Figure 14: North America Bio-Polyethylene Terephthalate for Packaging Volume Share (%), by Country 2025 & 2033
- Figure 15: South America Bio-Polyethylene Terephthalate for Packaging Revenue (undefined), by Application 2025 & 2033
- Figure 16: South America Bio-Polyethylene Terephthalate for Packaging Volume (K), by Application 2025 & 2033
- Figure 17: South America Bio-Polyethylene Terephthalate for Packaging Revenue Share (%), by Application 2025 & 2033
- Figure 18: South America Bio-Polyethylene Terephthalate for Packaging Volume Share (%), by Application 2025 & 2033
- Figure 19: South America Bio-Polyethylene Terephthalate for Packaging Revenue (undefined), by Types 2025 & 2033
- Figure 20: South America Bio-Polyethylene Terephthalate for Packaging Volume (K), by Types 2025 & 2033
- Figure 21: South America Bio-Polyethylene Terephthalate for Packaging Revenue Share (%), by Types 2025 & 2033
- Figure 22: South America Bio-Polyethylene Terephthalate for Packaging Volume Share (%), by Types 2025 & 2033
- Figure 23: South America Bio-Polyethylene Terephthalate for Packaging Revenue (undefined), by Country 2025 & 2033
- Figure 24: South America Bio-Polyethylene Terephthalate for Packaging Volume (K), by Country 2025 & 2033
- Figure 25: South America Bio-Polyethylene Terephthalate for Packaging Revenue Share (%), by Country 2025 & 2033
- Figure 26: South America Bio-Polyethylene Terephthalate for Packaging Volume Share (%), by Country 2025 & 2033
- Figure 27: Europe Bio-Polyethylene Terephthalate for Packaging Revenue (undefined), by Application 2025 & 2033
- Figure 28: Europe Bio-Polyethylene Terephthalate for Packaging Volume (K), by Application 2025 & 2033
- Figure 29: Europe Bio-Polyethylene Terephthalate for Packaging Revenue Share (%), by Application 2025 & 2033
- Figure 30: Europe Bio-Polyethylene Terephthalate for Packaging Volume Share (%), by Application 2025 & 2033
- Figure 31: Europe Bio-Polyethylene Terephthalate for Packaging Revenue (undefined), by Types 2025 & 2033
- Figure 32: Europe Bio-Polyethylene Terephthalate for Packaging Volume (K), by Types 2025 & 2033
- Figure 33: Europe Bio-Polyethylene Terephthalate for Packaging Revenue Share (%), by Types 2025 & 2033
- Figure 34: Europe Bio-Polyethylene Terephthalate for Packaging Volume Share (%), by Types 2025 & 2033
- Figure 35: Europe Bio-Polyethylene Terephthalate for Packaging Revenue (undefined), by Country 2025 & 2033
- Figure 36: Europe Bio-Polyethylene Terephthalate for Packaging Volume (K), by Country 2025 & 2033
- Figure 37: Europe Bio-Polyethylene Terephthalate for Packaging Revenue Share (%), by Country 2025 & 2033
- Figure 38: Europe Bio-Polyethylene Terephthalate for Packaging Volume Share (%), by Country 2025 & 2033
- Figure 39: Middle East & Africa Bio-Polyethylene Terephthalate for Packaging Revenue (undefined), by Application 2025 & 2033
- Figure 40: Middle East & Africa Bio-Polyethylene Terephthalate for Packaging Volume (K), by Application 2025 & 2033
- Figure 41: Middle East & Africa Bio-Polyethylene Terephthalate for Packaging Revenue Share (%), by Application 2025 & 2033
- Figure 42: Middle East & Africa Bio-Polyethylene Terephthalate for Packaging Volume Share (%), by Application 2025 & 2033
- Figure 43: Middle East & Africa Bio-Polyethylene Terephthalate for Packaging Revenue (undefined), by Types 2025 & 2033
- Figure 44: Middle East & Africa Bio-Polyethylene Terephthalate for Packaging Volume (K), by Types 2025 & 2033
- Figure 45: Middle East & Africa Bio-Polyethylene Terephthalate for Packaging Revenue Share (%), by Types 2025 & 2033
- Figure 46: Middle East & Africa Bio-Polyethylene Terephthalate for Packaging Volume Share (%), by Types 2025 & 2033
- Figure 47: Middle East & Africa Bio-Polyethylene Terephthalate for Packaging Revenue (undefined), by Country 2025 & 2033
- Figure 48: Middle East & Africa Bio-Polyethylene Terephthalate for Packaging Volume (K), by Country 2025 & 2033
- Figure 49: Middle East & Africa Bio-Polyethylene Terephthalate for Packaging Revenue Share (%), by Country 2025 & 2033
- Figure 50: Middle East & Africa Bio-Polyethylene Terephthalate for Packaging Volume Share (%), by Country 2025 & 2033
- Figure 51: Asia Pacific Bio-Polyethylene Terephthalate for Packaging Revenue (undefined), by Application 2025 & 2033
- Figure 52: Asia Pacific Bio-Polyethylene Terephthalate for Packaging Volume (K), by Application 2025 & 2033
- Figure 53: Asia Pacific Bio-Polyethylene Terephthalate for Packaging Revenue Share (%), by Application 2025 & 2033
- Figure 54: Asia Pacific Bio-Polyethylene Terephthalate for Packaging Volume Share (%), by Application 2025 & 2033
- Figure 55: Asia Pacific Bio-Polyethylene Terephthalate for Packaging Revenue (undefined), by Types 2025 & 2033
- Figure 56: Asia Pacific Bio-Polyethylene Terephthalate for Packaging Volume (K), by Types 2025 & 2033
- Figure 57: Asia Pacific Bio-Polyethylene Terephthalate for Packaging Revenue Share (%), by Types 2025 & 2033
- Figure 58: Asia Pacific Bio-Polyethylene Terephthalate for Packaging Volume Share (%), by Types 2025 & 2033
- Figure 59: Asia Pacific Bio-Polyethylene Terephthalate for Packaging Revenue (undefined), by Country 2025 & 2033
- Figure 60: Asia Pacific Bio-Polyethylene Terephthalate for Packaging Volume (K), by Country 2025 & 2033
- Figure 61: Asia Pacific Bio-Polyethylene Terephthalate for Packaging Revenue Share (%), by Country 2025 & 2033
- Figure 62: Asia Pacific Bio-Polyethylene Terephthalate for Packaging Volume Share (%), by Country 2025 & 2033
List of Tables
- Table 1: Global Bio-Polyethylene Terephthalate for Packaging Revenue undefined Forecast, by Application 2020 & 2033
- Table 2: Global Bio-Polyethylene Terephthalate for Packaging Volume K Forecast, by Application 2020 & 2033
- Table 3: Global Bio-Polyethylene Terephthalate for Packaging Revenue undefined Forecast, by Types 2020 & 2033
- Table 4: Global Bio-Polyethylene Terephthalate for Packaging Volume K Forecast, by Types 2020 & 2033
- Table 5: Global Bio-Polyethylene Terephthalate for Packaging Revenue undefined Forecast, by Region 2020 & 2033
- Table 6: Global Bio-Polyethylene Terephthalate for Packaging Volume K Forecast, by Region 2020 & 2033
- Table 7: Global Bio-Polyethylene Terephthalate for Packaging Revenue undefined Forecast, by Application 2020 & 2033
- Table 8: Global Bio-Polyethylene Terephthalate for Packaging Volume K Forecast, by Application 2020 & 2033
- Table 9: Global Bio-Polyethylene Terephthalate for Packaging Revenue undefined Forecast, by Types 2020 & 2033
- Table 10: Global Bio-Polyethylene Terephthalate for Packaging Volume K Forecast, by Types 2020 & 2033
- Table 11: Global Bio-Polyethylene Terephthalate for Packaging Revenue undefined Forecast, by Country 2020 & 2033
- Table 12: Global Bio-Polyethylene Terephthalate for Packaging Volume K Forecast, by Country 2020 & 2033
- Table 13: United States Bio-Polyethylene Terephthalate for Packaging Revenue (undefined) Forecast, by Application 2020 & 2033
- Table 14: United States Bio-Polyethylene Terephthalate for Packaging Volume (K) Forecast, by Application 2020 & 2033
- Table 15: Canada Bio-Polyethylene Terephthalate for Packaging Revenue (undefined) Forecast, by Application 2020 & 2033
- Table 16: Canada Bio-Polyethylene Terephthalate for Packaging Volume (K) Forecast, by Application 2020 & 2033
- Table 17: Mexico Bio-Polyethylene Terephthalate for Packaging Revenue (undefined) Forecast, by Application 2020 & 2033
- Table 18: Mexico Bio-Polyethylene Terephthalate for Packaging Volume (K) Forecast, by Application 2020 & 2033
- Table 19: Global Bio-Polyethylene Terephthalate for Packaging Revenue undefined Forecast, by Application 2020 & 2033
- Table 20: Global Bio-Polyethylene Terephthalate for Packaging Volume K Forecast, by Application 2020 & 2033
- Table 21: Global Bio-Polyethylene Terephthalate for Packaging Revenue undefined Forecast, by Types 2020 & 2033
- Table 22: Global Bio-Polyethylene Terephthalate for Packaging Volume K Forecast, by Types 2020 & 2033
- Table 23: Global Bio-Polyethylene Terephthalate for Packaging Revenue undefined Forecast, by Country 2020 & 2033
- Table 24: Global Bio-Polyethylene Terephthalate for Packaging Volume K Forecast, by Country 2020 & 2033
- Table 25: Brazil Bio-Polyethylene Terephthalate for Packaging Revenue (undefined) Forecast, by Application 2020 & 2033
- Table 26: Brazil Bio-Polyethylene Terephthalate for Packaging Volume (K) Forecast, by Application 2020 & 2033
- Table 27: Argentina Bio-Polyethylene Terephthalate for Packaging Revenue (undefined) Forecast, by Application 2020 & 2033
- Table 28: Argentina Bio-Polyethylene Terephthalate for Packaging Volume (K) Forecast, by Application 2020 & 2033
- Table 29: Rest of South America Bio-Polyethylene Terephthalate for Packaging Revenue (undefined) Forecast, by Application 2020 & 2033
- Table 30: Rest of South America Bio-Polyethylene Terephthalate for Packaging Volume (K) Forecast, by Application 2020 & 2033
- Table 31: Global Bio-Polyethylene Terephthalate for Packaging Revenue undefined Forecast, by Application 2020 & 2033
- Table 32: Global Bio-Polyethylene Terephthalate for Packaging Volume K Forecast, by Application 2020 & 2033
- Table 33: Global Bio-Polyethylene Terephthalate for Packaging Revenue undefined Forecast, by Types 2020 & 2033
- Table 34: Global Bio-Polyethylene Terephthalate for Packaging Volume K Forecast, by Types 2020 & 2033
- Table 35: Global Bio-Polyethylene Terephthalate for Packaging Revenue undefined Forecast, by Country 2020 & 2033
- Table 36: Global Bio-Polyethylene Terephthalate for Packaging Volume K Forecast, by Country 2020 & 2033
- Table 37: United Kingdom Bio-Polyethylene Terephthalate for Packaging Revenue (undefined) Forecast, by Application 2020 & 2033
- Table 38: United Kingdom Bio-Polyethylene Terephthalate for Packaging Volume (K) Forecast, by Application 2020 & 2033
- Table 39: Germany Bio-Polyethylene Terephthalate for Packaging Revenue (undefined) Forecast, by Application 2020 & 2033
- Table 40: Germany Bio-Polyethylene Terephthalate for Packaging Volume (K) Forecast, by Application 2020 & 2033
- Table 41: France Bio-Polyethylene Terephthalate for Packaging Revenue (undefined) Forecast, by Application 2020 & 2033
- Table 42: France Bio-Polyethylene Terephthalate for Packaging Volume (K) Forecast, by Application 2020 & 2033
- Table 43: Italy Bio-Polyethylene Terephthalate for Packaging Revenue (undefined) Forecast, by Application 2020 & 2033
- Table 44: Italy Bio-Polyethylene Terephthalate for Packaging Volume (K) Forecast, by Application 2020 & 2033
- Table 45: Spain Bio-Polyethylene Terephthalate for Packaging Revenue (undefined) Forecast, by Application 2020 & 2033
- Table 46: Spain Bio-Polyethylene Terephthalate for Packaging Volume (K) Forecast, by Application 2020 & 2033
- Table 47: Russia Bio-Polyethylene Terephthalate for Packaging Revenue (undefined) Forecast, by Application 2020 & 2033
- Table 48: Russia Bio-Polyethylene Terephthalate for Packaging Volume (K) Forecast, by Application 2020 & 2033
- Table 49: Benelux Bio-Polyethylene Terephthalate for Packaging Revenue (undefined) Forecast, by Application 2020 & 2033
- Table 50: Benelux Bio-Polyethylene Terephthalate for Packaging Volume (K) Forecast, by Application 2020 & 2033
- Table 51: Nordics Bio-Polyethylene Terephthalate for Packaging Revenue (undefined) Forecast, by Application 2020 & 2033
- Table 52: Nordics Bio-Polyethylene Terephthalate for Packaging Volume (K) Forecast, by Application 2020 & 2033
- Table 53: Rest of Europe Bio-Polyethylene Terephthalate for Packaging Revenue (undefined) Forecast, by Application 2020 & 2033
- Table 54: Rest of Europe Bio-Polyethylene Terephthalate for Packaging Volume (K) Forecast, by Application 2020 & 2033
- Table 55: Global Bio-Polyethylene Terephthalate for Packaging Revenue undefined Forecast, by Application 2020 & 2033
- Table 56: Global Bio-Polyethylene Terephthalate for Packaging Volume K Forecast, by Application 2020 & 2033
- Table 57: Global Bio-Polyethylene Terephthalate for Packaging Revenue undefined Forecast, by Types 2020 & 2033
- Table 58: Global Bio-Polyethylene Terephthalate for Packaging Volume K Forecast, by Types 2020 & 2033
- Table 59: Global Bio-Polyethylene Terephthalate for Packaging Revenue undefined Forecast, by Country 2020 & 2033
- Table 60: Global Bio-Polyethylene Terephthalate for Packaging Volume K Forecast, by Country 2020 & 2033
- Table 61: Turkey Bio-Polyethylene Terephthalate for Packaging Revenue (undefined) Forecast, by Application 2020 & 2033
- Table 62: Turkey Bio-Polyethylene Terephthalate for Packaging Volume (K) Forecast, by Application 2020 & 2033
- Table 63: Israel Bio-Polyethylene Terephthalate for Packaging Revenue (undefined) Forecast, by Application 2020 & 2033
- Table 64: Israel Bio-Polyethylene Terephthalate for Packaging Volume (K) Forecast, by Application 2020 & 2033
- Table 65: GCC Bio-Polyethylene Terephthalate for Packaging Revenue (undefined) Forecast, by Application 2020 & 2033
- Table 66: GCC Bio-Polyethylene Terephthalate for Packaging Volume (K) Forecast, by Application 2020 & 2033
- Table 67: North Africa Bio-Polyethylene Terephthalate for Packaging Revenue (undefined) Forecast, by Application 2020 & 2033
- Table 68: North Africa Bio-Polyethylene Terephthalate for Packaging Volume (K) Forecast, by Application 2020 & 2033
- Table 69: South Africa Bio-Polyethylene Terephthalate for Packaging Revenue (undefined) Forecast, by Application 2020 & 2033
- Table 70: South Africa Bio-Polyethylene Terephthalate for Packaging Volume (K) Forecast, by Application 2020 & 2033
- Table 71: Rest of Middle East & Africa Bio-Polyethylene Terephthalate for Packaging Revenue (undefined) Forecast, by Application 2020 & 2033
- Table 72: Rest of Middle East & Africa Bio-Polyethylene Terephthalate for Packaging Volume (K) Forecast, by Application 2020 & 2033
- Table 73: Global Bio-Polyethylene Terephthalate for Packaging Revenue undefined Forecast, by Application 2020 & 2033
- Table 74: Global Bio-Polyethylene Terephthalate for Packaging Volume K Forecast, by Application 2020 & 2033
- Table 75: Global Bio-Polyethylene Terephthalate for Packaging Revenue undefined Forecast, by Types 2020 & 2033
- Table 76: Global Bio-Polyethylene Terephthalate for Packaging Volume K Forecast, by Types 2020 & 2033
- Table 77: Global Bio-Polyethylene Terephthalate for Packaging Revenue undefined Forecast, by Country 2020 & 2033
- Table 78: Global Bio-Polyethylene Terephthalate for Packaging Volume K Forecast, by Country 2020 & 2033
- Table 79: China Bio-Polyethylene Terephthalate for Packaging Revenue (undefined) Forecast, by Application 2020 & 2033
- Table 80: China Bio-Polyethylene Terephthalate for Packaging Volume (K) Forecast, by Application 2020 & 2033
- Table 81: India Bio-Polyethylene Terephthalate for Packaging Revenue (undefined) Forecast, by Application 2020 & 2033
- Table 82: India Bio-Polyethylene Terephthalate for Packaging Volume (K) Forecast, by Application 2020 & 2033
- Table 83: Japan Bio-Polyethylene Terephthalate for Packaging Revenue (undefined) Forecast, by Application 2020 & 2033
- Table 84: Japan Bio-Polyethylene Terephthalate for Packaging Volume (K) Forecast, by Application 2020 & 2033
- Table 85: South Korea Bio-Polyethylene Terephthalate for Packaging Revenue (undefined) Forecast, by Application 2020 & 2033
- Table 86: South Korea Bio-Polyethylene Terephthalate for Packaging Volume (K) Forecast, by Application 2020 & 2033
- Table 87: ASEAN Bio-Polyethylene Terephthalate for Packaging Revenue (undefined) Forecast, by Application 2020 & 2033
- Table 88: ASEAN Bio-Polyethylene Terephthalate for Packaging Volume (K) Forecast, by Application 2020 & 2033
- Table 89: Oceania Bio-Polyethylene Terephthalate for Packaging Revenue (undefined) Forecast, by Application 2020 & 2033
- Table 90: Oceania Bio-Polyethylene Terephthalate for Packaging Volume (K) Forecast, by Application 2020 & 2033
- Table 91: Rest of Asia Pacific Bio-Polyethylene Terephthalate for Packaging Revenue (undefined) Forecast, by Application 2020 & 2033
- Table 92: Rest of Asia Pacific Bio-Polyethylene Terephthalate for Packaging Volume (K) Forecast, by Application 2020 & 2033
Frequently Asked Questions
1. What is the projected Compound Annual Growth Rate (CAGR) of the Bio-Polyethylene Terephthalate for Packaging?
The projected CAGR is approximately 12.6%.
2. Which companies are prominent players in the Bio-Polyethylene Terephthalate for Packaging?
Key companies in the market include The Siam Cement Public Company, TEIJIN, TORAY INDUSTRIES, Gruppo Mossi Ghisolfi, Toyota Tsusho.
3. What are the main segments of the Bio-Polyethylene Terephthalate for Packaging?
The market segments include Application, Types.
4. Can you provide details about the market size?
The market size is estimated to be USD XXX N/A as of 2022.
5. What are some drivers contributing to market growth?
N/A
6. What are the notable trends driving market growth?
N/A
7. Are there any restraints impacting market growth?
N/A
8. Can you provide examples of recent developments in the market?
N/A
9. What pricing options are available for accessing the report?
Pricing options include single-user, multi-user, and enterprise licenses priced at USD 4350.00, USD 6525.00, and USD 8700.00 respectively.
10. Is the market size provided in terms of value or volume?
The market size is provided in terms of value, measured in N/A and volume, measured in K.
11. Are there any specific market keywords associated with the report?
Yes, the market keyword associated with the report is "Bio-Polyethylene Terephthalate for Packaging," which aids in identifying and referencing the specific market segment covered.
12. How do I determine which pricing option suits my needs best?
The pricing options vary based on user requirements and access needs. Individual users may opt for single-user licenses, while businesses requiring broader access may choose multi-user or enterprise licenses for cost-effective access to the report.
13. Are there any additional resources or data provided in the Bio-Polyethylene Terephthalate for Packaging report?
While the report offers comprehensive insights, it's advisable to review the specific contents or supplementary materials provided to ascertain if additional resources or data are available.
14. How can I stay updated on further developments or reports in the Bio-Polyethylene Terephthalate for Packaging?
To stay informed about further developments, trends, and reports in the Bio-Polyethylene Terephthalate for Packaging, consider subscribing to industry newsletters, following relevant companies and organizations, or regularly checking reputable industry news sources and publications.
Methodology
Step 1 - Identification of Relevant Samples Size from Population Database


Step 2 - Approaches for Defining Global Market Size (Value, Volume* & Price*)

Note*: In applicable scenarios
Step 3 - Data Sources
Primary Research
- Web Analytics
- Survey Reports
- Research Institute
- Latest Research Reports
- Opinion Leaders
Secondary Research
- Annual Reports
- White Paper
- Latest Press Release
- Industry Association
- Paid Database
- Investor Presentations

Step 4 - Data Triangulation
Involves using different sources of information in order to increase the validity of a study
These sources are likely to be stakeholders in a program - participants, other researchers, program staff, other community members, and so on.
Then we put all data in single framework & apply various statistical tools to find out the dynamic on the market.
During the analysis stage, feedback from the stakeholder groups would be compared to determine areas of agreement as well as areas of divergence