

Key Insights
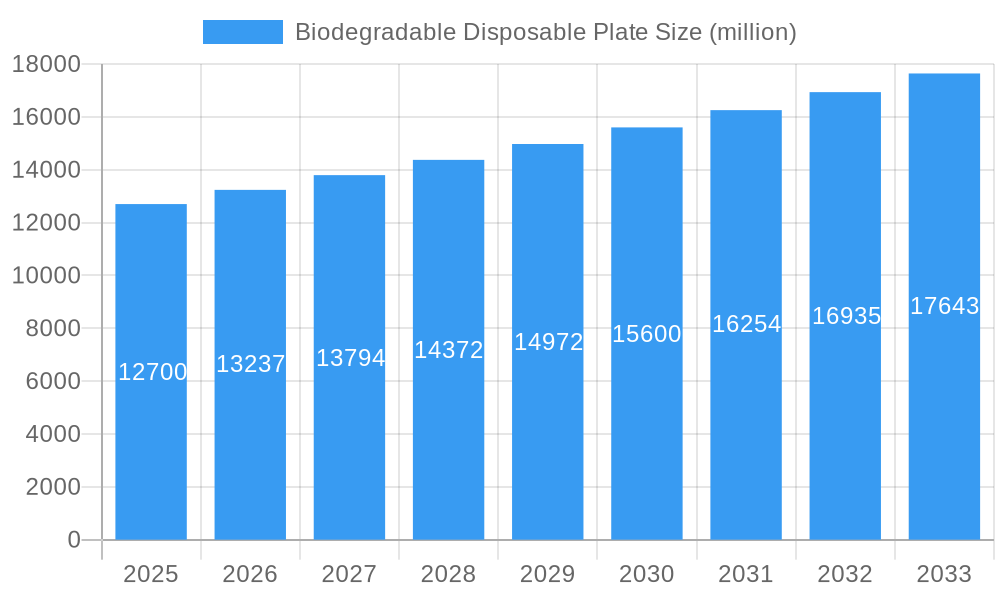
The biodegradable disposable plate market is poised for significant expansion, driven by a growing global consciousness towards environmental sustainability and stringent regulations against single-use plastics. With a current market size of $12.7 billion in 2025, the sector is projected to experience a robust Compound Annual Growth Rate (CAGR) of 4.3% through 2033. This upward trajectory is largely fueled by increasing consumer preference for eco-friendly alternatives in food service and domestic use, coupled with advancements in material science that enhance the functionality and affordability of biodegradable plates. Key drivers include government initiatives promoting waste reduction, corporate social responsibility programs, and the rising demand for convenient yet sustainable disposable tableware. The shift from traditional plastic and non-biodegradable paper plates to options like those made from plant-based materials, sugarcane bagasse, and bamboo is a defining characteristic of this evolving market landscape.
Biodegradable Disposable Plate Market Size (In Billion)
The market segmentation highlights a strong demand across both household and commercial applications, with paper plates and biodegradable plastic plates leading in type. The commercial segment, encompassing restaurants, catering services, and event management, is expected to be a primary revenue generator due to the sheer volume of disposable tableware consumed. However, the household segment is also witnessing substantial growth as individual consumers become more aware of their environmental footprint. While the market offers substantial growth opportunities, certain restraints exist, such as the initial cost premium compared to conventional disposable options and potential challenges in collection and composting infrastructure in some regions. Nevertheless, the overarching trend towards a circular economy and a reduced reliance on petroleum-based products strongly supports the continued proliferation of biodegradable disposable plates globally.
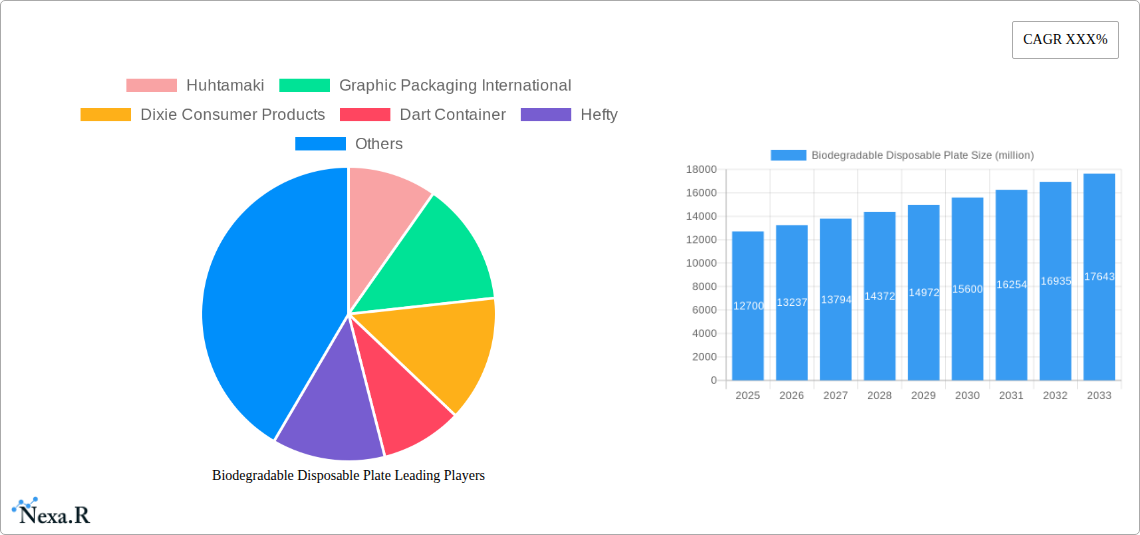
Biodegradable Disposable Plate Company Market Share
This comprehensive report offers an in-depth analysis of the global biodegradable disposable plate market, a rapidly expanding sector driven by increasing environmental consciousness and evolving consumer preferences. Covering the Study Period: 2019–2033, with Base Year: 2025 and Forecast Period: 2025–2033, this report provides critical insights for stakeholders seeking to understand market dynamics, growth drivers, and competitive landscapes. We delve into specific applications, product types, and regional dominance, equipping industry professionals with actionable intelligence.
Biodegradable Disposable Plate Market Dynamics & Structure
The biodegradable disposable plate market exhibits a moderately concentrated structure, with key players like Huhtamaki, Graphic Packaging International, and Dixie Consumer Products holding significant market shares. Technological innovation is a primary driver, focusing on developing more sustainable materials and efficient manufacturing processes. Regulatory frameworks, particularly those promoting eco-friendly packaging and banning single-use plastics, are increasingly influencing market growth. Competitive product substitutes include reusable tableware and conventional disposable plates, though the growing demand for sustainable alternatives is reshaping this landscape. End-user demographics are shifting towards environmentally conscious consumers and businesses actively seeking to reduce their ecological footprint. Mergers and acquisitions (M&A) are becoming more prevalent as companies aim to expand their product portfolios and geographic reach. For instance, M&A deal volumes are projected to increase by xx% between 2025 and 2030, driven by strategic consolidations. Innovation barriers include the cost-effectiveness of biodegradable materials compared to traditional plastics and the establishment of robust composting infrastructure.
- Market Concentration: Moderate to high, with top 5 players accounting for approximately 60% of the global market share.
- Technological Innovation Drivers: Advancements in plant-based polymers, agricultural waste utilization, and improved biodegradability testing standards.
- Regulatory Frameworks: Stringent government regulations on single-use plastics and incentives for sustainable packaging adoption.
- Competitive Product Substitutes: Reusable tableware, conventional plastic disposable plates, aluminum foil containers.
- End-User Demographics: Growing segment of environmentally aware consumers, millennials, Gen Z, and corporate sustainability initiatives.
- M&A Trends: Increasing consolidation for market expansion and product diversification.
Biodegradable Disposable Plate Growth Trends & Insights
The global biodegradable disposable plate market is experiencing robust growth, projected to reach US$ 12.3 billion by 2033, expanding at a Compound Annual Growth Rate (CAGR) of 8.9% from 2025 to 2033. This growth is fueled by escalating consumer demand for sustainable products and stringent government policies aimed at curbing plastic waste. Market penetration is rapidly increasing, particularly in developed economies, as awareness of environmental issues reaches new heights. Technological disruptions are leading to the development of innovative materials derived from sugarcane, bamboo, and corn starch, offering superior biodegradability and compostability. Consumer behavior shifts are evident, with a pronounced preference for eco-friendly alternatives in both household and commercial settings. This includes the rise of conscious dining, catering events, and food service providers prioritizing sustainability. The market size evolution indicates a steady upward trajectory, moving from an estimated US$ 6.5 billion in 2025 to a projected US$ 12.3 billion by 2033. Adoption rates for biodegradable plates are accelerating, driven by a combination of ethical considerations and the perceived premium associated with sustainable products. The industry is witnessing a significant move away from conventional disposable options, with biodegradable alternatives becoming a mainstream choice for a growing consumer base. This transition signifies a fundamental shift in how disposable tableware is perceived and utilized, moving towards a more circular and environmentally responsible model.
Dominant Regions, Countries, or Segments in Biodegradable Disposable Plate
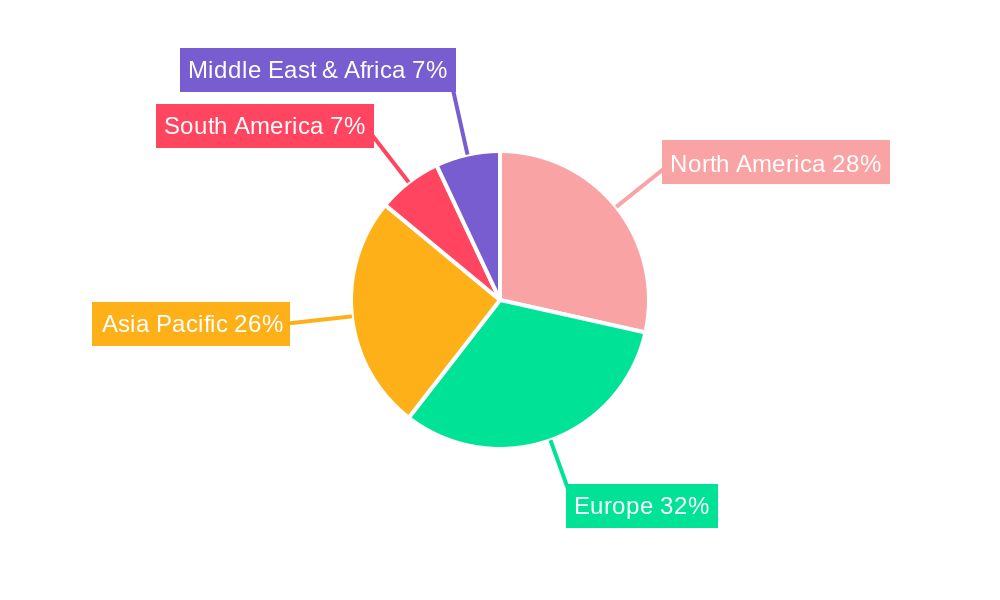
North America, particularly the United States, is currently the dominant region in the biodegradable disposable plate market. This dominance is driven by a confluence of factors, including strong consumer demand for eco-friendly products, supportive government policies such as plastic bag bans and composting initiatives, and a well-established food service industry that increasingly adopts sustainable practices. The Commercial application segment, encompassing restaurants, hotels, catering services, and event venues, represents the largest and fastest-growing application, projected to account for 65% of the market share by 2033. Within the Type segmentation, Paper Plates currently lead the market due to their established infrastructure for production and disposal, holding an estimated 55% of the market share in 2025. However, Biodegradable Plastic Plates are witnessing rapid growth with an estimated 7.8% CAGR, driven by advancements in biopolymer technology offering enhanced durability and functionality. Key drivers for North America's leadership include robust economic policies that encourage sustainable business practices, significant investments in waste management and composting infrastructure, and high public awareness regarding environmental issues. The presence of major players and a large consumer base that actively seeks sustainable alternatives further solidifies its dominant position. Emerging economies in Asia Pacific are expected to show the highest growth potential in the coming years due to increasing environmental awareness and rapid urbanization, leading to a surge in demand for convenient and sustainable food packaging solutions.
- Dominant Region: North America (specifically the United States)
- Leading Application Segment: Commercial (restaurants, hotels, catering, events)
- Leading Product Type: Paper Plates (currently), with Biodegradable Plastic Plates showing significant growth.
- Key Drivers in North America: Consumer demand, supportive policies, robust waste management infrastructure, high environmental awareness.
- Growth Potential: Asia Pacific expected to exhibit the highest growth rates.
Biodegradable Disposable Plate Product Landscape
The biodegradable disposable plate product landscape is characterized by a growing array of innovative solutions designed to meet diverse consumer and commercial needs. Manufacturers are increasingly utilizing sustainable raw materials such as bagasse (sugarcane pulp), bamboo fiber, and plant-based bioplastics like PLA (polylactic acid). These innovations focus on enhancing product performance, including improved durability, heat resistance, and leak-proof qualities, while maintaining full biodegradability and compostability. Unique selling propositions often revolve around certifications like "compostable" and "biodegradable," alongside aesthetically pleasing designs and functional features like microwave-safe properties. Technological advancements are enabling the production of thinner yet stronger plates, reducing material usage and carbon footprint.
Key Drivers, Barriers & Challenges in Biodegradable Disposable Plate
The biodegradable disposable plate market is propelled by several key drivers, most notably the escalating global concern for environmental sustainability and the increasing consumer demand for eco-friendly products. Stringent government regulations worldwide, aimed at reducing plastic waste and promoting circular economy principles, are also significant catalysts. Technological advancements in material science, leading to cost-effective and high-performance biodegradable alternatives, further accelerate market growth.
However, the market faces significant barriers and challenges. The cost of raw materials for biodegradable plates often remains higher than that of conventional plastics, impacting price competitiveness. Establishing widespread and efficient composting infrastructure remains a hurdle in many regions, limiting the effective disposal of biodegradable products. Furthermore, consumer education regarding proper disposal methods and the actual biodegradability of products is crucial. Supply chain complexities and the reliance on specific agricultural inputs can also pose challenges. Competitive pressures from established conventional disposable plate manufacturers and the availability of cheaper, non-biodegradable alternatives continue to restrain market expansion.
Emerging Opportunities in Biodegradable Disposable Plate
Emerging opportunities in the biodegradable disposable plate sector are abundant, driven by evolving consumer preferences and innovative applications. The expansion of e-commerce and food delivery services presents a significant untapped market for sustainable disposable tableware. Growing demand for eco-friendly options in emerging economies, particularly in Asia and Latin America, offers substantial growth potential. Furthermore, the development of specialized biodegradable plates for specific applications, such as high-temperature cooking or catering for outdoor events, presents niche market opportunities. Innovative marketing campaigns that highlight the environmental benefits and unique selling propositions of biodegradable plates can further capitalize on growing consumer consciousness.
Growth Accelerators in the Biodegradable Disposable Plate Industry
Several catalysts are accelerating long-term growth in the biodegradable disposable plate industry. Technological breakthroughs in material science, leading to the development of novel, cost-effective, and high-performance biodegradable materials, are critical. Strategic partnerships between raw material suppliers, plate manufacturers, and waste management companies are fostering a more integrated and efficient value chain. Market expansion strategies, including targeting new geographic regions and diversifying product offerings to cater to various segments, are also playing a crucial role. The increasing adoption of sustainability mandates by large corporations and governmental bodies further provides a robust foundation for sustained market expansion.
Key Players Shaping the Biodegradable Disposable Plate Market
- Huhtamaki
- Graphic Packaging International
- Dixie Consumer Products
- Dart Container
- Hefty
- Hosti International
- CKF Inc
- Solia
- Duni Group
- Swantex
- Natural Tableware
Notable Milestones in Biodegradable Disposable Plate Sector
- 2020: Launch of advanced sugarcane bagasse plates with enhanced heat resistance by Huhtamaki.
- 2021: Graphic Packaging International acquires a leading bioplastics manufacturer to bolster its sustainable packaging portfolio.
- 2022: Dixie Consumer Products introduces a new line of fully compostable paper plates certified by major environmental bodies.
- 2023: Solia expands its European distribution network, focusing on supplying biodegradable tableware to the hospitality sector.
- 2024 (Q1): Duni Group reports significant growth in its eco-friendly disposable product segment, driven by increased consumer demand in Scandinavia.
In-Depth Biodegradable Disposable Plate Market Outlook
The future outlook for the biodegradable disposable plate market is exceptionally positive, driven by a powerful combination of consumer demand, regulatory support, and ongoing technological advancements. The market is poised for sustained and accelerated growth, fueled by the increasing imperative for sustainable consumption. Strategic opportunities lie in the development of innovative, cost-competitive materials, expansion into underserved emerging markets, and collaboration across the value chain to enhance collection and composting infrastructure. Companies that prioritize research and development, embrace eco-friendly production processes, and effectively communicate their sustainability credentials will be best positioned to capitalize on the immense potential of this rapidly evolving market.
Biodegradable Disposable Plate Segmentation
-
1. Application
- 1.1. Household
- 1.2. Commercial
-
2. Type
- 2.1. Paper Plates
- 2.2. Biodegradable Plastic Plates
- 2.3. Others
Biodegradable Disposable Plate Segmentation By Geography
-
1. North America
- 1.1. United States
- 1.2. Canada
- 1.3. Mexico
-
2. South America
- 2.1. Brazil
- 2.2. Argentina
- 2.3. Rest of South America
-
3. Europe
- 3.1. United Kingdom
- 3.2. Germany
- 3.3. France
- 3.4. Italy
- 3.5. Spain
- 3.6. Russia
- 3.7. Benelux
- 3.8. Nordics
- 3.9. Rest of Europe
-
4. Middle East & Africa
- 4.1. Turkey
- 4.2. Israel
- 4.3. GCC
- 4.4. North Africa
- 4.5. South Africa
- 4.6. Rest of Middle East & Africa
-
5. Asia Pacific
- 5.1. China
- 5.2. India
- 5.3. Japan
- 5.4. South Korea
- 5.5. ASEAN
- 5.6. Oceania
- 5.7. Rest of Asia Pacific
Biodegradable Disposable Plate Regional Market Share
Geographic Coverage of Biodegradable Disposable Plate
Biodegradable Disposable Plate REPORT HIGHLIGHTS
| Aspects | Details |
|---|---|
| Study Period | 2020-2034 |
| Base Year | 2025 |
| Estimated Year | 2026 |
| Forecast Period | 2026-2034 |
| Historical Period | 2020-2025 |
| Growth Rate | CAGR of 6.8% from 2020-2034 |
| Segmentation |
|
Table of Contents
- 1. Introduction
- 1.1. Research Scope
- 1.2. Market Segmentation
- 1.3. Research Methodology
- 1.4. Definitions and Assumptions
- 2. Executive Summary
- 2.1. Introduction
- 3. Market Dynamics
- 3.1. Introduction
- 3.2. Market Drivers
- 3.3. Market Restrains
- 3.4. Market Trends
- 4. Market Factor Analysis
- 4.1. Porters Five Forces
- 4.2. Supply/Value Chain
- 4.3. PESTEL analysis
- 4.4. Market Entropy
- 4.5. Patent/Trademark Analysis
- 5. Global Biodegradable Disposable Plate Analysis, Insights and Forecast, 2020-2032
- 5.1. Market Analysis, Insights and Forecast - by Application
- 5.1.1. Household
- 5.1.2. Commercial
- 5.2. Market Analysis, Insights and Forecast - by Type
- 5.2.1. Paper Plates
- 5.2.2. Biodegradable Plastic Plates
- 5.2.3. Others
- 5.3. Market Analysis, Insights and Forecast - by Region
- 5.3.1. North America
- 5.3.2. South America
- 5.3.3. Europe
- 5.3.4. Middle East & Africa
- 5.3.5. Asia Pacific
- 5.1. Market Analysis, Insights and Forecast - by Application
- 6. North America Biodegradable Disposable Plate Analysis, Insights and Forecast, 2020-2032
- 6.1. Market Analysis, Insights and Forecast - by Application
- 6.1.1. Household
- 6.1.2. Commercial
- 6.2. Market Analysis, Insights and Forecast - by Type
- 6.2.1. Paper Plates
- 6.2.2. Biodegradable Plastic Plates
- 6.2.3. Others
- 6.1. Market Analysis, Insights and Forecast - by Application
- 7. South America Biodegradable Disposable Plate Analysis, Insights and Forecast, 2020-2032
- 7.1. Market Analysis, Insights and Forecast - by Application
- 7.1.1. Household
- 7.1.2. Commercial
- 7.2. Market Analysis, Insights and Forecast - by Type
- 7.2.1. Paper Plates
- 7.2.2. Biodegradable Plastic Plates
- 7.2.3. Others
- 7.1. Market Analysis, Insights and Forecast - by Application
- 8. Europe Biodegradable Disposable Plate Analysis, Insights and Forecast, 2020-2032
- 8.1. Market Analysis, Insights and Forecast - by Application
- 8.1.1. Household
- 8.1.2. Commercial
- 8.2. Market Analysis, Insights and Forecast - by Type
- 8.2.1. Paper Plates
- 8.2.2. Biodegradable Plastic Plates
- 8.2.3. Others
- 8.1. Market Analysis, Insights and Forecast - by Application
- 9. Middle East & Africa Biodegradable Disposable Plate Analysis, Insights and Forecast, 2020-2032
- 9.1. Market Analysis, Insights and Forecast - by Application
- 9.1.1. Household
- 9.1.2. Commercial
- 9.2. Market Analysis, Insights and Forecast - by Type
- 9.2.1. Paper Plates
- 9.2.2. Biodegradable Plastic Plates
- 9.2.3. Others
- 9.1. Market Analysis, Insights and Forecast - by Application
- 10. Asia Pacific Biodegradable Disposable Plate Analysis, Insights and Forecast, 2020-2032
- 10.1. Market Analysis, Insights and Forecast - by Application
- 10.1.1. Household
- 10.1.2. Commercial
- 10.2. Market Analysis, Insights and Forecast - by Type
- 10.2.1. Paper Plates
- 10.2.2. Biodegradable Plastic Plates
- 10.2.3. Others
- 10.1. Market Analysis, Insights and Forecast - by Application
- 11. Competitive Analysis
- 11.1. Global Market Share Analysis 2025
- 11.2. Company Profiles
- 11.2.1 Huhtamaki
- 11.2.1.1. Overview
- 11.2.1.2. Products
- 11.2.1.3. SWOT Analysis
- 11.2.1.4. Recent Developments
- 11.2.1.5. Financials (Based on Availability)
- 11.2.2 Graphic Packaging International
- 11.2.2.1. Overview
- 11.2.2.2. Products
- 11.2.2.3. SWOT Analysis
- 11.2.2.4. Recent Developments
- 11.2.2.5. Financials (Based on Availability)
- 11.2.3 Dixie Consumer Products
- 11.2.3.1. Overview
- 11.2.3.2. Products
- 11.2.3.3. SWOT Analysis
- 11.2.3.4. Recent Developments
- 11.2.3.5. Financials (Based on Availability)
- 11.2.4 Dart Container
- 11.2.4.1. Overview
- 11.2.4.2. Products
- 11.2.4.3. SWOT Analysis
- 11.2.4.4. Recent Developments
- 11.2.4.5. Financials (Based on Availability)
- 11.2.5 Hefty
- 11.2.5.1. Overview
- 11.2.5.2. Products
- 11.2.5.3. SWOT Analysis
- 11.2.5.4. Recent Developments
- 11.2.5.5. Financials (Based on Availability)
- 11.2.6 Hosti International
- 11.2.6.1. Overview
- 11.2.6.2. Products
- 11.2.6.3. SWOT Analysis
- 11.2.6.4. Recent Developments
- 11.2.6.5. Financials (Based on Availability)
- 11.2.7 CKF Inc
- 11.2.7.1. Overview
- 11.2.7.2. Products
- 11.2.7.3. SWOT Analysis
- 11.2.7.4. Recent Developments
- 11.2.7.5. Financials (Based on Availability)
- 11.2.8 Solia
- 11.2.8.1. Overview
- 11.2.8.2. Products
- 11.2.8.3. SWOT Analysis
- 11.2.8.4. Recent Developments
- 11.2.8.5. Financials (Based on Availability)
- 11.2.9 Duni Group
- 11.2.9.1. Overview
- 11.2.9.2. Products
- 11.2.9.3. SWOT Analysis
- 11.2.9.4. Recent Developments
- 11.2.9.5. Financials (Based on Availability)
- 11.2.10 Swantex
- 11.2.10.1. Overview
- 11.2.10.2. Products
- 11.2.10.3. SWOT Analysis
- 11.2.10.4. Recent Developments
- 11.2.10.5. Financials (Based on Availability)
- 11.2.11 Natural Tableware
- 11.2.11.1. Overview
- 11.2.11.2. Products
- 11.2.11.3. SWOT Analysis
- 11.2.11.4. Recent Developments
- 11.2.11.5. Financials (Based on Availability)
- 11.2.1 Huhtamaki
List of Figures
- Figure 1: Global Biodegradable Disposable Plate Revenue Breakdown (undefined, %) by Region 2025 & 2033
- Figure 2: Global Biodegradable Disposable Plate Volume Breakdown (K, %) by Region 2025 & 2033
- Figure 3: North America Biodegradable Disposable Plate Revenue (undefined), by Application 2025 & 2033
- Figure 4: North America Biodegradable Disposable Plate Volume (K), by Application 2025 & 2033
- Figure 5: North America Biodegradable Disposable Plate Revenue Share (%), by Application 2025 & 2033
- Figure 6: North America Biodegradable Disposable Plate Volume Share (%), by Application 2025 & 2033
- Figure 7: North America Biodegradable Disposable Plate Revenue (undefined), by Type 2025 & 2033
- Figure 8: North America Biodegradable Disposable Plate Volume (K), by Type 2025 & 2033
- Figure 9: North America Biodegradable Disposable Plate Revenue Share (%), by Type 2025 & 2033
- Figure 10: North America Biodegradable Disposable Plate Volume Share (%), by Type 2025 & 2033
- Figure 11: North America Biodegradable Disposable Plate Revenue (undefined), by Country 2025 & 2033
- Figure 12: North America Biodegradable Disposable Plate Volume (K), by Country 2025 & 2033
- Figure 13: North America Biodegradable Disposable Plate Revenue Share (%), by Country 2025 & 2033
- Figure 14: North America Biodegradable Disposable Plate Volume Share (%), by Country 2025 & 2033
- Figure 15: South America Biodegradable Disposable Plate Revenue (undefined), by Application 2025 & 2033
- Figure 16: South America Biodegradable Disposable Plate Volume (K), by Application 2025 & 2033
- Figure 17: South America Biodegradable Disposable Plate Revenue Share (%), by Application 2025 & 2033
- Figure 18: South America Biodegradable Disposable Plate Volume Share (%), by Application 2025 & 2033
- Figure 19: South America Biodegradable Disposable Plate Revenue (undefined), by Type 2025 & 2033
- Figure 20: South America Biodegradable Disposable Plate Volume (K), by Type 2025 & 2033
- Figure 21: South America Biodegradable Disposable Plate Revenue Share (%), by Type 2025 & 2033
- Figure 22: South America Biodegradable Disposable Plate Volume Share (%), by Type 2025 & 2033
- Figure 23: South America Biodegradable Disposable Plate Revenue (undefined), by Country 2025 & 2033
- Figure 24: South America Biodegradable Disposable Plate Volume (K), by Country 2025 & 2033
- Figure 25: South America Biodegradable Disposable Plate Revenue Share (%), by Country 2025 & 2033
- Figure 26: South America Biodegradable Disposable Plate Volume Share (%), by Country 2025 & 2033
- Figure 27: Europe Biodegradable Disposable Plate Revenue (undefined), by Application 2025 & 2033
- Figure 28: Europe Biodegradable Disposable Plate Volume (K), by Application 2025 & 2033
- Figure 29: Europe Biodegradable Disposable Plate Revenue Share (%), by Application 2025 & 2033
- Figure 30: Europe Biodegradable Disposable Plate Volume Share (%), by Application 2025 & 2033
- Figure 31: Europe Biodegradable Disposable Plate Revenue (undefined), by Type 2025 & 2033
- Figure 32: Europe Biodegradable Disposable Plate Volume (K), by Type 2025 & 2033
- Figure 33: Europe Biodegradable Disposable Plate Revenue Share (%), by Type 2025 & 2033
- Figure 34: Europe Biodegradable Disposable Plate Volume Share (%), by Type 2025 & 2033
- Figure 35: Europe Biodegradable Disposable Plate Revenue (undefined), by Country 2025 & 2033
- Figure 36: Europe Biodegradable Disposable Plate Volume (K), by Country 2025 & 2033
- Figure 37: Europe Biodegradable Disposable Plate Revenue Share (%), by Country 2025 & 2033
- Figure 38: Europe Biodegradable Disposable Plate Volume Share (%), by Country 2025 & 2033
- Figure 39: Middle East & Africa Biodegradable Disposable Plate Revenue (undefined), by Application 2025 & 2033
- Figure 40: Middle East & Africa Biodegradable Disposable Plate Volume (K), by Application 2025 & 2033
- Figure 41: Middle East & Africa Biodegradable Disposable Plate Revenue Share (%), by Application 2025 & 2033
- Figure 42: Middle East & Africa Biodegradable Disposable Plate Volume Share (%), by Application 2025 & 2033
- Figure 43: Middle East & Africa Biodegradable Disposable Plate Revenue (undefined), by Type 2025 & 2033
- Figure 44: Middle East & Africa Biodegradable Disposable Plate Volume (K), by Type 2025 & 2033
- Figure 45: Middle East & Africa Biodegradable Disposable Plate Revenue Share (%), by Type 2025 & 2033
- Figure 46: Middle East & Africa Biodegradable Disposable Plate Volume Share (%), by Type 2025 & 2033
- Figure 47: Middle East & Africa Biodegradable Disposable Plate Revenue (undefined), by Country 2025 & 2033
- Figure 48: Middle East & Africa Biodegradable Disposable Plate Volume (K), by Country 2025 & 2033
- Figure 49: Middle East & Africa Biodegradable Disposable Plate Revenue Share (%), by Country 2025 & 2033
- Figure 50: Middle East & Africa Biodegradable Disposable Plate Volume Share (%), by Country 2025 & 2033
- Figure 51: Asia Pacific Biodegradable Disposable Plate Revenue (undefined), by Application 2025 & 2033
- Figure 52: Asia Pacific Biodegradable Disposable Plate Volume (K), by Application 2025 & 2033
- Figure 53: Asia Pacific Biodegradable Disposable Plate Revenue Share (%), by Application 2025 & 2033
- Figure 54: Asia Pacific Biodegradable Disposable Plate Volume Share (%), by Application 2025 & 2033
- Figure 55: Asia Pacific Biodegradable Disposable Plate Revenue (undefined), by Type 2025 & 2033
- Figure 56: Asia Pacific Biodegradable Disposable Plate Volume (K), by Type 2025 & 2033
- Figure 57: Asia Pacific Biodegradable Disposable Plate Revenue Share (%), by Type 2025 & 2033
- Figure 58: Asia Pacific Biodegradable Disposable Plate Volume Share (%), by Type 2025 & 2033
- Figure 59: Asia Pacific Biodegradable Disposable Plate Revenue (undefined), by Country 2025 & 2033
- Figure 60: Asia Pacific Biodegradable Disposable Plate Volume (K), by Country 2025 & 2033
- Figure 61: Asia Pacific Biodegradable Disposable Plate Revenue Share (%), by Country 2025 & 2033
- Figure 62: Asia Pacific Biodegradable Disposable Plate Volume Share (%), by Country 2025 & 2033
List of Tables
- Table 1: Global Biodegradable Disposable Plate Revenue undefined Forecast, by Application 2020 & 2033
- Table 2: Global Biodegradable Disposable Plate Volume K Forecast, by Application 2020 & 2033
- Table 3: Global Biodegradable Disposable Plate Revenue undefined Forecast, by Type 2020 & 2033
- Table 4: Global Biodegradable Disposable Plate Volume K Forecast, by Type 2020 & 2033
- Table 5: Global Biodegradable Disposable Plate Revenue undefined Forecast, by Region 2020 & 2033
- Table 6: Global Biodegradable Disposable Plate Volume K Forecast, by Region 2020 & 2033
- Table 7: Global Biodegradable Disposable Plate Revenue undefined Forecast, by Application 2020 & 2033
- Table 8: Global Biodegradable Disposable Plate Volume K Forecast, by Application 2020 & 2033
- Table 9: Global Biodegradable Disposable Plate Revenue undefined Forecast, by Type 2020 & 2033
- Table 10: Global Biodegradable Disposable Plate Volume K Forecast, by Type 2020 & 2033
- Table 11: Global Biodegradable Disposable Plate Revenue undefined Forecast, by Country 2020 & 2033
- Table 12: Global Biodegradable Disposable Plate Volume K Forecast, by Country 2020 & 2033
- Table 13: United States Biodegradable Disposable Plate Revenue (undefined) Forecast, by Application 2020 & 2033
- Table 14: United States Biodegradable Disposable Plate Volume (K) Forecast, by Application 2020 & 2033
- Table 15: Canada Biodegradable Disposable Plate Revenue (undefined) Forecast, by Application 2020 & 2033
- Table 16: Canada Biodegradable Disposable Plate Volume (K) Forecast, by Application 2020 & 2033
- Table 17: Mexico Biodegradable Disposable Plate Revenue (undefined) Forecast, by Application 2020 & 2033
- Table 18: Mexico Biodegradable Disposable Plate Volume (K) Forecast, by Application 2020 & 2033
- Table 19: Global Biodegradable Disposable Plate Revenue undefined Forecast, by Application 2020 & 2033
- Table 20: Global Biodegradable Disposable Plate Volume K Forecast, by Application 2020 & 2033
- Table 21: Global Biodegradable Disposable Plate Revenue undefined Forecast, by Type 2020 & 2033
- Table 22: Global Biodegradable Disposable Plate Volume K Forecast, by Type 2020 & 2033
- Table 23: Global Biodegradable Disposable Plate Revenue undefined Forecast, by Country 2020 & 2033
- Table 24: Global Biodegradable Disposable Plate Volume K Forecast, by Country 2020 & 2033
- Table 25: Brazil Biodegradable Disposable Plate Revenue (undefined) Forecast, by Application 2020 & 2033
- Table 26: Brazil Biodegradable Disposable Plate Volume (K) Forecast, by Application 2020 & 2033
- Table 27: Argentina Biodegradable Disposable Plate Revenue (undefined) Forecast, by Application 2020 & 2033
- Table 28: Argentina Biodegradable Disposable Plate Volume (K) Forecast, by Application 2020 & 2033
- Table 29: Rest of South America Biodegradable Disposable Plate Revenue (undefined) Forecast, by Application 2020 & 2033
- Table 30: Rest of South America Biodegradable Disposable Plate Volume (K) Forecast, by Application 2020 & 2033
- Table 31: Global Biodegradable Disposable Plate Revenue undefined Forecast, by Application 2020 & 2033
- Table 32: Global Biodegradable Disposable Plate Volume K Forecast, by Application 2020 & 2033
- Table 33: Global Biodegradable Disposable Plate Revenue undefined Forecast, by Type 2020 & 2033
- Table 34: Global Biodegradable Disposable Plate Volume K Forecast, by Type 2020 & 2033
- Table 35: Global Biodegradable Disposable Plate Revenue undefined Forecast, by Country 2020 & 2033
- Table 36: Global Biodegradable Disposable Plate Volume K Forecast, by Country 2020 & 2033
- Table 37: United Kingdom Biodegradable Disposable Plate Revenue (undefined) Forecast, by Application 2020 & 2033
- Table 38: United Kingdom Biodegradable Disposable Plate Volume (K) Forecast, by Application 2020 & 2033
- Table 39: Germany Biodegradable Disposable Plate Revenue (undefined) Forecast, by Application 2020 & 2033
- Table 40: Germany Biodegradable Disposable Plate Volume (K) Forecast, by Application 2020 & 2033
- Table 41: France Biodegradable Disposable Plate Revenue (undefined) Forecast, by Application 2020 & 2033
- Table 42: France Biodegradable Disposable Plate Volume (K) Forecast, by Application 2020 & 2033
- Table 43: Italy Biodegradable Disposable Plate Revenue (undefined) Forecast, by Application 2020 & 2033
- Table 44: Italy Biodegradable Disposable Plate Volume (K) Forecast, by Application 2020 & 2033
- Table 45: Spain Biodegradable Disposable Plate Revenue (undefined) Forecast, by Application 2020 & 2033
- Table 46: Spain Biodegradable Disposable Plate Volume (K) Forecast, by Application 2020 & 2033
- Table 47: Russia Biodegradable Disposable Plate Revenue (undefined) Forecast, by Application 2020 & 2033
- Table 48: Russia Biodegradable Disposable Plate Volume (K) Forecast, by Application 2020 & 2033
- Table 49: Benelux Biodegradable Disposable Plate Revenue (undefined) Forecast, by Application 2020 & 2033
- Table 50: Benelux Biodegradable Disposable Plate Volume (K) Forecast, by Application 2020 & 2033
- Table 51: Nordics Biodegradable Disposable Plate Revenue (undefined) Forecast, by Application 2020 & 2033
- Table 52: Nordics Biodegradable Disposable Plate Volume (K) Forecast, by Application 2020 & 2033
- Table 53: Rest of Europe Biodegradable Disposable Plate Revenue (undefined) Forecast, by Application 2020 & 2033
- Table 54: Rest of Europe Biodegradable Disposable Plate Volume (K) Forecast, by Application 2020 & 2033
- Table 55: Global Biodegradable Disposable Plate Revenue undefined Forecast, by Application 2020 & 2033
- Table 56: Global Biodegradable Disposable Plate Volume K Forecast, by Application 2020 & 2033
- Table 57: Global Biodegradable Disposable Plate Revenue undefined Forecast, by Type 2020 & 2033
- Table 58: Global Biodegradable Disposable Plate Volume K Forecast, by Type 2020 & 2033
- Table 59: Global Biodegradable Disposable Plate Revenue undefined Forecast, by Country 2020 & 2033
- Table 60: Global Biodegradable Disposable Plate Volume K Forecast, by Country 2020 & 2033
- Table 61: Turkey Biodegradable Disposable Plate Revenue (undefined) Forecast, by Application 2020 & 2033
- Table 62: Turkey Biodegradable Disposable Plate Volume (K) Forecast, by Application 2020 & 2033
- Table 63: Israel Biodegradable Disposable Plate Revenue (undefined) Forecast, by Application 2020 & 2033
- Table 64: Israel Biodegradable Disposable Plate Volume (K) Forecast, by Application 2020 & 2033
- Table 65: GCC Biodegradable Disposable Plate Revenue (undefined) Forecast, by Application 2020 & 2033
- Table 66: GCC Biodegradable Disposable Plate Volume (K) Forecast, by Application 2020 & 2033
- Table 67: North Africa Biodegradable Disposable Plate Revenue (undefined) Forecast, by Application 2020 & 2033
- Table 68: North Africa Biodegradable Disposable Plate Volume (K) Forecast, by Application 2020 & 2033
- Table 69: South Africa Biodegradable Disposable Plate Revenue (undefined) Forecast, by Application 2020 & 2033
- Table 70: South Africa Biodegradable Disposable Plate Volume (K) Forecast, by Application 2020 & 2033
- Table 71: Rest of Middle East & Africa Biodegradable Disposable Plate Revenue (undefined) Forecast, by Application 2020 & 2033
- Table 72: Rest of Middle East & Africa Biodegradable Disposable Plate Volume (K) Forecast, by Application 2020 & 2033
- Table 73: Global Biodegradable Disposable Plate Revenue undefined Forecast, by Application 2020 & 2033
- Table 74: Global Biodegradable Disposable Plate Volume K Forecast, by Application 2020 & 2033
- Table 75: Global Biodegradable Disposable Plate Revenue undefined Forecast, by Type 2020 & 2033
- Table 76: Global Biodegradable Disposable Plate Volume K Forecast, by Type 2020 & 2033
- Table 77: Global Biodegradable Disposable Plate Revenue undefined Forecast, by Country 2020 & 2033
- Table 78: Global Biodegradable Disposable Plate Volume K Forecast, by Country 2020 & 2033
- Table 79: China Biodegradable Disposable Plate Revenue (undefined) Forecast, by Application 2020 & 2033
- Table 80: China Biodegradable Disposable Plate Volume (K) Forecast, by Application 2020 & 2033
- Table 81: India Biodegradable Disposable Plate Revenue (undefined) Forecast, by Application 2020 & 2033
- Table 82: India Biodegradable Disposable Plate Volume (K) Forecast, by Application 2020 & 2033
- Table 83: Japan Biodegradable Disposable Plate Revenue (undefined) Forecast, by Application 2020 & 2033
- Table 84: Japan Biodegradable Disposable Plate Volume (K) Forecast, by Application 2020 & 2033
- Table 85: South Korea Biodegradable Disposable Plate Revenue (undefined) Forecast, by Application 2020 & 2033
- Table 86: South Korea Biodegradable Disposable Plate Volume (K) Forecast, by Application 2020 & 2033
- Table 87: ASEAN Biodegradable Disposable Plate Revenue (undefined) Forecast, by Application 2020 & 2033
- Table 88: ASEAN Biodegradable Disposable Plate Volume (K) Forecast, by Application 2020 & 2033
- Table 89: Oceania Biodegradable Disposable Plate Revenue (undefined) Forecast, by Application 2020 & 2033
- Table 90: Oceania Biodegradable Disposable Plate Volume (K) Forecast, by Application 2020 & 2033
- Table 91: Rest of Asia Pacific Biodegradable Disposable Plate Revenue (undefined) Forecast, by Application 2020 & 2033
- Table 92: Rest of Asia Pacific Biodegradable Disposable Plate Volume (K) Forecast, by Application 2020 & 2033
Frequently Asked Questions
1. What is the projected Compound Annual Growth Rate (CAGR) of the Biodegradable Disposable Plate?
The projected CAGR is approximately 6.8%.
2. Which companies are prominent players in the Biodegradable Disposable Plate?
Key companies in the market include Huhtamaki, Graphic Packaging International, Dixie Consumer Products, Dart Container, Hefty, Hosti International, CKF Inc, Solia, Duni Group, Swantex, Natural Tableware.
3. What are the main segments of the Biodegradable Disposable Plate?
The market segments include Application, Type.
4. Can you provide details about the market size?
The market size is estimated to be USD XXX N/A as of 2022.
5. What are some drivers contributing to market growth?
N/A
6. What are the notable trends driving market growth?
N/A
7. Are there any restraints impacting market growth?
N/A
8. Can you provide examples of recent developments in the market?
N/A
9. What pricing options are available for accessing the report?
Pricing options include single-user, multi-user, and enterprise licenses priced at USD 3950.00, USD 5925.00, and USD 7900.00 respectively.
10. Is the market size provided in terms of value or volume?
The market size is provided in terms of value, measured in N/A and volume, measured in K.
11. Are there any specific market keywords associated with the report?
Yes, the market keyword associated with the report is "Biodegradable Disposable Plate," which aids in identifying and referencing the specific market segment covered.
12. How do I determine which pricing option suits my needs best?
The pricing options vary based on user requirements and access needs. Individual users may opt for single-user licenses, while businesses requiring broader access may choose multi-user or enterprise licenses for cost-effective access to the report.
13. Are there any additional resources or data provided in the Biodegradable Disposable Plate report?
While the report offers comprehensive insights, it's advisable to review the specific contents or supplementary materials provided to ascertain if additional resources or data are available.
14. How can I stay updated on further developments or reports in the Biodegradable Disposable Plate?
To stay informed about further developments, trends, and reports in the Biodegradable Disposable Plate, consider subscribing to industry newsletters, following relevant companies and organizations, or regularly checking reputable industry news sources and publications.
Methodology
Step 1 - Identification of Relevant Samples Size from Population Database


Step 2 - Approaches for Defining Global Market Size (Value, Volume* & Price*)

Note*: In applicable scenarios
Step 3 - Data Sources
Primary Research
- Web Analytics
- Survey Reports
- Research Institute
- Latest Research Reports
- Opinion Leaders
Secondary Research
- Annual Reports
- White Paper
- Latest Press Release
- Industry Association
- Paid Database
- Investor Presentations

Step 4 - Data Triangulation
Involves using different sources of information in order to increase the validity of a study
These sources are likely to be stakeholders in a program - participants, other researchers, program staff, other community members, and so on.
Then we put all data in single framework & apply various statistical tools to find out the dynamic on the market.
During the analysis stage, feedback from the stakeholder groups would be compared to determine areas of agreement as well as areas of divergence