

Key Insights
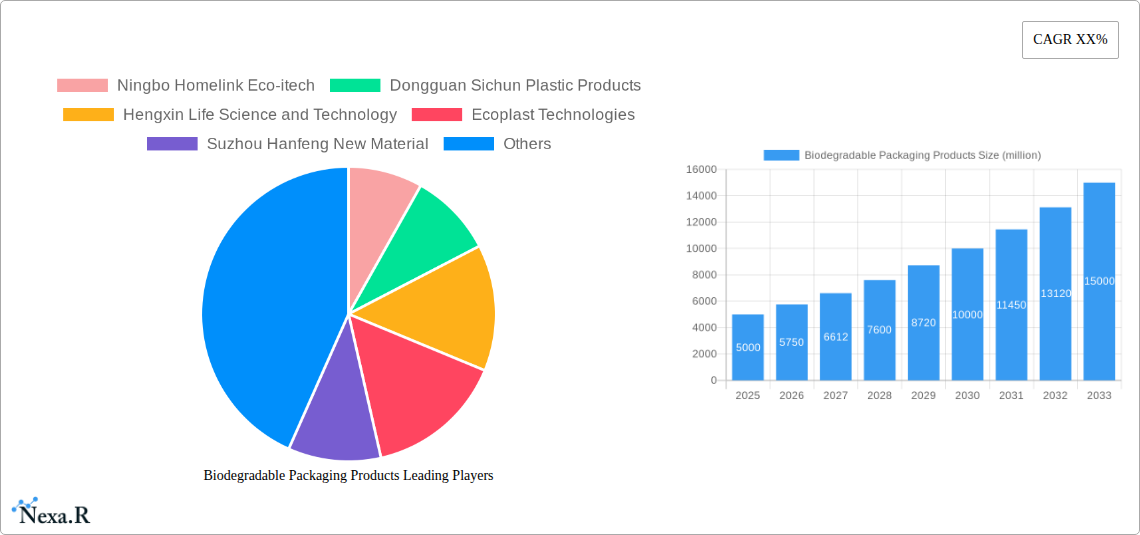
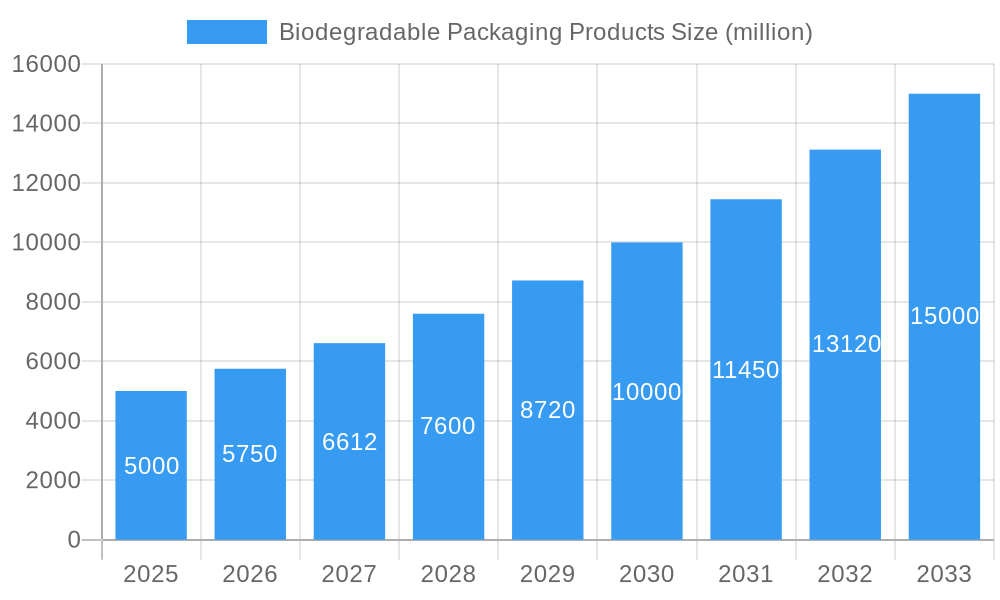
The global biodegradable packaging market is experiencing robust growth, driven by increasing consumer awareness of environmental sustainability and stringent government regulations aimed at reducing plastic waste. The market, estimated at $5 billion in 2025, is projected to exhibit a Compound Annual Growth Rate (CAGR) of 15% from 2025 to 2033, reaching an estimated $15 billion by 2033. This expansion is fueled by several key trends: the rising popularity of e-commerce and its associated packaging needs, the growing demand for eco-friendly alternatives in food and beverage packaging, and the development of innovative biodegradable materials with improved performance characteristics. Major players like BioBag, Novolex, and others are investing heavily in research and development, introducing new biodegradable packaging solutions tailored to specific industry requirements. This includes the development of compostable films, bags, and containers made from materials like PLA (polylactic acid), PHA (polyhydroxyalkanoates), and starch-based polymers.
Biodegradable Packaging Products Market Size (In Billion)
However, the market faces certain challenges. The relatively higher cost of biodegradable packaging compared to conventional plastic remains a significant restraint. Furthermore, the inconsistent availability of efficient composting infrastructure in many regions limits the widespread adoption of these products. Nevertheless, the long-term benefits of reduced environmental impact and the growing regulatory pressure are expected to outweigh these limitations, ultimately driving the continuous expansion of this vital market segment. The diverse range of applications across food and beverage, healthcare, consumer goods, and industrial sectors ensures a robust and multifaceted market with significant potential for further growth. The segmentation within the market, encompassing different material types, packaging formats, and end-use applications, presents numerous opportunities for specialized players to cater to unique market niches.
Biodegradable Packaging Products Company Market Share
Biodegradable Packaging Products Market Report: 2019-2033
This comprehensive report provides a detailed analysis of the Biodegradable Packaging Products market, encompassing historical data (2019-2024), current estimates (2025), and future projections (2025-2033). The study delves into market dynamics, growth trends, regional segmentation, product landscape, key players, and emerging opportunities within the broader packaging and sustainable materials industries. The report utilizes a robust methodology leveraging XXX to deliver actionable insights for industry professionals, investors, and stakeholders. The total market value in 2025 is estimated at xx million units.
Biodegradable Packaging Products Market Dynamics & Structure
This section analyzes the competitive landscape, technological advancements, regulatory influences, and market consolidation within the biodegradable packaging sector. We examine market concentration, highlighting the leading players and their respective market shares. The report also explores the impact of technological innovation on product development, addressing barriers to entry and the role of R&D investments. Regulatory frameworks, including environmental policies and sustainability standards, are assessed for their influence on market growth. The analysis considers the presence of substitute products and their potential impact on market dynamics. Finally, we examine mergers and acquisitions (M&A) activity, quantifying deal volumes and assessing their strategic implications.
- Market Concentration: xx% concentrated among top 5 players in 2025.
- Technological Innovation: Focus on compostable materials (PLA, PHA) and improved barrier properties. Innovation barriers include high production costs and inconsistent biodegradability across different environments.
- Regulatory Frameworks: Growing emphasis on plastic reduction policies globally driving market expansion. xx million units of growth predicted due to new EU regulations by 2033.
- Competitive Substitutes: Traditional petroleum-based plastics remain a significant competitor.
- End-User Demographics: Increasing demand from food & beverage, consumer goods, and healthcare sectors.
- M&A Trends: xx M&A deals observed between 2019-2024, with a predicted increase to xx deals by 2033 driven by consolidation and expansion efforts.
Biodegradable Packaging Products Growth Trends & Insights
This section provides a detailed analysis of the Biodegradable Packaging Products market's growth trajectory, examining historical and projected market size, adoption rates across different segments, and the influence of technological disruptions on market evolution. We quantify growth using the Compound Annual Growth Rate (CAGR) and analyze market penetration rates in key regions and segments. The impact of consumer behavior shifts toward sustainability is also explored, including changing purchasing preferences and demand for eco-friendly packaging solutions. This section provides detailed insights into the factors driving market expansion and provides a forecast for the future. The predicted CAGR from 2025 to 2033 is xx%. Market penetration in the food & beverage sector is estimated at xx% by 2033.
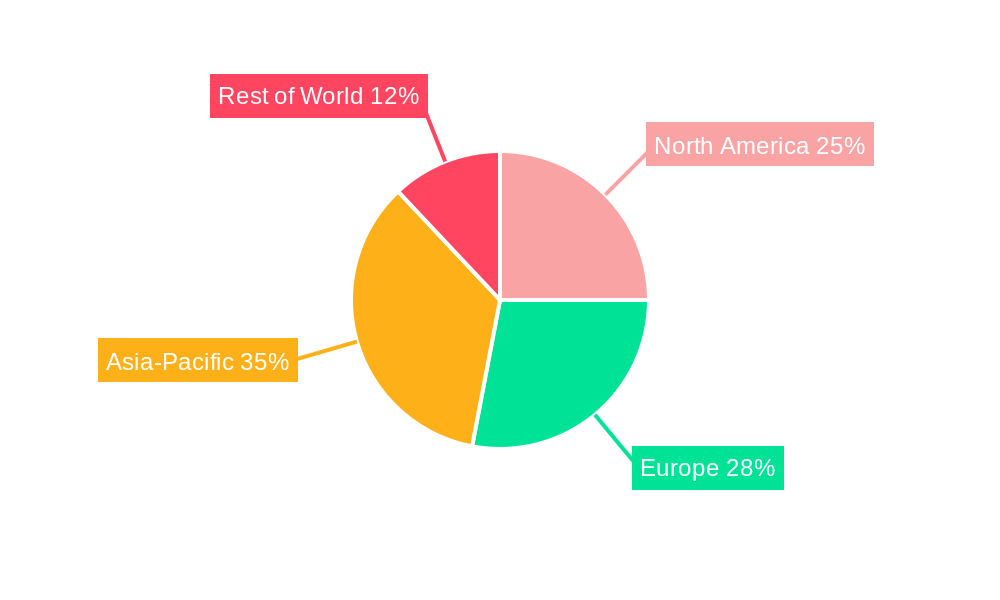
Dominant Regions, Countries, or Segments in Biodegradable Packaging Products
This section identifies the leading regions, countries, and segments driving market growth, providing a detailed analysis of their dominance factors. We examine economic policies, infrastructure development, and consumer preferences as key drivers of regional market expansion. The analysis includes market share data and growth potential projections for each identified region and segment. Europe and North America currently dominate, but Asia-Pacific is expected to witness rapid growth due to increased government support and rising consumer awareness.
- Key Drivers: Stringent environmental regulations in Europe, growing consumer awareness in North America, and rapid economic expansion in Asia-Pacific.
- Dominance Factors: High adoption rates in developed economies, coupled with government incentives and growing consumer preference for sustainable packaging in developing markets. Europe holds the largest market share of xx% in 2025.
- Growth Potential: Asia-Pacific is projected to experience the fastest growth, reaching xx million units by 2033.
Biodegradable Packaging Products Product Landscape
The biodegradable packaging product landscape is characterized by innovation in materials (PLA, PHA, starch-based blends), improved barrier properties, and enhanced functionalities tailored to specific applications. The sector showcases advanced technologies aimed at creating packaging that offers comparable or superior performance to conventional plastics while exhibiting complete biodegradability. Unique selling propositions focus on compostability, recyclability, and reduced environmental impact, catering to the growing demand for sustainable packaging solutions.
Key Drivers, Barriers & Challenges in Biodegradable Packaging Products
Key Drivers:
- Growing consumer preference for sustainable products.
- Increasing government regulations to reduce plastic waste.
- Technological advancements in biodegradable material production.
- Rising demand from the food & beverage sector for eco-friendly alternatives.
Challenges & Restraints:
- High production costs compared to conventional plastics.
- Inconsistent biodegradability across different composting conditions.
- Limited availability of suitable composting infrastructure in some regions.
- Competition from established petroleum-based packaging solutions. The high cost of production results in a xx% price difference compared to conventional plastics in 2025.
Emerging Opportunities in Biodegradable Packaging Products
Emerging opportunities lie in expanding into untapped markets, particularly in developing economies with growing consumer bases and increased environmental concerns. Innovative applications in areas like flexible packaging, foodservice disposables, and agricultural films present substantial growth prospects. Evolving consumer preferences towards personalized, customizable, and eco-friendly packaging solutions will also drive innovation and expansion.
Growth Accelerators in the Biodegradable Packaging Products Industry
Technological breakthroughs in material science, leading to improved biodegradability and performance characteristics, will significantly drive market growth. Strategic partnerships between packaging manufacturers and biomaterial producers are crucial for scaling production and meeting growing demand. Government incentives and subsidies, coupled with increased consumer awareness and demand for sustainable packaging solutions, will further accelerate market expansion.
Key Players Shaping the Biodegradable Packaging Products Market
- Ningbo Homelink Eco-itech
- Dongguan Sichun Plastic Products
- Hengxin Life Science and Technology
- Ecoplast Technologies
- Suzhou Hanfeng New Material
- Torise Biomaterials
- Anhui Xinke Biological Environmental Protection
- BioBag
- Novolex
- EnviGreen
- Plastiroll
- Sahachit
- Xtex Polythene
- Abbey Polythene
- Sarah Bio Plast
- Bulldog Bag
- Symphony Polymers
Notable Milestones in Biodegradable Packaging Products Sector
- 2020: EU Single-Use Plastics Directive comes into effect, stimulating innovation in biodegradable alternatives.
- 2021: Several major food and beverage companies commit to using 100% sustainable packaging by 2025.
- 2022: Launch of several new compostable packaging materials with enhanced barrier properties.
- 2023: Significant investments in biodegradable packaging manufacturing facilities in Asia-Pacific.
- 2024: Several key M&A deals consolidating the market.
In-Depth Biodegradable Packaging Products Market Outlook
The future of the biodegradable packaging market is bright, driven by sustained consumer demand for sustainable alternatives, increasingly stringent environmental regulations, and continuous technological advancements. Strategic partnerships, targeted investments in R&D, and expansion into new markets will be critical for companies to capitalize on the significant growth potential projected for the coming decade. The market is expected to see strong growth, driven by increasing consumer awareness and government initiatives aimed at reducing plastic pollution. The continued innovation in biodegradable material technologies and the expansion of appropriate recycling infrastructure will be crucial in driving this future growth.
Biodegradable Packaging Products Segmentation
-
1. Application
- 1.1. Food
- 1.2. Logistics
- 1.3. Supermarket
- 1.4. Hotel
- 1.5. Other
-
2. Types
- 2.1. Shopping Bag
- 2.2. Trash Bag
- 2.3. Packaging Bag
- 2.4. Other
Biodegradable Packaging Products Segmentation By Geography
-
1. North America
- 1.1. United States
- 1.2. Canada
- 1.3. Mexico
-
2. South America
- 2.1. Brazil
- 2.2. Argentina
- 2.3. Rest of South America
-
3. Europe
- 3.1. United Kingdom
- 3.2. Germany
- 3.3. France
- 3.4. Italy
- 3.5. Spain
- 3.6. Russia
- 3.7. Benelux
- 3.8. Nordics
- 3.9. Rest of Europe
-
4. Middle East & Africa
- 4.1. Turkey
- 4.2. Israel
- 4.3. GCC
- 4.4. North Africa
- 4.5. South Africa
- 4.6. Rest of Middle East & Africa
-
5. Asia Pacific
- 5.1. China
- 5.2. India
- 5.3. Japan
- 5.4. South Korea
- 5.5. ASEAN
- 5.6. Oceania
- 5.7. Rest of Asia Pacific
Biodegradable Packaging Products Regional Market Share
Geographic Coverage of Biodegradable Packaging Products
Biodegradable Packaging Products REPORT HIGHLIGHTS
| Aspects | Details |
|---|---|
| Study Period | 2020-2034 |
| Base Year | 2025 |
| Estimated Year | 2026 |
| Forecast Period | 2026-2034 |
| Historical Period | 2020-2025 |
| Growth Rate | CAGR of 6.8% from 2020-2034 |
| Segmentation |
|
Table of Contents
- 1. Introduction
- 1.1. Research Scope
- 1.2. Market Segmentation
- 1.3. Research Methodology
- 1.4. Definitions and Assumptions
- 2. Executive Summary
- 2.1. Introduction
- 3. Market Dynamics
- 3.1. Introduction
- 3.2. Market Drivers
- 3.3. Market Restrains
- 3.4. Market Trends
- 4. Market Factor Analysis
- 4.1. Porters Five Forces
- 4.2. Supply/Value Chain
- 4.3. PESTEL analysis
- 4.4. Market Entropy
- 4.5. Patent/Trademark Analysis
- 5. Global Biodegradable Packaging Products Analysis, Insights and Forecast, 2020-2032
- 5.1. Market Analysis, Insights and Forecast - by Application
- 5.1.1. Food
- 5.1.2. Logistics
- 5.1.3. Supermarket
- 5.1.4. Hotel
- 5.1.5. Other
- 5.2. Market Analysis, Insights and Forecast - by Types
- 5.2.1. Shopping Bag
- 5.2.2. Trash Bag
- 5.2.3. Packaging Bag
- 5.2.4. Other
- 5.3. Market Analysis, Insights and Forecast - by Region
- 5.3.1. North America
- 5.3.2. South America
- 5.3.3. Europe
- 5.3.4. Middle East & Africa
- 5.3.5. Asia Pacific
- 5.1. Market Analysis, Insights and Forecast - by Application
- 6. North America Biodegradable Packaging Products Analysis, Insights and Forecast, 2020-2032
- 6.1. Market Analysis, Insights and Forecast - by Application
- 6.1.1. Food
- 6.1.2. Logistics
- 6.1.3. Supermarket
- 6.1.4. Hotel
- 6.1.5. Other
- 6.2. Market Analysis, Insights and Forecast - by Types
- 6.2.1. Shopping Bag
- 6.2.2. Trash Bag
- 6.2.3. Packaging Bag
- 6.2.4. Other
- 6.1. Market Analysis, Insights and Forecast - by Application
- 7. South America Biodegradable Packaging Products Analysis, Insights and Forecast, 2020-2032
- 7.1. Market Analysis, Insights and Forecast - by Application
- 7.1.1. Food
- 7.1.2. Logistics
- 7.1.3. Supermarket
- 7.1.4. Hotel
- 7.1.5. Other
- 7.2. Market Analysis, Insights and Forecast - by Types
- 7.2.1. Shopping Bag
- 7.2.2. Trash Bag
- 7.2.3. Packaging Bag
- 7.2.4. Other
- 7.1. Market Analysis, Insights and Forecast - by Application
- 8. Europe Biodegradable Packaging Products Analysis, Insights and Forecast, 2020-2032
- 8.1. Market Analysis, Insights and Forecast - by Application
- 8.1.1. Food
- 8.1.2. Logistics
- 8.1.3. Supermarket
- 8.1.4. Hotel
- 8.1.5. Other
- 8.2. Market Analysis, Insights and Forecast - by Types
- 8.2.1. Shopping Bag
- 8.2.2. Trash Bag
- 8.2.3. Packaging Bag
- 8.2.4. Other
- 8.1. Market Analysis, Insights and Forecast - by Application
- 9. Middle East & Africa Biodegradable Packaging Products Analysis, Insights and Forecast, 2020-2032
- 9.1. Market Analysis, Insights and Forecast - by Application
- 9.1.1. Food
- 9.1.2. Logistics
- 9.1.3. Supermarket
- 9.1.4. Hotel
- 9.1.5. Other
- 9.2. Market Analysis, Insights and Forecast - by Types
- 9.2.1. Shopping Bag
- 9.2.2. Trash Bag
- 9.2.3. Packaging Bag
- 9.2.4. Other
- 9.1. Market Analysis, Insights and Forecast - by Application
- 10. Asia Pacific Biodegradable Packaging Products Analysis, Insights and Forecast, 2020-2032
- 10.1. Market Analysis, Insights and Forecast - by Application
- 10.1.1. Food
- 10.1.2. Logistics
- 10.1.3. Supermarket
- 10.1.4. Hotel
- 10.1.5. Other
- 10.2. Market Analysis, Insights and Forecast - by Types
- 10.2.1. Shopping Bag
- 10.2.2. Trash Bag
- 10.2.3. Packaging Bag
- 10.2.4. Other
- 10.1. Market Analysis, Insights and Forecast - by Application
- 11. Competitive Analysis
- 11.1. Global Market Share Analysis 2025
- 11.2. Company Profiles
- 11.2.1 Ningbo Homelink Eco-itech
- 11.2.1.1. Overview
- 11.2.1.2. Products
- 11.2.1.3. SWOT Analysis
- 11.2.1.4. Recent Developments
- 11.2.1.5. Financials (Based on Availability)
- 11.2.2 Dongguan Sichun Plastic Products
- 11.2.2.1. Overview
- 11.2.2.2. Products
- 11.2.2.3. SWOT Analysis
- 11.2.2.4. Recent Developments
- 11.2.2.5. Financials (Based on Availability)
- 11.2.3 Hengxin Life Science and Technology
- 11.2.3.1. Overview
- 11.2.3.2. Products
- 11.2.3.3. SWOT Analysis
- 11.2.3.4. Recent Developments
- 11.2.3.5. Financials (Based on Availability)
- 11.2.4 Ecoplast Technologies
- 11.2.4.1. Overview
- 11.2.4.2. Products
- 11.2.4.3. SWOT Analysis
- 11.2.4.4. Recent Developments
- 11.2.4.5. Financials (Based on Availability)
- 11.2.5 Suzhou Hanfeng New Material
- 11.2.5.1. Overview
- 11.2.5.2. Products
- 11.2.5.3. SWOT Analysis
- 11.2.5.4. Recent Developments
- 11.2.5.5. Financials (Based on Availability)
- 11.2.6 Torise Biomaterials
- 11.2.6.1. Overview
- 11.2.6.2. Products
- 11.2.6.3. SWOT Analysis
- 11.2.6.4. Recent Developments
- 11.2.6.5. Financials (Based on Availability)
- 11.2.7 Anhui Xinke Biological Environmental Protection
- 11.2.7.1. Overview
- 11.2.7.2. Products
- 11.2.7.3. SWOT Analysis
- 11.2.7.4. Recent Developments
- 11.2.7.5. Financials (Based on Availability)
- 11.2.8 BioBag
- 11.2.8.1. Overview
- 11.2.8.2. Products
- 11.2.8.3. SWOT Analysis
- 11.2.8.4. Recent Developments
- 11.2.8.5. Financials (Based on Availability)
- 11.2.9 Novolex
- 11.2.9.1. Overview
- 11.2.9.2. Products
- 11.2.9.3. SWOT Analysis
- 11.2.9.4. Recent Developments
- 11.2.9.5. Financials (Based on Availability)
- 11.2.10 EnviGreen
- 11.2.10.1. Overview
- 11.2.10.2. Products
- 11.2.10.3. SWOT Analysis
- 11.2.10.4. Recent Developments
- 11.2.10.5. Financials (Based on Availability)
- 11.2.11 Plastiroll
- 11.2.11.1. Overview
- 11.2.11.2. Products
- 11.2.11.3. SWOT Analysis
- 11.2.11.4. Recent Developments
- 11.2.11.5. Financials (Based on Availability)
- 11.2.12 Sahachit
- 11.2.12.1. Overview
- 11.2.12.2. Products
- 11.2.12.3. SWOT Analysis
- 11.2.12.4. Recent Developments
- 11.2.12.5. Financials (Based on Availability)
- 11.2.13 Xtex Polythene
- 11.2.13.1. Overview
- 11.2.13.2. Products
- 11.2.13.3. SWOT Analysis
- 11.2.13.4. Recent Developments
- 11.2.13.5. Financials (Based on Availability)
- 11.2.14 Abbey Polythene
- 11.2.14.1. Overview
- 11.2.14.2. Products
- 11.2.14.3. SWOT Analysis
- 11.2.14.4. Recent Developments
- 11.2.14.5. Financials (Based on Availability)
- 11.2.15 Sarah Bio Plast
- 11.2.15.1. Overview
- 11.2.15.2. Products
- 11.2.15.3. SWOT Analysis
- 11.2.15.4. Recent Developments
- 11.2.15.5. Financials (Based on Availability)
- 11.2.16 Bulldog Bag
- 11.2.16.1. Overview
- 11.2.16.2. Products
- 11.2.16.3. SWOT Analysis
- 11.2.16.4. Recent Developments
- 11.2.16.5. Financials (Based on Availability)
- 11.2.17 Symphony Polymers
- 11.2.17.1. Overview
- 11.2.17.2. Products
- 11.2.17.3. SWOT Analysis
- 11.2.17.4. Recent Developments
- 11.2.17.5. Financials (Based on Availability)
- 11.2.1 Ningbo Homelink Eco-itech
List of Figures
- Figure 1: Global Biodegradable Packaging Products Revenue Breakdown (undefined, %) by Region 2025 & 2033
- Figure 2: Global Biodegradable Packaging Products Volume Breakdown (K, %) by Region 2025 & 2033
- Figure 3: North America Biodegradable Packaging Products Revenue (undefined), by Application 2025 & 2033
- Figure 4: North America Biodegradable Packaging Products Volume (K), by Application 2025 & 2033
- Figure 5: North America Biodegradable Packaging Products Revenue Share (%), by Application 2025 & 2033
- Figure 6: North America Biodegradable Packaging Products Volume Share (%), by Application 2025 & 2033
- Figure 7: North America Biodegradable Packaging Products Revenue (undefined), by Types 2025 & 2033
- Figure 8: North America Biodegradable Packaging Products Volume (K), by Types 2025 & 2033
- Figure 9: North America Biodegradable Packaging Products Revenue Share (%), by Types 2025 & 2033
- Figure 10: North America Biodegradable Packaging Products Volume Share (%), by Types 2025 & 2033
- Figure 11: North America Biodegradable Packaging Products Revenue (undefined), by Country 2025 & 2033
- Figure 12: North America Biodegradable Packaging Products Volume (K), by Country 2025 & 2033
- Figure 13: North America Biodegradable Packaging Products Revenue Share (%), by Country 2025 & 2033
- Figure 14: North America Biodegradable Packaging Products Volume Share (%), by Country 2025 & 2033
- Figure 15: South America Biodegradable Packaging Products Revenue (undefined), by Application 2025 & 2033
- Figure 16: South America Biodegradable Packaging Products Volume (K), by Application 2025 & 2033
- Figure 17: South America Biodegradable Packaging Products Revenue Share (%), by Application 2025 & 2033
- Figure 18: South America Biodegradable Packaging Products Volume Share (%), by Application 2025 & 2033
- Figure 19: South America Biodegradable Packaging Products Revenue (undefined), by Types 2025 & 2033
- Figure 20: South America Biodegradable Packaging Products Volume (K), by Types 2025 & 2033
- Figure 21: South America Biodegradable Packaging Products Revenue Share (%), by Types 2025 & 2033
- Figure 22: South America Biodegradable Packaging Products Volume Share (%), by Types 2025 & 2033
- Figure 23: South America Biodegradable Packaging Products Revenue (undefined), by Country 2025 & 2033
- Figure 24: South America Biodegradable Packaging Products Volume (K), by Country 2025 & 2033
- Figure 25: South America Biodegradable Packaging Products Revenue Share (%), by Country 2025 & 2033
- Figure 26: South America Biodegradable Packaging Products Volume Share (%), by Country 2025 & 2033
- Figure 27: Europe Biodegradable Packaging Products Revenue (undefined), by Application 2025 & 2033
- Figure 28: Europe Biodegradable Packaging Products Volume (K), by Application 2025 & 2033
- Figure 29: Europe Biodegradable Packaging Products Revenue Share (%), by Application 2025 & 2033
- Figure 30: Europe Biodegradable Packaging Products Volume Share (%), by Application 2025 & 2033
- Figure 31: Europe Biodegradable Packaging Products Revenue (undefined), by Types 2025 & 2033
- Figure 32: Europe Biodegradable Packaging Products Volume (K), by Types 2025 & 2033
- Figure 33: Europe Biodegradable Packaging Products Revenue Share (%), by Types 2025 & 2033
- Figure 34: Europe Biodegradable Packaging Products Volume Share (%), by Types 2025 & 2033
- Figure 35: Europe Biodegradable Packaging Products Revenue (undefined), by Country 2025 & 2033
- Figure 36: Europe Biodegradable Packaging Products Volume (K), by Country 2025 & 2033
- Figure 37: Europe Biodegradable Packaging Products Revenue Share (%), by Country 2025 & 2033
- Figure 38: Europe Biodegradable Packaging Products Volume Share (%), by Country 2025 & 2033
- Figure 39: Middle East & Africa Biodegradable Packaging Products Revenue (undefined), by Application 2025 & 2033
- Figure 40: Middle East & Africa Biodegradable Packaging Products Volume (K), by Application 2025 & 2033
- Figure 41: Middle East & Africa Biodegradable Packaging Products Revenue Share (%), by Application 2025 & 2033
- Figure 42: Middle East & Africa Biodegradable Packaging Products Volume Share (%), by Application 2025 & 2033
- Figure 43: Middle East & Africa Biodegradable Packaging Products Revenue (undefined), by Types 2025 & 2033
- Figure 44: Middle East & Africa Biodegradable Packaging Products Volume (K), by Types 2025 & 2033
- Figure 45: Middle East & Africa Biodegradable Packaging Products Revenue Share (%), by Types 2025 & 2033
- Figure 46: Middle East & Africa Biodegradable Packaging Products Volume Share (%), by Types 2025 & 2033
- Figure 47: Middle East & Africa Biodegradable Packaging Products Revenue (undefined), by Country 2025 & 2033
- Figure 48: Middle East & Africa Biodegradable Packaging Products Volume (K), by Country 2025 & 2033
- Figure 49: Middle East & Africa Biodegradable Packaging Products Revenue Share (%), by Country 2025 & 2033
- Figure 50: Middle East & Africa Biodegradable Packaging Products Volume Share (%), by Country 2025 & 2033
- Figure 51: Asia Pacific Biodegradable Packaging Products Revenue (undefined), by Application 2025 & 2033
- Figure 52: Asia Pacific Biodegradable Packaging Products Volume (K), by Application 2025 & 2033
- Figure 53: Asia Pacific Biodegradable Packaging Products Revenue Share (%), by Application 2025 & 2033
- Figure 54: Asia Pacific Biodegradable Packaging Products Volume Share (%), by Application 2025 & 2033
- Figure 55: Asia Pacific Biodegradable Packaging Products Revenue (undefined), by Types 2025 & 2033
- Figure 56: Asia Pacific Biodegradable Packaging Products Volume (K), by Types 2025 & 2033
- Figure 57: Asia Pacific Biodegradable Packaging Products Revenue Share (%), by Types 2025 & 2033
- Figure 58: Asia Pacific Biodegradable Packaging Products Volume Share (%), by Types 2025 & 2033
- Figure 59: Asia Pacific Biodegradable Packaging Products Revenue (undefined), by Country 2025 & 2033
- Figure 60: Asia Pacific Biodegradable Packaging Products Volume (K), by Country 2025 & 2033
- Figure 61: Asia Pacific Biodegradable Packaging Products Revenue Share (%), by Country 2025 & 2033
- Figure 62: Asia Pacific Biodegradable Packaging Products Volume Share (%), by Country 2025 & 2033
List of Tables
- Table 1: Global Biodegradable Packaging Products Revenue undefined Forecast, by Application 2020 & 2033
- Table 2: Global Biodegradable Packaging Products Volume K Forecast, by Application 2020 & 2033
- Table 3: Global Biodegradable Packaging Products Revenue undefined Forecast, by Types 2020 & 2033
- Table 4: Global Biodegradable Packaging Products Volume K Forecast, by Types 2020 & 2033
- Table 5: Global Biodegradable Packaging Products Revenue undefined Forecast, by Region 2020 & 2033
- Table 6: Global Biodegradable Packaging Products Volume K Forecast, by Region 2020 & 2033
- Table 7: Global Biodegradable Packaging Products Revenue undefined Forecast, by Application 2020 & 2033
- Table 8: Global Biodegradable Packaging Products Volume K Forecast, by Application 2020 & 2033
- Table 9: Global Biodegradable Packaging Products Revenue undefined Forecast, by Types 2020 & 2033
- Table 10: Global Biodegradable Packaging Products Volume K Forecast, by Types 2020 & 2033
- Table 11: Global Biodegradable Packaging Products Revenue undefined Forecast, by Country 2020 & 2033
- Table 12: Global Biodegradable Packaging Products Volume K Forecast, by Country 2020 & 2033
- Table 13: United States Biodegradable Packaging Products Revenue (undefined) Forecast, by Application 2020 & 2033
- Table 14: United States Biodegradable Packaging Products Volume (K) Forecast, by Application 2020 & 2033
- Table 15: Canada Biodegradable Packaging Products Revenue (undefined) Forecast, by Application 2020 & 2033
- Table 16: Canada Biodegradable Packaging Products Volume (K) Forecast, by Application 2020 & 2033
- Table 17: Mexico Biodegradable Packaging Products Revenue (undefined) Forecast, by Application 2020 & 2033
- Table 18: Mexico Biodegradable Packaging Products Volume (K) Forecast, by Application 2020 & 2033
- Table 19: Global Biodegradable Packaging Products Revenue undefined Forecast, by Application 2020 & 2033
- Table 20: Global Biodegradable Packaging Products Volume K Forecast, by Application 2020 & 2033
- Table 21: Global Biodegradable Packaging Products Revenue undefined Forecast, by Types 2020 & 2033
- Table 22: Global Biodegradable Packaging Products Volume K Forecast, by Types 2020 & 2033
- Table 23: Global Biodegradable Packaging Products Revenue undefined Forecast, by Country 2020 & 2033
- Table 24: Global Biodegradable Packaging Products Volume K Forecast, by Country 2020 & 2033
- Table 25: Brazil Biodegradable Packaging Products Revenue (undefined) Forecast, by Application 2020 & 2033
- Table 26: Brazil Biodegradable Packaging Products Volume (K) Forecast, by Application 2020 & 2033
- Table 27: Argentina Biodegradable Packaging Products Revenue (undefined) Forecast, by Application 2020 & 2033
- Table 28: Argentina Biodegradable Packaging Products Volume (K) Forecast, by Application 2020 & 2033
- Table 29: Rest of South America Biodegradable Packaging Products Revenue (undefined) Forecast, by Application 2020 & 2033
- Table 30: Rest of South America Biodegradable Packaging Products Volume (K) Forecast, by Application 2020 & 2033
- Table 31: Global Biodegradable Packaging Products Revenue undefined Forecast, by Application 2020 & 2033
- Table 32: Global Biodegradable Packaging Products Volume K Forecast, by Application 2020 & 2033
- Table 33: Global Biodegradable Packaging Products Revenue undefined Forecast, by Types 2020 & 2033
- Table 34: Global Biodegradable Packaging Products Volume K Forecast, by Types 2020 & 2033
- Table 35: Global Biodegradable Packaging Products Revenue undefined Forecast, by Country 2020 & 2033
- Table 36: Global Biodegradable Packaging Products Volume K Forecast, by Country 2020 & 2033
- Table 37: United Kingdom Biodegradable Packaging Products Revenue (undefined) Forecast, by Application 2020 & 2033
- Table 38: United Kingdom Biodegradable Packaging Products Volume (K) Forecast, by Application 2020 & 2033
- Table 39: Germany Biodegradable Packaging Products Revenue (undefined) Forecast, by Application 2020 & 2033
- Table 40: Germany Biodegradable Packaging Products Volume (K) Forecast, by Application 2020 & 2033
- Table 41: France Biodegradable Packaging Products Revenue (undefined) Forecast, by Application 2020 & 2033
- Table 42: France Biodegradable Packaging Products Volume (K) Forecast, by Application 2020 & 2033
- Table 43: Italy Biodegradable Packaging Products Revenue (undefined) Forecast, by Application 2020 & 2033
- Table 44: Italy Biodegradable Packaging Products Volume (K) Forecast, by Application 2020 & 2033
- Table 45: Spain Biodegradable Packaging Products Revenue (undefined) Forecast, by Application 2020 & 2033
- Table 46: Spain Biodegradable Packaging Products Volume (K) Forecast, by Application 2020 & 2033
- Table 47: Russia Biodegradable Packaging Products Revenue (undefined) Forecast, by Application 2020 & 2033
- Table 48: Russia Biodegradable Packaging Products Volume (K) Forecast, by Application 2020 & 2033
- Table 49: Benelux Biodegradable Packaging Products Revenue (undefined) Forecast, by Application 2020 & 2033
- Table 50: Benelux Biodegradable Packaging Products Volume (K) Forecast, by Application 2020 & 2033
- Table 51: Nordics Biodegradable Packaging Products Revenue (undefined) Forecast, by Application 2020 & 2033
- Table 52: Nordics Biodegradable Packaging Products Volume (K) Forecast, by Application 2020 & 2033
- Table 53: Rest of Europe Biodegradable Packaging Products Revenue (undefined) Forecast, by Application 2020 & 2033
- Table 54: Rest of Europe Biodegradable Packaging Products Volume (K) Forecast, by Application 2020 & 2033
- Table 55: Global Biodegradable Packaging Products Revenue undefined Forecast, by Application 2020 & 2033
- Table 56: Global Biodegradable Packaging Products Volume K Forecast, by Application 2020 & 2033
- Table 57: Global Biodegradable Packaging Products Revenue undefined Forecast, by Types 2020 & 2033
- Table 58: Global Biodegradable Packaging Products Volume K Forecast, by Types 2020 & 2033
- Table 59: Global Biodegradable Packaging Products Revenue undefined Forecast, by Country 2020 & 2033
- Table 60: Global Biodegradable Packaging Products Volume K Forecast, by Country 2020 & 2033
- Table 61: Turkey Biodegradable Packaging Products Revenue (undefined) Forecast, by Application 2020 & 2033
- Table 62: Turkey Biodegradable Packaging Products Volume (K) Forecast, by Application 2020 & 2033
- Table 63: Israel Biodegradable Packaging Products Revenue (undefined) Forecast, by Application 2020 & 2033
- Table 64: Israel Biodegradable Packaging Products Volume (K) Forecast, by Application 2020 & 2033
- Table 65: GCC Biodegradable Packaging Products Revenue (undefined) Forecast, by Application 2020 & 2033
- Table 66: GCC Biodegradable Packaging Products Volume (K) Forecast, by Application 2020 & 2033
- Table 67: North Africa Biodegradable Packaging Products Revenue (undefined) Forecast, by Application 2020 & 2033
- Table 68: North Africa Biodegradable Packaging Products Volume (K) Forecast, by Application 2020 & 2033
- Table 69: South Africa Biodegradable Packaging Products Revenue (undefined) Forecast, by Application 2020 & 2033
- Table 70: South Africa Biodegradable Packaging Products Volume (K) Forecast, by Application 2020 & 2033
- Table 71: Rest of Middle East & Africa Biodegradable Packaging Products Revenue (undefined) Forecast, by Application 2020 & 2033
- Table 72: Rest of Middle East & Africa Biodegradable Packaging Products Volume (K) Forecast, by Application 2020 & 2033
- Table 73: Global Biodegradable Packaging Products Revenue undefined Forecast, by Application 2020 & 2033
- Table 74: Global Biodegradable Packaging Products Volume K Forecast, by Application 2020 & 2033
- Table 75: Global Biodegradable Packaging Products Revenue undefined Forecast, by Types 2020 & 2033
- Table 76: Global Biodegradable Packaging Products Volume K Forecast, by Types 2020 & 2033
- Table 77: Global Biodegradable Packaging Products Revenue undefined Forecast, by Country 2020 & 2033
- Table 78: Global Biodegradable Packaging Products Volume K Forecast, by Country 2020 & 2033
- Table 79: China Biodegradable Packaging Products Revenue (undefined) Forecast, by Application 2020 & 2033
- Table 80: China Biodegradable Packaging Products Volume (K) Forecast, by Application 2020 & 2033
- Table 81: India Biodegradable Packaging Products Revenue (undefined) Forecast, by Application 2020 & 2033
- Table 82: India Biodegradable Packaging Products Volume (K) Forecast, by Application 2020 & 2033
- Table 83: Japan Biodegradable Packaging Products Revenue (undefined) Forecast, by Application 2020 & 2033
- Table 84: Japan Biodegradable Packaging Products Volume (K) Forecast, by Application 2020 & 2033
- Table 85: South Korea Biodegradable Packaging Products Revenue (undefined) Forecast, by Application 2020 & 2033
- Table 86: South Korea Biodegradable Packaging Products Volume (K) Forecast, by Application 2020 & 2033
- Table 87: ASEAN Biodegradable Packaging Products Revenue (undefined) Forecast, by Application 2020 & 2033
- Table 88: ASEAN Biodegradable Packaging Products Volume (K) Forecast, by Application 2020 & 2033
- Table 89: Oceania Biodegradable Packaging Products Revenue (undefined) Forecast, by Application 2020 & 2033
- Table 90: Oceania Biodegradable Packaging Products Volume (K) Forecast, by Application 2020 & 2033
- Table 91: Rest of Asia Pacific Biodegradable Packaging Products Revenue (undefined) Forecast, by Application 2020 & 2033
- Table 92: Rest of Asia Pacific Biodegradable Packaging Products Volume (K) Forecast, by Application 2020 & 2033
Frequently Asked Questions
1. What is the projected Compound Annual Growth Rate (CAGR) of the Biodegradable Packaging Products?
The projected CAGR is approximately 6.8%.
2. Which companies are prominent players in the Biodegradable Packaging Products?
Key companies in the market include Ningbo Homelink Eco-itech, Dongguan Sichun Plastic Products, Hengxin Life Science and Technology, Ecoplast Technologies, Suzhou Hanfeng New Material, Torise Biomaterials, Anhui Xinke Biological Environmental Protection, BioBag, Novolex, EnviGreen, Plastiroll, Sahachit, Xtex Polythene, Abbey Polythene, Sarah Bio Plast, Bulldog Bag, Symphony Polymers.
3. What are the main segments of the Biodegradable Packaging Products?
The market segments include Application, Types.
4. Can you provide details about the market size?
The market size is estimated to be USD XXX N/A as of 2022.
5. What are some drivers contributing to market growth?
N/A
6. What are the notable trends driving market growth?
N/A
7. Are there any restraints impacting market growth?
N/A
8. Can you provide examples of recent developments in the market?
N/A
9. What pricing options are available for accessing the report?
Pricing options include single-user, multi-user, and enterprise licenses priced at USD 3350.00, USD 5025.00, and USD 6700.00 respectively.
10. Is the market size provided in terms of value or volume?
The market size is provided in terms of value, measured in N/A and volume, measured in K.
11. Are there any specific market keywords associated with the report?
Yes, the market keyword associated with the report is "Biodegradable Packaging Products," which aids in identifying and referencing the specific market segment covered.
12. How do I determine which pricing option suits my needs best?
The pricing options vary based on user requirements and access needs. Individual users may opt for single-user licenses, while businesses requiring broader access may choose multi-user or enterprise licenses for cost-effective access to the report.
13. Are there any additional resources or data provided in the Biodegradable Packaging Products report?
While the report offers comprehensive insights, it's advisable to review the specific contents or supplementary materials provided to ascertain if additional resources or data are available.
14. How can I stay updated on further developments or reports in the Biodegradable Packaging Products?
To stay informed about further developments, trends, and reports in the Biodegradable Packaging Products, consider subscribing to industry newsletters, following relevant companies and organizations, or regularly checking reputable industry news sources and publications.
Methodology
Step 1 - Identification of Relevant Samples Size from Population Database


Step 2 - Approaches for Defining Global Market Size (Value, Volume* & Price*)

Note*: In applicable scenarios
Step 3 - Data Sources
Primary Research
- Web Analytics
- Survey Reports
- Research Institute
- Latest Research Reports
- Opinion Leaders
Secondary Research
- Annual Reports
- White Paper
- Latest Press Release
- Industry Association
- Paid Database
- Investor Presentations

Step 4 - Data Triangulation
Involves using different sources of information in order to increase the validity of a study
These sources are likely to be stakeholders in a program - participants, other researchers, program staff, other community members, and so on.
Then we put all data in single framework & apply various statistical tools to find out the dynamic on the market.
During the analysis stage, feedback from the stakeholder groups would be compared to determine areas of agreement as well as areas of divergence