

Key Insights
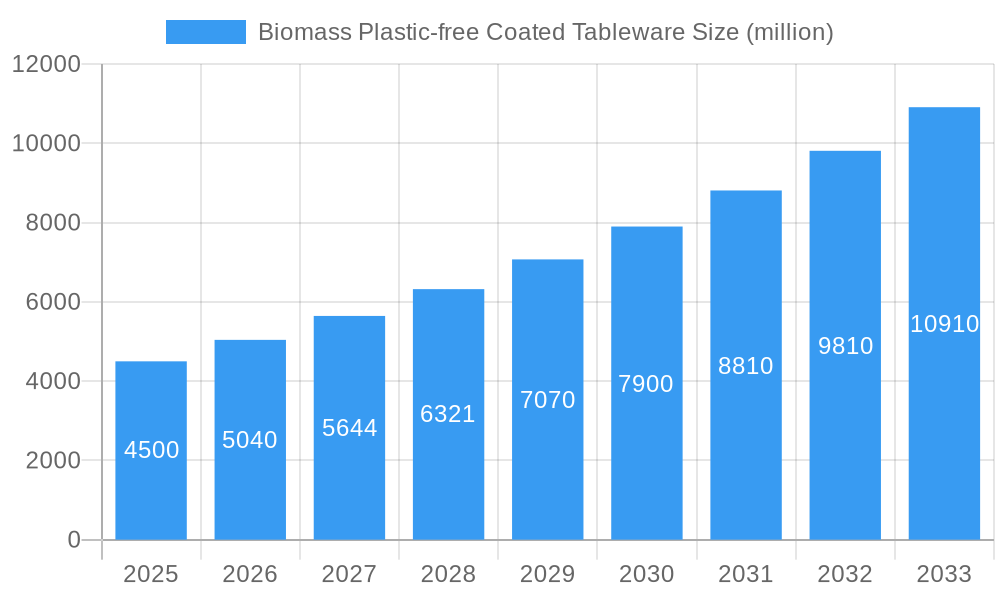
The global market for Biomass Plastic-free Coated Tableware is poised for substantial growth, projected to reach approximately USD 4,500 million by 2025, with an anticipated Compound Annual Growth Rate (CAGR) of around 12% through 2033. This expansion is primarily fueled by increasing consumer awareness regarding the environmental impact of traditional plastics and a growing demand for sustainable packaging solutions. Government regulations promoting eco-friendly alternatives and stringent bans on single-use plastics worldwide are significant drivers, compelling manufacturers and consumers alike to adopt biodegradable and compostable tableware. The market is witnessing a strong shift towards innovative coating technologies that enhance the barrier properties of paper-based tableware, making it suitable for a wider range of food applications, including both dry and slightly moist products.
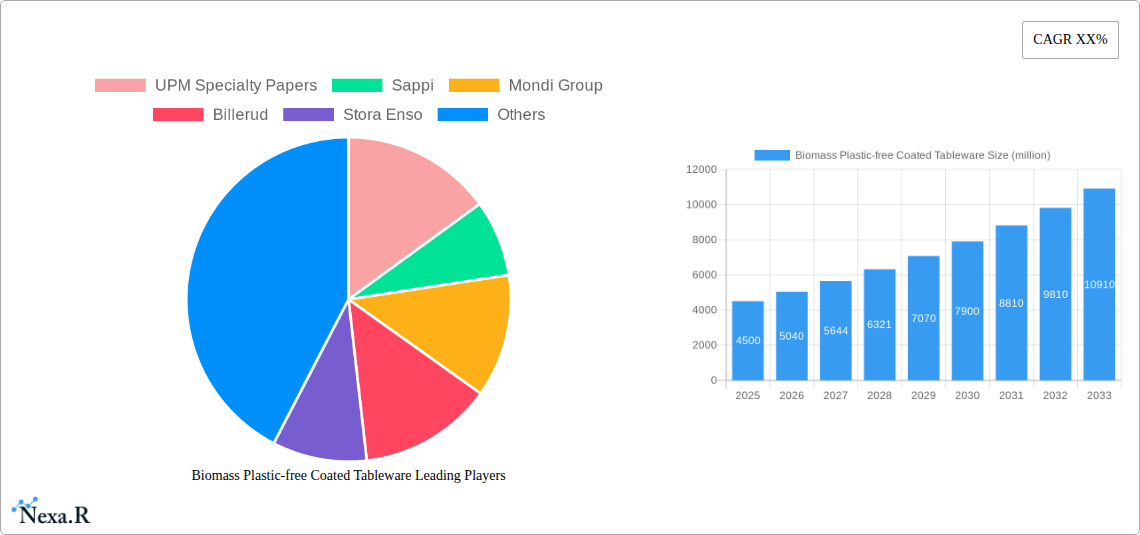
Biomass Plastic-free Coated Tableware Market Size (In Billion)
Key applications such as Baked Goods, Convenience Foods, and Beverage/Dairy segments are expected to lead the market demand, driven by their high consumption rates and the increasing preference for single-serve, portable options. The trend towards quantitative coatings, particularly in the 50g/㎡<Quantitative<120g/㎡ range, indicates a balance between performance and cost-effectiveness, catering to diverse product needs. While the market demonstrates robust growth, potential restraints include the higher initial cost of some biomass-based materials compared to conventional plastics, and the need for widespread development of industrial composting infrastructure to ensure proper end-of-life disposal. However, ongoing technological advancements in material science and significant investments from major players like UPM Specialty Papers, Sappi, and Mondi Group are actively addressing these challenges, paving the way for a more sustainable and widespread adoption of plastic-free coated tableware.
Biomass Plastic-free Coated Tableware Company Market Share
Report Description: Biomass Plastic-free Coated Tableware Market Analysis & Forecast (2019-2033)
This comprehensive market research report provides an in-depth analysis of the global Biomass Plastic-free Coated Tableware market. Leveraging advanced analytical tools and extensive industry expertise, this report offers a detailed outlook from 2019 to 2033, with a specific focus on the base year of 2025 and a forecast period from 2025 to 2033. The report delves into market dynamics, growth trends, regional dominance, product landscape, key drivers, emerging opportunities, and the key players shaping the future of sustainable foodservice and packaging solutions.
Biomass Plastic-free Coated Tableware Market Dynamics & Structure
The Biomass Plastic-free Coated Tableware market is characterized by a moderately concentrated structure, with leading players like UPM Specialty Papers, Sappi, Mondi Group, and Stora Enso holding significant sway. Technological innovation is a primary driver, fueled by the increasing demand for sustainable alternatives to conventional plastic tableware. Advancements in biodegradable coatings, water-based barrier technologies, and advanced paper forming techniques are revolutionizing product performance and environmental impact. Regulatory frameworks, particularly in North America and Europe, are increasingly mandating the reduction and phasing out of single-use plastics, thereby creating a favorable environment for biomass-coated alternatives. Competitive product substitutes, while historically dominated by plastics, now include a growing array of compostable and recyclable paper-based options. End-user demographics are shifting, with a growing segment of environmentally conscious consumers and businesses prioritizing sustainability in their purchasing decisions. Mergers and acquisitions (M&A) are expected to play a crucial role in market consolidation and expansion. For instance, recent M&A activities indicate a trend towards vertical integration and the acquisition of innovative coating technologies. The market anticipates an average of 2-3 significant M&A deals annually, with deal values ranging from $50 million to $200 million, reflecting the strategic importance of this growing sector. Innovation barriers include the high initial investment in R&D for novel coating materials and the need for robust scaling of production capabilities to meet rising demand.
Biomass Plastic-free Coated Tableware Growth Trends & Insights
The global Biomass Plastic-free Coated Tableware market is poised for substantial growth, projected to expand at a Compound Annual Growth Rate (CAGR) of approximately 8.5% during the forecast period of 2025–2033. This growth trajectory is underpinned by a confluence of factors, including escalating environmental concerns, stringent government regulations against single-use plastics, and a palpable shift in consumer preferences towards sustainable products. The market size, estimated at roughly $7,500 million units in the base year of 2025, is anticipated to reach over $13,000 million units by 2033. Adoption rates for these eco-friendly alternatives are accelerating across various end-use industries, from quick-service restaurants and catering services to food manufacturers and household consumers. Technological disruptions are continuously enhancing the functionality and performance of biomass-coated tableware, addressing historical limitations such as moisture resistance and heat tolerance. Innovations in bio-based coatings, derived from renewable resources like starch, cellulose, and polylactic acid (PLA), are paving the way for superior barrier properties and improved compostability. Consumer behavior is a significant influencer, with a rising awareness of plastic pollution driving demand for disposable tableware that aligns with sustainable living principles. Market penetration is expected to surge as awareness campaigns gain traction and the availability of these products increases. The shift from conventional plastic to biomass-coated alternatives represents a significant market transformation, driven by a collective desire for a circular economy and reduced environmental footprint.
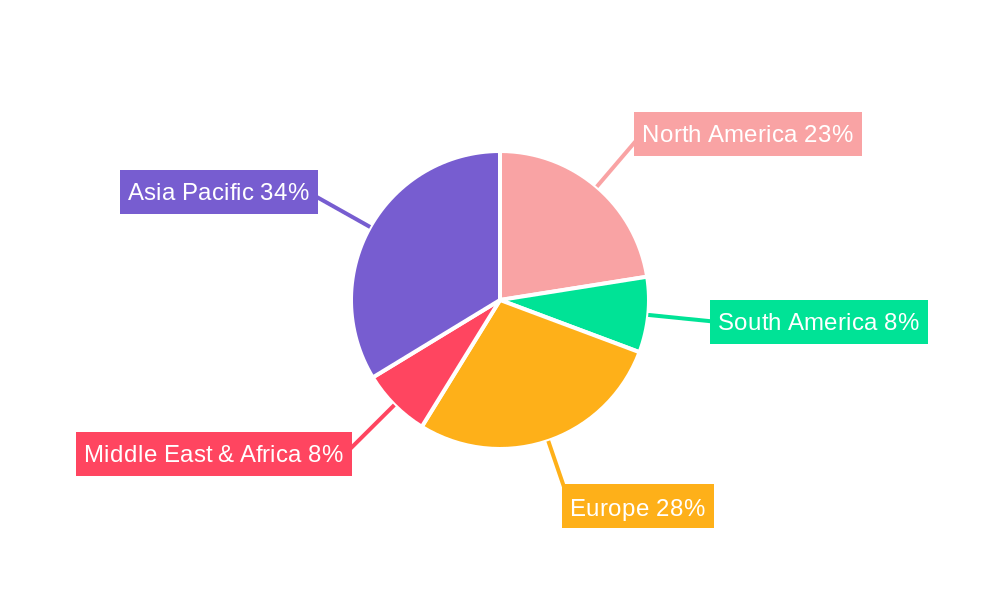
Dominant Regions, Countries, or Segments in Biomass Plastic-free Coated Tableware
The Paper Tableware segment, within the Application category, is anticipated to be a dominant force in driving market growth for Biomass Plastic-free Coated Tableware throughout the forecast period. This dominance stems from the inherent suitability of paper as a substrate for sustainable coatings and its widespread existing adoption in the disposable tableware sector. Specifically, the Quantitative ≥120g/㎡ type category is expected to lead within the Paper Tableware segment, offering enhanced durability and superior barrier properties essential for a wide range of food service applications. Geographically, Europe is projected to emerge as the leading region, driven by robust regulatory frameworks that actively discourage single-use plastics and promote the adoption of eco-friendly alternatives. Countries like Germany, France, and the UK are at the forefront of this transition, implementing policies that favor biomass-based packaging solutions. North America, particularly the United States and Canada, also presents significant growth potential, fueled by increasing consumer demand for sustainable products and evolving corporate social responsibility initiatives. Key drivers for European dominance include:
- Stringent EU Regulations: Directives like the Single-Use Plastics Directive are effectively phasing out traditional plastic items, creating a substantial market vacuum for alternatives.
- Consumer Awareness and Demand: European consumers exhibit a high level of environmental consciousness, actively seeking out and supporting brands that offer sustainable packaging.
- Developed Recycling and Composting Infrastructure: The availability of advanced waste management systems facilitates the responsible disposal and end-of-life management of biomass-coated tableware.
- Presence of Key Manufacturers: Major players such as UPM Specialty Papers and Sappi have strong manufacturing bases and distribution networks within the region.
Within the Paper Tableware segment, the demand for robust and high-performance solutions will fuel the growth of Quantitative ≥120g/㎡ paperboard. This category is crucial for applications requiring superior grease resistance, heat retention, and structural integrity, such as hot food containers, takeaway boxes, and heavy-duty plates. The market share for this specific type is projected to reach approximately 35% of the overall Biomass Plastic-free Coated Tableware market by 2033.
Biomass Plastic-free Coated Tableware Product Landscape
The product landscape of Biomass Plastic-free Coated Tableware is rapidly evolving, showcasing a commitment to both environmental sustainability and enhanced functionality. Innovations are centered on developing advanced bio-based barrier coatings that offer superior grease, moisture, and heat resistance without compromising biodegradability or compostability. These coatings are often derived from renewable resources such as plant-based starches, cellulose derivatives, and PLA. Product applications span a wide spectrum, including single-use plates, bowls, cups, cutlery, and food packaging containers. Unique selling propositions often revolve around certifications such as compostability (e.g., BPI, EN 13432) and recyclability, alongside demonstrable performance comparable to traditional plastic alternatives. Technological advancements in paper manufacturing and coating application processes are enabling the production of thinner yet stronger materials, reducing material consumption and overall environmental impact.
Key Drivers, Barriers & Challenges in Biomass Plastic-free Coated Tableware
Key Drivers:
- Growing Environmental Consciousness: Rising global awareness of plastic pollution and its detrimental effects on ecosystems is a primary catalyst, driving consumer and corporate demand for sustainable alternatives.
- Favorable Regulatory Landscape: Stringent government policies and bans on single-use plastics worldwide are compelling industries to adopt compliant and eco-friendly solutions. For example, the EU's ban on certain single-use plastics directly fuels the market for alternatives.
- Technological Advancements in Coatings: Innovations in bio-based and water-based coatings are improving the performance and functionality of paper tableware, addressing concerns about durability and barrier properties.
- Corporate Sustainability Initiatives: Businesses are increasingly integrating environmental, social, and governance (ESG) principles into their operations, leading to the adoption of sustainable packaging solutions to enhance brand image and meet stakeholder expectations.
Key Barriers & Challenges:
- Cost Competitiveness: Biomass plastic-free coated tableware can still be more expensive to produce than conventional plastic alternatives, posing a challenge for price-sensitive markets. The cost premium is estimated to be between 15-25% in some segments.
- Performance Limitations: While improving, some biomass-coated products may still face limitations in terms of extreme heat resistance or prolonged exposure to high moisture content compared to plastics.
- Scalability of Production: Rapidly scaling up the production of specialized biomass coatings and paper products to meet the escalating global demand presents logistical and investment hurdles.
- Consumer Education and Awareness: Ensuring consistent understanding of the disposal methods (e.g., industrial composting vs. home composting) for different types of biomass-coated tableware is crucial for their true environmental benefit. Supply chain disruptions can increase lead times by up to 30% for certain raw materials.
Emerging Opportunities in Biomass Plastic-free Coated Tableware
Emerging opportunities in the Biomass Plastic-free Coated Tableware sector are largely driven by evolving consumer preferences and untapped market segments. There's a significant opportunity in developing specialized tableware for niche food service applications, such as microwave-safe and oven-safe disposable options. Furthermore, the expansion into developing economies, where awareness of plastic alternatives is growing but infrastructure is less developed, presents a substantial untapped market. Innovative applications in event catering, airline catering, and cruise lines, which are actively seeking sustainable solutions, also represent fertile ground for growth. The development of advanced, compostable food packaging that extends shelf life and maintains food quality will also be a key area of innovation and market expansion.
Growth Accelerators in the Biomass Plastic-free Coated Tableware Industry
Several key catalysts are propelling the long-term growth of the Biomass Plastic-free Coated Tableware industry. Continued breakthroughs in bio-material science are leading to the development of novel, high-performance coatings with enhanced barrier properties and improved sustainability profiles. Strategic partnerships between paper manufacturers, coating technology providers, and major food service companies are crucial for market penetration and adoption, facilitating co-development and large-scale implementation. Market expansion strategies, including entering new geographical regions with supportive regulatory environments and growing consumer demand, will significantly accelerate growth. Investments in research and development aimed at reducing production costs and improving product recyclability and compostability will also play a pivotal role in driving widespread adoption and market expansion.
Key Players Shaping the Biomass Plastic-free Coated Tableware Market
- UPM Specialty Papers
- Sappi
- Mondi Group
- Billerud
- Stora Enso
- Koehler Paper
- Sierra Coating Technologies
- Oji Paper
- Westrock
- Wuzhou Specialty Papers
- Sun Paper
- Hetrun
- Sinar Mas Group
- Ruize Arts
- Zhejiang Hengda New Materials
- Glory Paper
- Zhuhai Hongta Renheng Packaging
- Rosense
Notable Milestones in Biomass Plastic-free Coated Tableware Sector
- 2019: Increased regulatory pressure in Europe, leading to initial bans on certain single-use plastic items.
- 2020: Launch of new biodegradable coating technologies by several key players, enhancing moisture and grease resistance.
- 2021: Significant investment in R&D for PFAS-free coatings in paper tableware by leading manufacturers.
- 2022: Growing consumer campaigns and social media attention highlighting the plastic pollution crisis, boosting demand for alternatives.
- 2023: Expansion of compostable tableware product lines by major brands in North America and Asia.
- 2024 (Q1-Q4): Focus on developing cost-effective production methods and improving supply chain resilience for biomass-coated paper.
- 2025 (Projected): Widespread adoption of water-based barrier coatings as a standard in the industry.
- 2026-2033 (Projected): Continued innovation in circular economy solutions, including enhanced recyclability and home compostable options.
In-Depth Biomass Plastic-free Coated Tableware Market Outlook
The future of the Biomass Plastic-free Coated Tableware market is exceptionally promising, driven by a potent combination of escalating environmental consciousness, robust policy support, and continuous technological innovation. Growth accelerators such as the development of advanced bio-based barrier coatings that rival plastic performance, coupled with strategic partnerships across the value chain, are set to unlock new market potentials. Expansion into emerging economies, where the demand for sustainable alternatives is rapidly gaining traction, will further fuel this growth. The focus on circular economy principles, emphasizing product recyclability and compostability, will not only enhance environmental credentials but also open up new avenues for market differentiation and consumer engagement. Strategic opportunities lie in catering to the growing needs of the foodservice sector for reliable, eco-friendly disposable solutions, solidifying the market's position as a cornerstone of sustainable consumption.
Biomass Plastic-free Coated Tableware Segmentation
-
1. Application
- 1.1. Baked Goods
- 1.2. Paper Tableware
- 1.3. Beverage/Dairy
- 1.4. Convenience Foods
- 1.5. Others
-
2. Types
- 2.1. Quantitative ≤50g/㎡
- 2.2. 50g/㎡<Quantitative<120g/㎡
- 2.3. Quantitative ≥120g/㎡
Biomass Plastic-free Coated Tableware Segmentation By Geography
-
1. North America
- 1.1. United States
- 1.2. Canada
- 1.3. Mexico
-
2. South America
- 2.1. Brazil
- 2.2. Argentina
- 2.3. Rest of South America
-
3. Europe
- 3.1. United Kingdom
- 3.2. Germany
- 3.3. France
- 3.4. Italy
- 3.5. Spain
- 3.6. Russia
- 3.7. Benelux
- 3.8. Nordics
- 3.9. Rest of Europe
-
4. Middle East & Africa
- 4.1. Turkey
- 4.2. Israel
- 4.3. GCC
- 4.4. North Africa
- 4.5. South Africa
- 4.6. Rest of Middle East & Africa
-
5. Asia Pacific
- 5.1. China
- 5.2. India
- 5.3. Japan
- 5.4. South Korea
- 5.5. ASEAN
- 5.6. Oceania
- 5.7. Rest of Asia Pacific
Biomass Plastic-free Coated Tableware Regional Market Share
Geographic Coverage of Biomass Plastic-free Coated Tableware
Biomass Plastic-free Coated Tableware REPORT HIGHLIGHTS
| Aspects | Details |
|---|---|
| Study Period | 2020-2034 |
| Base Year | 2025 |
| Estimated Year | 2026 |
| Forecast Period | 2026-2034 |
| Historical Period | 2020-2025 |
| Growth Rate | CAGR of 7.6% from 2020-2034 |
| Segmentation |
|
Table of Contents
- 1. Introduction
- 1.1. Research Scope
- 1.2. Market Segmentation
- 1.3. Research Methodology
- 1.4. Definitions and Assumptions
- 2. Executive Summary
- 2.1. Introduction
- 3. Market Dynamics
- 3.1. Introduction
- 3.2. Market Drivers
- 3.3. Market Restrains
- 3.4. Market Trends
- 4. Market Factor Analysis
- 4.1. Porters Five Forces
- 4.2. Supply/Value Chain
- 4.3. PESTEL analysis
- 4.4. Market Entropy
- 4.5. Patent/Trademark Analysis
- 5. Global Biomass Plastic-free Coated Tableware Analysis, Insights and Forecast, 2020-2032
- 5.1. Market Analysis, Insights and Forecast - by Application
- 5.1.1. Baked Goods
- 5.1.2. Paper Tableware
- 5.1.3. Beverage/Dairy
- 5.1.4. Convenience Foods
- 5.1.5. Others
- 5.2. Market Analysis, Insights and Forecast - by Types
- 5.2.1. Quantitative ≤50g/㎡
- 5.2.2. 50g/㎡<Quantitative<120g/㎡
- 5.2.3. Quantitative ≥120g/㎡
- 5.3. Market Analysis, Insights and Forecast - by Region
- 5.3.1. North America
- 5.3.2. South America
- 5.3.3. Europe
- 5.3.4. Middle East & Africa
- 5.3.5. Asia Pacific
- 5.1. Market Analysis, Insights and Forecast - by Application
- 6. North America Biomass Plastic-free Coated Tableware Analysis, Insights and Forecast, 2020-2032
- 6.1. Market Analysis, Insights and Forecast - by Application
- 6.1.1. Baked Goods
- 6.1.2. Paper Tableware
- 6.1.3. Beverage/Dairy
- 6.1.4. Convenience Foods
- 6.1.5. Others
- 6.2. Market Analysis, Insights and Forecast - by Types
- 6.2.1. Quantitative ≤50g/㎡
- 6.2.2. 50g/㎡<Quantitative<120g/㎡
- 6.2.3. Quantitative ≥120g/㎡
- 6.1. Market Analysis, Insights and Forecast - by Application
- 7. South America Biomass Plastic-free Coated Tableware Analysis, Insights and Forecast, 2020-2032
- 7.1. Market Analysis, Insights and Forecast - by Application
- 7.1.1. Baked Goods
- 7.1.2. Paper Tableware
- 7.1.3. Beverage/Dairy
- 7.1.4. Convenience Foods
- 7.1.5. Others
- 7.2. Market Analysis, Insights and Forecast - by Types
- 7.2.1. Quantitative ≤50g/㎡
- 7.2.2. 50g/㎡<Quantitative<120g/㎡
- 7.2.3. Quantitative ≥120g/㎡
- 7.1. Market Analysis, Insights and Forecast - by Application
- 8. Europe Biomass Plastic-free Coated Tableware Analysis, Insights and Forecast, 2020-2032
- 8.1. Market Analysis, Insights and Forecast - by Application
- 8.1.1. Baked Goods
- 8.1.2. Paper Tableware
- 8.1.3. Beverage/Dairy
- 8.1.4. Convenience Foods
- 8.1.5. Others
- 8.2. Market Analysis, Insights and Forecast - by Types
- 8.2.1. Quantitative ≤50g/㎡
- 8.2.2. 50g/㎡<Quantitative<120g/㎡
- 8.2.3. Quantitative ≥120g/㎡
- 8.1. Market Analysis, Insights and Forecast - by Application
- 9. Middle East & Africa Biomass Plastic-free Coated Tableware Analysis, Insights and Forecast, 2020-2032
- 9.1. Market Analysis, Insights and Forecast - by Application
- 9.1.1. Baked Goods
- 9.1.2. Paper Tableware
- 9.1.3. Beverage/Dairy
- 9.1.4. Convenience Foods
- 9.1.5. Others
- 9.2. Market Analysis, Insights and Forecast - by Types
- 9.2.1. Quantitative ≤50g/㎡
- 9.2.2. 50g/㎡<Quantitative<120g/㎡
- 9.2.3. Quantitative ≥120g/㎡
- 9.1. Market Analysis, Insights and Forecast - by Application
- 10. Asia Pacific Biomass Plastic-free Coated Tableware Analysis, Insights and Forecast, 2020-2032
- 10.1. Market Analysis, Insights and Forecast - by Application
- 10.1.1. Baked Goods
- 10.1.2. Paper Tableware
- 10.1.3. Beverage/Dairy
- 10.1.4. Convenience Foods
- 10.1.5. Others
- 10.2. Market Analysis, Insights and Forecast - by Types
- 10.2.1. Quantitative ≤50g/㎡
- 10.2.2. 50g/㎡<Quantitative<120g/㎡
- 10.2.3. Quantitative ≥120g/㎡
- 10.1. Market Analysis, Insights and Forecast - by Application
- 11. Competitive Analysis
- 11.1. Global Market Share Analysis 2025
- 11.2. Company Profiles
- 11.2.1 UPM Specialty Papers
- 11.2.1.1. Overview
- 11.2.1.2. Products
- 11.2.1.3. SWOT Analysis
- 11.2.1.4. Recent Developments
- 11.2.1.5. Financials (Based on Availability)
- 11.2.2 Sappi
- 11.2.2.1. Overview
- 11.2.2.2. Products
- 11.2.2.3. SWOT Analysis
- 11.2.2.4. Recent Developments
- 11.2.2.5. Financials (Based on Availability)
- 11.2.3 Mondi Group
- 11.2.3.1. Overview
- 11.2.3.2. Products
- 11.2.3.3. SWOT Analysis
- 11.2.3.4. Recent Developments
- 11.2.3.5. Financials (Based on Availability)
- 11.2.4 Billerud
- 11.2.4.1. Overview
- 11.2.4.2. Products
- 11.2.4.3. SWOT Analysis
- 11.2.4.4. Recent Developments
- 11.2.4.5. Financials (Based on Availability)
- 11.2.5 Stora Enso
- 11.2.5.1. Overview
- 11.2.5.2. Products
- 11.2.5.3. SWOT Analysis
- 11.2.5.4. Recent Developments
- 11.2.5.5. Financials (Based on Availability)
- 11.2.6 Koehler Paper
- 11.2.6.1. Overview
- 11.2.6.2. Products
- 11.2.6.3. SWOT Analysis
- 11.2.6.4. Recent Developments
- 11.2.6.5. Financials (Based on Availability)
- 11.2.7 Sierra Coating Technologies
- 11.2.7.1. Overview
- 11.2.7.2. Products
- 11.2.7.3. SWOT Analysis
- 11.2.7.4. Recent Developments
- 11.2.7.5. Financials (Based on Availability)
- 11.2.8 Oji Paper
- 11.2.8.1. Overview
- 11.2.8.2. Products
- 11.2.8.3. SWOT Analysis
- 11.2.8.4. Recent Developments
- 11.2.8.5. Financials (Based on Availability)
- 11.2.9 Westrock
- 11.2.9.1. Overview
- 11.2.9.2. Products
- 11.2.9.3. SWOT Analysis
- 11.2.9.4. Recent Developments
- 11.2.9.5. Financials (Based on Availability)
- 11.2.10 Wuzhou Specialty Papers
- 11.2.10.1. Overview
- 11.2.10.2. Products
- 11.2.10.3. SWOT Analysis
- 11.2.10.4. Recent Developments
- 11.2.10.5. Financials (Based on Availability)
- 11.2.11 Sun Paper
- 11.2.11.1. Overview
- 11.2.11.2. Products
- 11.2.11.3. SWOT Analysis
- 11.2.11.4. Recent Developments
- 11.2.11.5. Financials (Based on Availability)
- 11.2.12 Hetrun
- 11.2.12.1. Overview
- 11.2.12.2. Products
- 11.2.12.3. SWOT Analysis
- 11.2.12.4. Recent Developments
- 11.2.12.5. Financials (Based on Availability)
- 11.2.13 Sinar Mas Group
- 11.2.13.1. Overview
- 11.2.13.2. Products
- 11.2.13.3. SWOT Analysis
- 11.2.13.4. Recent Developments
- 11.2.13.5. Financials (Based on Availability)
- 11.2.14 Ruize Arts
- 11.2.14.1. Overview
- 11.2.14.2. Products
- 11.2.14.3. SWOT Analysis
- 11.2.14.4. Recent Developments
- 11.2.14.5. Financials (Based on Availability)
- 11.2.15 Zhejiang Hengda New Materials
- 11.2.15.1. Overview
- 11.2.15.2. Products
- 11.2.15.3. SWOT Analysis
- 11.2.15.4. Recent Developments
- 11.2.15.5. Financials (Based on Availability)
- 11.2.16 Glory Paper
- 11.2.16.1. Overview
- 11.2.16.2. Products
- 11.2.16.3. SWOT Analysis
- 11.2.16.4. Recent Developments
- 11.2.16.5. Financials (Based on Availability)
- 11.2.17 Zhuhai Hongta Renheng Packaging
- 11.2.17.1. Overview
- 11.2.17.2. Products
- 11.2.17.3. SWOT Analysis
- 11.2.17.4. Recent Developments
- 11.2.17.5. Financials (Based on Availability)
- 11.2.18 Rosense
- 11.2.18.1. Overview
- 11.2.18.2. Products
- 11.2.18.3. SWOT Analysis
- 11.2.18.4. Recent Developments
- 11.2.18.5. Financials (Based on Availability)
- 11.2.1 UPM Specialty Papers
List of Figures
- Figure 1: Global Biomass Plastic-free Coated Tableware Revenue Breakdown (undefined, %) by Region 2025 & 2033
- Figure 2: Global Biomass Plastic-free Coated Tableware Volume Breakdown (K, %) by Region 2025 & 2033
- Figure 3: North America Biomass Plastic-free Coated Tableware Revenue (undefined), by Application 2025 & 2033
- Figure 4: North America Biomass Plastic-free Coated Tableware Volume (K), by Application 2025 & 2033
- Figure 5: North America Biomass Plastic-free Coated Tableware Revenue Share (%), by Application 2025 & 2033
- Figure 6: North America Biomass Plastic-free Coated Tableware Volume Share (%), by Application 2025 & 2033
- Figure 7: North America Biomass Plastic-free Coated Tableware Revenue (undefined), by Types 2025 & 2033
- Figure 8: North America Biomass Plastic-free Coated Tableware Volume (K), by Types 2025 & 2033
- Figure 9: North America Biomass Plastic-free Coated Tableware Revenue Share (%), by Types 2025 & 2033
- Figure 10: North America Biomass Plastic-free Coated Tableware Volume Share (%), by Types 2025 & 2033
- Figure 11: North America Biomass Plastic-free Coated Tableware Revenue (undefined), by Country 2025 & 2033
- Figure 12: North America Biomass Plastic-free Coated Tableware Volume (K), by Country 2025 & 2033
- Figure 13: North America Biomass Plastic-free Coated Tableware Revenue Share (%), by Country 2025 & 2033
- Figure 14: North America Biomass Plastic-free Coated Tableware Volume Share (%), by Country 2025 & 2033
- Figure 15: South America Biomass Plastic-free Coated Tableware Revenue (undefined), by Application 2025 & 2033
- Figure 16: South America Biomass Plastic-free Coated Tableware Volume (K), by Application 2025 & 2033
- Figure 17: South America Biomass Plastic-free Coated Tableware Revenue Share (%), by Application 2025 & 2033
- Figure 18: South America Biomass Plastic-free Coated Tableware Volume Share (%), by Application 2025 & 2033
- Figure 19: South America Biomass Plastic-free Coated Tableware Revenue (undefined), by Types 2025 & 2033
- Figure 20: South America Biomass Plastic-free Coated Tableware Volume (K), by Types 2025 & 2033
- Figure 21: South America Biomass Plastic-free Coated Tableware Revenue Share (%), by Types 2025 & 2033
- Figure 22: South America Biomass Plastic-free Coated Tableware Volume Share (%), by Types 2025 & 2033
- Figure 23: South America Biomass Plastic-free Coated Tableware Revenue (undefined), by Country 2025 & 2033
- Figure 24: South America Biomass Plastic-free Coated Tableware Volume (K), by Country 2025 & 2033
- Figure 25: South America Biomass Plastic-free Coated Tableware Revenue Share (%), by Country 2025 & 2033
- Figure 26: South America Biomass Plastic-free Coated Tableware Volume Share (%), by Country 2025 & 2033
- Figure 27: Europe Biomass Plastic-free Coated Tableware Revenue (undefined), by Application 2025 & 2033
- Figure 28: Europe Biomass Plastic-free Coated Tableware Volume (K), by Application 2025 & 2033
- Figure 29: Europe Biomass Plastic-free Coated Tableware Revenue Share (%), by Application 2025 & 2033
- Figure 30: Europe Biomass Plastic-free Coated Tableware Volume Share (%), by Application 2025 & 2033
- Figure 31: Europe Biomass Plastic-free Coated Tableware Revenue (undefined), by Types 2025 & 2033
- Figure 32: Europe Biomass Plastic-free Coated Tableware Volume (K), by Types 2025 & 2033
- Figure 33: Europe Biomass Plastic-free Coated Tableware Revenue Share (%), by Types 2025 & 2033
- Figure 34: Europe Biomass Plastic-free Coated Tableware Volume Share (%), by Types 2025 & 2033
- Figure 35: Europe Biomass Plastic-free Coated Tableware Revenue (undefined), by Country 2025 & 2033
- Figure 36: Europe Biomass Plastic-free Coated Tableware Volume (K), by Country 2025 & 2033
- Figure 37: Europe Biomass Plastic-free Coated Tableware Revenue Share (%), by Country 2025 & 2033
- Figure 38: Europe Biomass Plastic-free Coated Tableware Volume Share (%), by Country 2025 & 2033
- Figure 39: Middle East & Africa Biomass Plastic-free Coated Tableware Revenue (undefined), by Application 2025 & 2033
- Figure 40: Middle East & Africa Biomass Plastic-free Coated Tableware Volume (K), by Application 2025 & 2033
- Figure 41: Middle East & Africa Biomass Plastic-free Coated Tableware Revenue Share (%), by Application 2025 & 2033
- Figure 42: Middle East & Africa Biomass Plastic-free Coated Tableware Volume Share (%), by Application 2025 & 2033
- Figure 43: Middle East & Africa Biomass Plastic-free Coated Tableware Revenue (undefined), by Types 2025 & 2033
- Figure 44: Middle East & Africa Biomass Plastic-free Coated Tableware Volume (K), by Types 2025 & 2033
- Figure 45: Middle East & Africa Biomass Plastic-free Coated Tableware Revenue Share (%), by Types 2025 & 2033
- Figure 46: Middle East & Africa Biomass Plastic-free Coated Tableware Volume Share (%), by Types 2025 & 2033
- Figure 47: Middle East & Africa Biomass Plastic-free Coated Tableware Revenue (undefined), by Country 2025 & 2033
- Figure 48: Middle East & Africa Biomass Plastic-free Coated Tableware Volume (K), by Country 2025 & 2033
- Figure 49: Middle East & Africa Biomass Plastic-free Coated Tableware Revenue Share (%), by Country 2025 & 2033
- Figure 50: Middle East & Africa Biomass Plastic-free Coated Tableware Volume Share (%), by Country 2025 & 2033
- Figure 51: Asia Pacific Biomass Plastic-free Coated Tableware Revenue (undefined), by Application 2025 & 2033
- Figure 52: Asia Pacific Biomass Plastic-free Coated Tableware Volume (K), by Application 2025 & 2033
- Figure 53: Asia Pacific Biomass Plastic-free Coated Tableware Revenue Share (%), by Application 2025 & 2033
- Figure 54: Asia Pacific Biomass Plastic-free Coated Tableware Volume Share (%), by Application 2025 & 2033
- Figure 55: Asia Pacific Biomass Plastic-free Coated Tableware Revenue (undefined), by Types 2025 & 2033
- Figure 56: Asia Pacific Biomass Plastic-free Coated Tableware Volume (K), by Types 2025 & 2033
- Figure 57: Asia Pacific Biomass Plastic-free Coated Tableware Revenue Share (%), by Types 2025 & 2033
- Figure 58: Asia Pacific Biomass Plastic-free Coated Tableware Volume Share (%), by Types 2025 & 2033
- Figure 59: Asia Pacific Biomass Plastic-free Coated Tableware Revenue (undefined), by Country 2025 & 2033
- Figure 60: Asia Pacific Biomass Plastic-free Coated Tableware Volume (K), by Country 2025 & 2033
- Figure 61: Asia Pacific Biomass Plastic-free Coated Tableware Revenue Share (%), by Country 2025 & 2033
- Figure 62: Asia Pacific Biomass Plastic-free Coated Tableware Volume Share (%), by Country 2025 & 2033
List of Tables
- Table 1: Global Biomass Plastic-free Coated Tableware Revenue undefined Forecast, by Application 2020 & 2033
- Table 2: Global Biomass Plastic-free Coated Tableware Volume K Forecast, by Application 2020 & 2033
- Table 3: Global Biomass Plastic-free Coated Tableware Revenue undefined Forecast, by Types 2020 & 2033
- Table 4: Global Biomass Plastic-free Coated Tableware Volume K Forecast, by Types 2020 & 2033
- Table 5: Global Biomass Plastic-free Coated Tableware Revenue undefined Forecast, by Region 2020 & 2033
- Table 6: Global Biomass Plastic-free Coated Tableware Volume K Forecast, by Region 2020 & 2033
- Table 7: Global Biomass Plastic-free Coated Tableware Revenue undefined Forecast, by Application 2020 & 2033
- Table 8: Global Biomass Plastic-free Coated Tableware Volume K Forecast, by Application 2020 & 2033
- Table 9: Global Biomass Plastic-free Coated Tableware Revenue undefined Forecast, by Types 2020 & 2033
- Table 10: Global Biomass Plastic-free Coated Tableware Volume K Forecast, by Types 2020 & 2033
- Table 11: Global Biomass Plastic-free Coated Tableware Revenue undefined Forecast, by Country 2020 & 2033
- Table 12: Global Biomass Plastic-free Coated Tableware Volume K Forecast, by Country 2020 & 2033
- Table 13: United States Biomass Plastic-free Coated Tableware Revenue (undefined) Forecast, by Application 2020 & 2033
- Table 14: United States Biomass Plastic-free Coated Tableware Volume (K) Forecast, by Application 2020 & 2033
- Table 15: Canada Biomass Plastic-free Coated Tableware Revenue (undefined) Forecast, by Application 2020 & 2033
- Table 16: Canada Biomass Plastic-free Coated Tableware Volume (K) Forecast, by Application 2020 & 2033
- Table 17: Mexico Biomass Plastic-free Coated Tableware Revenue (undefined) Forecast, by Application 2020 & 2033
- Table 18: Mexico Biomass Plastic-free Coated Tableware Volume (K) Forecast, by Application 2020 & 2033
- Table 19: Global Biomass Plastic-free Coated Tableware Revenue undefined Forecast, by Application 2020 & 2033
- Table 20: Global Biomass Plastic-free Coated Tableware Volume K Forecast, by Application 2020 & 2033
- Table 21: Global Biomass Plastic-free Coated Tableware Revenue undefined Forecast, by Types 2020 & 2033
- Table 22: Global Biomass Plastic-free Coated Tableware Volume K Forecast, by Types 2020 & 2033
- Table 23: Global Biomass Plastic-free Coated Tableware Revenue undefined Forecast, by Country 2020 & 2033
- Table 24: Global Biomass Plastic-free Coated Tableware Volume K Forecast, by Country 2020 & 2033
- Table 25: Brazil Biomass Plastic-free Coated Tableware Revenue (undefined) Forecast, by Application 2020 & 2033
- Table 26: Brazil Biomass Plastic-free Coated Tableware Volume (K) Forecast, by Application 2020 & 2033
- Table 27: Argentina Biomass Plastic-free Coated Tableware Revenue (undefined) Forecast, by Application 2020 & 2033
- Table 28: Argentina Biomass Plastic-free Coated Tableware Volume (K) Forecast, by Application 2020 & 2033
- Table 29: Rest of South America Biomass Plastic-free Coated Tableware Revenue (undefined) Forecast, by Application 2020 & 2033
- Table 30: Rest of South America Biomass Plastic-free Coated Tableware Volume (K) Forecast, by Application 2020 & 2033
- Table 31: Global Biomass Plastic-free Coated Tableware Revenue undefined Forecast, by Application 2020 & 2033
- Table 32: Global Biomass Plastic-free Coated Tableware Volume K Forecast, by Application 2020 & 2033
- Table 33: Global Biomass Plastic-free Coated Tableware Revenue undefined Forecast, by Types 2020 & 2033
- Table 34: Global Biomass Plastic-free Coated Tableware Volume K Forecast, by Types 2020 & 2033
- Table 35: Global Biomass Plastic-free Coated Tableware Revenue undefined Forecast, by Country 2020 & 2033
- Table 36: Global Biomass Plastic-free Coated Tableware Volume K Forecast, by Country 2020 & 2033
- Table 37: United Kingdom Biomass Plastic-free Coated Tableware Revenue (undefined) Forecast, by Application 2020 & 2033
- Table 38: United Kingdom Biomass Plastic-free Coated Tableware Volume (K) Forecast, by Application 2020 & 2033
- Table 39: Germany Biomass Plastic-free Coated Tableware Revenue (undefined) Forecast, by Application 2020 & 2033
- Table 40: Germany Biomass Plastic-free Coated Tableware Volume (K) Forecast, by Application 2020 & 2033
- Table 41: France Biomass Plastic-free Coated Tableware Revenue (undefined) Forecast, by Application 2020 & 2033
- Table 42: France Biomass Plastic-free Coated Tableware Volume (K) Forecast, by Application 2020 & 2033
- Table 43: Italy Biomass Plastic-free Coated Tableware Revenue (undefined) Forecast, by Application 2020 & 2033
- Table 44: Italy Biomass Plastic-free Coated Tableware Volume (K) Forecast, by Application 2020 & 2033
- Table 45: Spain Biomass Plastic-free Coated Tableware Revenue (undefined) Forecast, by Application 2020 & 2033
- Table 46: Spain Biomass Plastic-free Coated Tableware Volume (K) Forecast, by Application 2020 & 2033
- Table 47: Russia Biomass Plastic-free Coated Tableware Revenue (undefined) Forecast, by Application 2020 & 2033
- Table 48: Russia Biomass Plastic-free Coated Tableware Volume (K) Forecast, by Application 2020 & 2033
- Table 49: Benelux Biomass Plastic-free Coated Tableware Revenue (undefined) Forecast, by Application 2020 & 2033
- Table 50: Benelux Biomass Plastic-free Coated Tableware Volume (K) Forecast, by Application 2020 & 2033
- Table 51: Nordics Biomass Plastic-free Coated Tableware Revenue (undefined) Forecast, by Application 2020 & 2033
- Table 52: Nordics Biomass Plastic-free Coated Tableware Volume (K) Forecast, by Application 2020 & 2033
- Table 53: Rest of Europe Biomass Plastic-free Coated Tableware Revenue (undefined) Forecast, by Application 2020 & 2033
- Table 54: Rest of Europe Biomass Plastic-free Coated Tableware Volume (K) Forecast, by Application 2020 & 2033
- Table 55: Global Biomass Plastic-free Coated Tableware Revenue undefined Forecast, by Application 2020 & 2033
- Table 56: Global Biomass Plastic-free Coated Tableware Volume K Forecast, by Application 2020 & 2033
- Table 57: Global Biomass Plastic-free Coated Tableware Revenue undefined Forecast, by Types 2020 & 2033
- Table 58: Global Biomass Plastic-free Coated Tableware Volume K Forecast, by Types 2020 & 2033
- Table 59: Global Biomass Plastic-free Coated Tableware Revenue undefined Forecast, by Country 2020 & 2033
- Table 60: Global Biomass Plastic-free Coated Tableware Volume K Forecast, by Country 2020 & 2033
- Table 61: Turkey Biomass Plastic-free Coated Tableware Revenue (undefined) Forecast, by Application 2020 & 2033
- Table 62: Turkey Biomass Plastic-free Coated Tableware Volume (K) Forecast, by Application 2020 & 2033
- Table 63: Israel Biomass Plastic-free Coated Tableware Revenue (undefined) Forecast, by Application 2020 & 2033
- Table 64: Israel Biomass Plastic-free Coated Tableware Volume (K) Forecast, by Application 2020 & 2033
- Table 65: GCC Biomass Plastic-free Coated Tableware Revenue (undefined) Forecast, by Application 2020 & 2033
- Table 66: GCC Biomass Plastic-free Coated Tableware Volume (K) Forecast, by Application 2020 & 2033
- Table 67: North Africa Biomass Plastic-free Coated Tableware Revenue (undefined) Forecast, by Application 2020 & 2033
- Table 68: North Africa Biomass Plastic-free Coated Tableware Volume (K) Forecast, by Application 2020 & 2033
- Table 69: South Africa Biomass Plastic-free Coated Tableware Revenue (undefined) Forecast, by Application 2020 & 2033
- Table 70: South Africa Biomass Plastic-free Coated Tableware Volume (K) Forecast, by Application 2020 & 2033
- Table 71: Rest of Middle East & Africa Biomass Plastic-free Coated Tableware Revenue (undefined) Forecast, by Application 2020 & 2033
- Table 72: Rest of Middle East & Africa Biomass Plastic-free Coated Tableware Volume (K) Forecast, by Application 2020 & 2033
- Table 73: Global Biomass Plastic-free Coated Tableware Revenue undefined Forecast, by Application 2020 & 2033
- Table 74: Global Biomass Plastic-free Coated Tableware Volume K Forecast, by Application 2020 & 2033
- Table 75: Global Biomass Plastic-free Coated Tableware Revenue undefined Forecast, by Types 2020 & 2033
- Table 76: Global Biomass Plastic-free Coated Tableware Volume K Forecast, by Types 2020 & 2033
- Table 77: Global Biomass Plastic-free Coated Tableware Revenue undefined Forecast, by Country 2020 & 2033
- Table 78: Global Biomass Plastic-free Coated Tableware Volume K Forecast, by Country 2020 & 2033
- Table 79: China Biomass Plastic-free Coated Tableware Revenue (undefined) Forecast, by Application 2020 & 2033
- Table 80: China Biomass Plastic-free Coated Tableware Volume (K) Forecast, by Application 2020 & 2033
- Table 81: India Biomass Plastic-free Coated Tableware Revenue (undefined) Forecast, by Application 2020 & 2033
- Table 82: India Biomass Plastic-free Coated Tableware Volume (K) Forecast, by Application 2020 & 2033
- Table 83: Japan Biomass Plastic-free Coated Tableware Revenue (undefined) Forecast, by Application 2020 & 2033
- Table 84: Japan Biomass Plastic-free Coated Tableware Volume (K) Forecast, by Application 2020 & 2033
- Table 85: South Korea Biomass Plastic-free Coated Tableware Revenue (undefined) Forecast, by Application 2020 & 2033
- Table 86: South Korea Biomass Plastic-free Coated Tableware Volume (K) Forecast, by Application 2020 & 2033
- Table 87: ASEAN Biomass Plastic-free Coated Tableware Revenue (undefined) Forecast, by Application 2020 & 2033
- Table 88: ASEAN Biomass Plastic-free Coated Tableware Volume (K) Forecast, by Application 2020 & 2033
- Table 89: Oceania Biomass Plastic-free Coated Tableware Revenue (undefined) Forecast, by Application 2020 & 2033
- Table 90: Oceania Biomass Plastic-free Coated Tableware Volume (K) Forecast, by Application 2020 & 2033
- Table 91: Rest of Asia Pacific Biomass Plastic-free Coated Tableware Revenue (undefined) Forecast, by Application 2020 & 2033
- Table 92: Rest of Asia Pacific Biomass Plastic-free Coated Tableware Volume (K) Forecast, by Application 2020 & 2033
Frequently Asked Questions
1. What is the projected Compound Annual Growth Rate (CAGR) of the Biomass Plastic-free Coated Tableware?
The projected CAGR is approximately 7.6%.
2. Which companies are prominent players in the Biomass Plastic-free Coated Tableware?
Key companies in the market include UPM Specialty Papers, Sappi, Mondi Group, Billerud, Stora Enso, Koehler Paper, Sierra Coating Technologies, Oji Paper, Westrock, Wuzhou Specialty Papers, Sun Paper, Hetrun, Sinar Mas Group, Ruize Arts, Zhejiang Hengda New Materials, Glory Paper, Zhuhai Hongta Renheng Packaging, Rosense.
3. What are the main segments of the Biomass Plastic-free Coated Tableware?
The market segments include Application, Types.
4. Can you provide details about the market size?
The market size is estimated to be USD XXX N/A as of 2022.
5. What are some drivers contributing to market growth?
N/A
6. What are the notable trends driving market growth?
N/A
7. Are there any restraints impacting market growth?
N/A
8. Can you provide examples of recent developments in the market?
N/A
9. What pricing options are available for accessing the report?
Pricing options include single-user, multi-user, and enterprise licenses priced at USD 4350.00, USD 6525.00, and USD 8700.00 respectively.
10. Is the market size provided in terms of value or volume?
The market size is provided in terms of value, measured in N/A and volume, measured in K.
11. Are there any specific market keywords associated with the report?
Yes, the market keyword associated with the report is "Biomass Plastic-free Coated Tableware," which aids in identifying and referencing the specific market segment covered.
12. How do I determine which pricing option suits my needs best?
The pricing options vary based on user requirements and access needs. Individual users may opt for single-user licenses, while businesses requiring broader access may choose multi-user or enterprise licenses for cost-effective access to the report.
13. Are there any additional resources or data provided in the Biomass Plastic-free Coated Tableware report?
While the report offers comprehensive insights, it's advisable to review the specific contents or supplementary materials provided to ascertain if additional resources or data are available.
14. How can I stay updated on further developments or reports in the Biomass Plastic-free Coated Tableware?
To stay informed about further developments, trends, and reports in the Biomass Plastic-free Coated Tableware, consider subscribing to industry newsletters, following relevant companies and organizations, or regularly checking reputable industry news sources and publications.
Methodology
Step 1 - Identification of Relevant Samples Size from Population Database


Step 2 - Approaches for Defining Global Market Size (Value, Volume* & Price*)

Note*: In applicable scenarios
Step 3 - Data Sources
Primary Research
- Web Analytics
- Survey Reports
- Research Institute
- Latest Research Reports
- Opinion Leaders
Secondary Research
- Annual Reports
- White Paper
- Latest Press Release
- Industry Association
- Paid Database
- Investor Presentations

Step 4 - Data Triangulation
Involves using different sources of information in order to increase the validity of a study
These sources are likely to be stakeholders in a program - participants, other researchers, program staff, other community members, and so on.
Then we put all data in single framework & apply various statistical tools to find out the dynamic on the market.
During the analysis stage, feedback from the stakeholder groups would be compared to determine areas of agreement as well as areas of divergence