

Key Insights
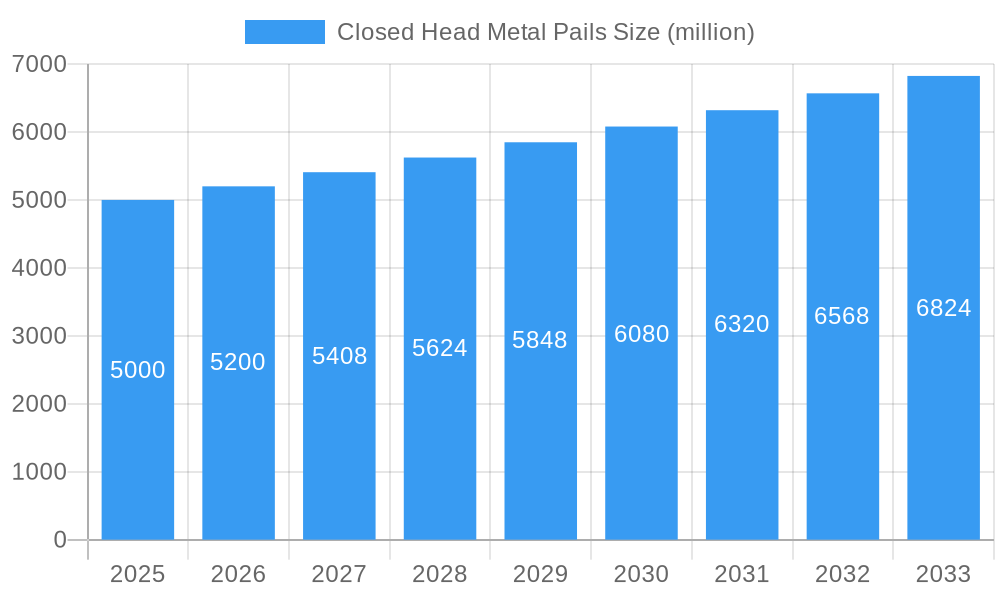
The global market for closed-head metal pails is experiencing steady growth, driven by increasing demand across various industries. The robust nature and cost-effectiveness of metal pails make them a preferred choice for packaging a wide range of products, including chemicals, paints, lubricants, and food items. While plastic alternatives exist, metal pails offer superior protection against damage, leakage, and contamination, especially crucial for hazardous materials. This inherent advantage, coupled with advancements in manufacturing techniques leading to lighter and more sustainable designs, fuels market expansion. We estimate the 2025 market size to be approximately $5 billion, based on industry reports indicating similar growth trajectories for related packaging sectors. A compound annual growth rate (CAGR) of around 4% is projected for the forecast period (2025-2033), primarily due to the continued growth in industrial production and the expanding e-commerce sector requiring efficient and durable packaging solutions.
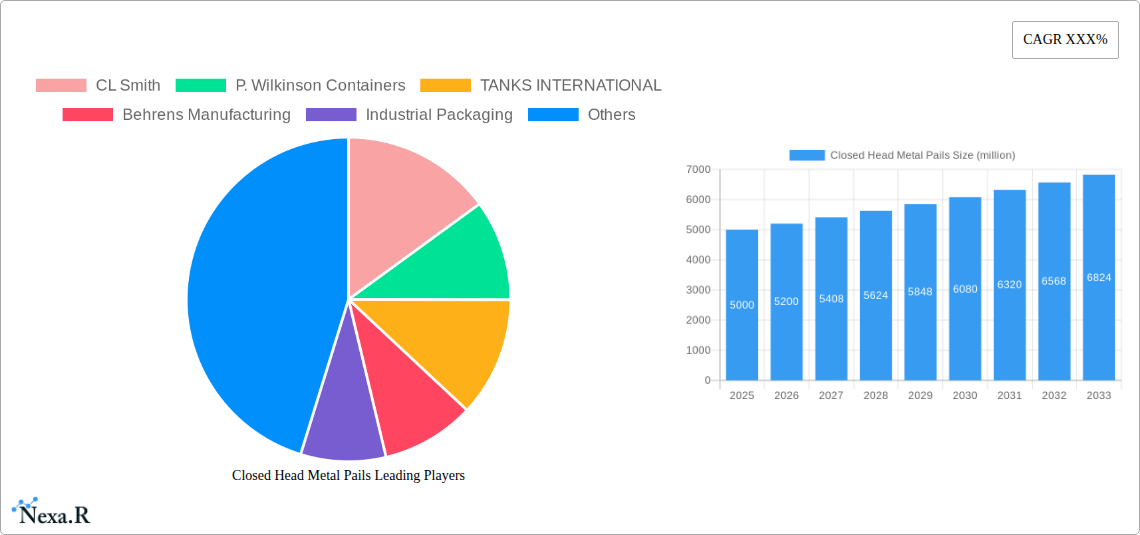
Closed Head Metal Pails Market Size (In Billion)
Major players in the market, including CL Smith, P. Wilkinson Containers, and TANKS INTERNATIONAL, are focusing on innovation, expanding their product lines to cater to diverse customer needs and improving their sustainability credentials. Key trends include the increasing demand for customized pail designs, the adoption of eco-friendly coatings and manufacturing processes, and the growing integration of intelligent packaging solutions for traceability and improved supply chain management. However, fluctuating raw material prices, particularly steel, and the growing competition from alternative packaging materials pose challenges to the market's sustained growth. Regional variations in market growth are expected, with developed economies exhibiting more mature markets, while developing economies offer considerable potential for future expansion due to their burgeoning industrial sectors.
Closed Head Metal Pails Company Market Share
Closed Head Metal Pails Market Report: 2019-2033
This comprehensive report provides an in-depth analysis of the global closed head metal pails market, encompassing historical data (2019-2024), current estimates (2025), and future forecasts (2025-2033). The report caters to industry professionals, investors, and market strategists seeking a detailed understanding of this vital packaging segment within the broader metal packaging industry. It covers market size and growth across various segments, geographic regions, and key player activities, offering actionable insights for informed decision-making. The report's analysis considers million unit values throughout.
Closed Head Metal Pails Market Dynamics & Structure
This section analyzes the competitive landscape, technological advancements, regulatory influences, and market trends within the closed head metal pail industry. We delve into market concentration, examining the market share held by key players such as CL Smith, P. Wilkinson Containers, TANKS INTERNATIONAL, Behrens Manufacturing, Industrial Packaging, ASA Group, Lancaster Container, Aaron Packaging, Cleveland Steel Container, MANUPAK, Yixing Feihong Steel Packaging, Jiangyin YiDing Packaging Materials, GREAT WESTERN CONTAINERS, and Japan Pail. The analysis incorporates data on mergers and acquisitions (M&A) activity within the sector and evaluates the impact of technological innovations on market dynamics.
- Market Concentration: The market is characterized by xx% concentration among the top 5 players in 2025, with a projected xx% increase by 2033.
- Technological Innovation: Key drivers include advancements in coating technologies for enhanced corrosion resistance and improved printing techniques for superior branding. Barriers include high upfront investment costs for new equipment and the need for skilled labor.
- Regulatory Framework: Stringent regulations regarding material safety and recyclability are influencing product design and manufacturing processes.
- Competitive Substitutes: The primary substitutes include plastic pails and flexible intermediate bulk containers (FIBCs), impacting market share.
- End-User Demographics: The primary end-users are the chemical, food and beverage, and industrial sectors, with varying demands influencing product specifications.
- M&A Trends: xx M&A deals were recorded between 2019 and 2024, primarily driven by consolidation and expansion strategies, predicting xx deals in the forecast period.
Closed Head Metal Pails Growth Trends & Insights
This section details the market's growth trajectory, analyzing historical and projected market size, adoption rates across key segments, and the impact of technological disruptions on market evolution. We provide detailed insights into consumer behavior shifts and their influence on product demand. The analysis uses various analytical techniques to offer a comprehensive understanding of market dynamics and future potential.
- Market Size Evolution: The market witnessed a CAGR of xx% from 2019 to 2024, reaching an estimated xx million units in 2025. The forecast period (2025-2033) projects a CAGR of xx%, driven by xx.
- Adoption Rates: Market penetration is highest in the chemical industry, with projected increases in adoption within the food and beverage sector.
- Technological Disruptions: The adoption of sustainable manufacturing practices, including the use of recycled materials, is driving growth.
- Consumer Behavior Shifts: A growing preference for sustainable packaging is influencing demand for recyclable and eco-friendly metal pails.
Dominant Regions, Countries, or Segments in Closed Head Metal Pails
This section identifies the leading regions, countries, and segments driving market growth. We examine the factors contributing to regional dominance, such as economic policies, infrastructure development, and consumer preferences. The analysis also considers market share and growth potential in each region.
- Dominant Region: North America currently holds the largest market share due to established industrial infrastructure and high demand from the chemical sector. However, Asia-Pacific is projected to witness the fastest growth during the forecast period (2025-2033), driven by rapidly expanding industrialization and economic development in countries like China and India.
- Key Drivers: Strong economic growth, favorable government policies promoting industrialization, and increasing consumer spending are significant drivers in the dominant regions. Development of robust supply chains also plays a crucial role.
- Market Share and Growth Potential: North America and Europe collectively hold approximately xx% of the global market share in 2025, while Asia-Pacific is expected to expand its share significantly by 2033, reaching a predicted xx%.
Closed Head Metal Pails Product Landscape
Closed head metal pails are manufactured using various materials, primarily steel and tinplate, with different sizes and shapes based on end-use applications. Recent innovations focus on enhanced durability, improved safety features, and environmentally friendly manufacturing processes. Unique selling propositions include customization options for branding and improved functionality based on application needs. Technological advancements center around improved coating techniques for enhanced corrosion resistance and lighter weight materials to reduce transportation costs.
Key Drivers, Barriers & Challenges in Closed Head Metal Pails
This section outlines the key factors driving market growth and the challenges hindering its expansion. We discuss technological advancements, economic factors, and policy influences shaping market dynamics.
Key Drivers:
- Increasing demand from the chemical and industrial sectors.
- Growing preference for sustainable and recyclable packaging.
- Advancements in coating technologies for enhanced durability.
Challenges and Restraints:
- Fluctuations in raw material prices (steel and tinplate).
- Competition from substitute packaging materials (plastic).
- Stringent environmental regulations affecting manufacturing processes. Compliance costs account for xx% of production costs.
Emerging Opportunities in Closed Head Metal Pails
This section highlights emerging trends and opportunities within the closed head metal pails market. We examine untapped markets, innovative applications, and evolving consumer preferences to identify potential areas for growth.
- Expanding into niche markets like specialty chemicals and pharmaceuticals.
- Developing sustainable and eco-friendly packaging solutions.
- Exploring new applications in food and beverage packaging.
Growth Accelerators in the Closed Head Metal Pails Industry
Technological breakthroughs in coating and manufacturing techniques, strategic partnerships to leverage distribution networks, and market expansion into new geographic regions are key catalysts driving long-term growth in the closed head metal pails industry.
Key Players Shaping the Closed Head Metal Pails Market
- CL Smith
- P. Wilkinson Containers
- TANKS INTERNATIONAL
- Behrens Manufacturing
- Industrial Packaging
- ASA Group
- Lancaster Container
- Aaron Packaging
- Cleveland Steel Container
- MANUPAK
- Yixing Feihong Steel Packaging
- Jiangyin YiDing Packaging Materials
- GREAT WESTERN CONTAINERS
- Japan Pail
Notable Milestones in Closed Head Metal Pails Sector
- 2020: Introduction of a new recyclable coating technology by a major player.
- 2022: Significant M&A activity leading to market consolidation.
- 2023: Launch of a new line of lightweight, high-strength metal pails.
- 2024: Increased investment in sustainable manufacturing practices.
In-Depth Closed Head Metal Pails Market Outlook
The closed head metal pails market is poised for continued growth driven by technological innovation, sustainable packaging trends, and the expanding chemical and industrial sectors. Strategic opportunities lie in developing eco-friendly solutions, penetrating emerging markets, and establishing strong supply chains to mitigate raw material price fluctuations. The predicted CAGR of xx% from 2025-2033 indicates significant potential for market expansion and player diversification.
Closed Head Metal Pails Segmentation
-
1. Application
- 1.1. Chemicals
- 1.2. Agriculture
- 1.3. Food & Beverage
- 1.4. Building & Construction
- 1.5. Automotive
- 1.6. Others
-
2. Type
- 2.1. Less than 1 Gal
- 2.2. 1-3 Gal
- 2.3. 4-6 Gal
- 2.4. 7-10 Gal
- 2.5. Above 10 Gal
Closed Head Metal Pails Segmentation By Geography
-
1. North America
- 1.1. United States
- 1.2. Canada
- 1.3. Mexico
-
2. South America
- 2.1. Brazil
- 2.2. Argentina
- 2.3. Rest of South America
-
3. Europe
- 3.1. United Kingdom
- 3.2. Germany
- 3.3. France
- 3.4. Italy
- 3.5. Spain
- 3.6. Russia
- 3.7. Benelux
- 3.8. Nordics
- 3.9. Rest of Europe
-
4. Middle East & Africa
- 4.1. Turkey
- 4.2. Israel
- 4.3. GCC
- 4.4. North Africa
- 4.5. South Africa
- 4.6. Rest of Middle East & Africa
-
5. Asia Pacific
- 5.1. China
- 5.2. India
- 5.3. Japan
- 5.4. South Korea
- 5.5. ASEAN
- 5.6. Oceania
- 5.7. Rest of Asia Pacific
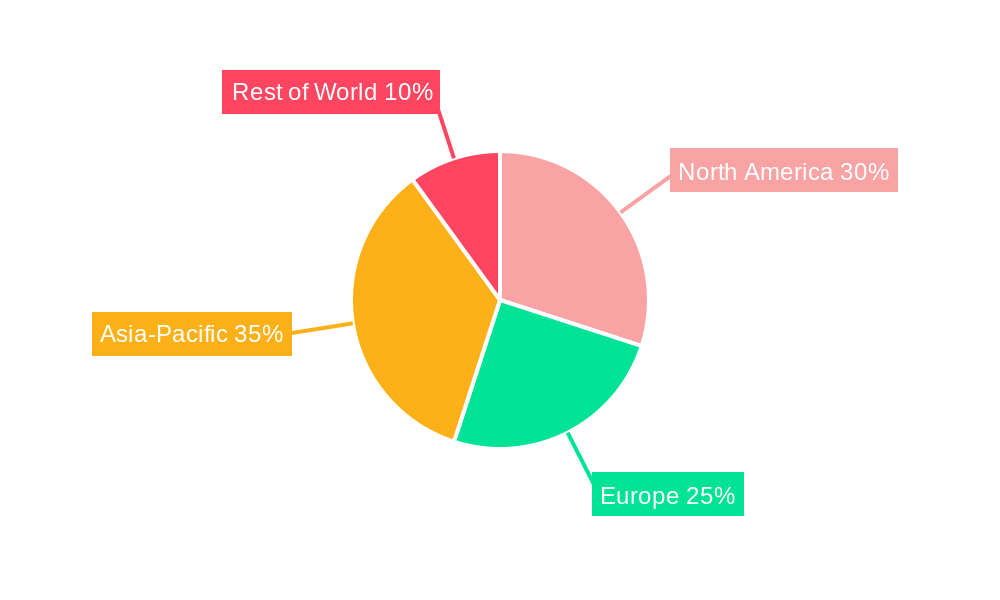
Closed Head Metal Pails Regional Market Share
Geographic Coverage of Closed Head Metal Pails
Closed Head Metal Pails REPORT HIGHLIGHTS
| Aspects | Details |
|---|---|
| Study Period | 2020-2034 |
| Base Year | 2025 |
| Estimated Year | 2026 |
| Forecast Period | 2026-2034 |
| Historical Period | 2020-2025 |
| Growth Rate | CAGR of 5% from 2020-2034 |
| Segmentation |
|
Table of Contents
- 1. Introduction
- 1.1. Research Scope
- 1.2. Market Segmentation
- 1.3. Research Methodology
- 1.4. Definitions and Assumptions
- 2. Executive Summary
- 2.1. Introduction
- 3. Market Dynamics
- 3.1. Introduction
- 3.2. Market Drivers
- 3.3. Market Restrains
- 3.4. Market Trends
- 4. Market Factor Analysis
- 4.1. Porters Five Forces
- 4.2. Supply/Value Chain
- 4.3. PESTEL analysis
- 4.4. Market Entropy
- 4.5. Patent/Trademark Analysis
- 5. Global Closed Head Metal Pails Analysis, Insights and Forecast, 2020-2032
- 5.1. Market Analysis, Insights and Forecast - by Application
- 5.1.1. Chemicals
- 5.1.2. Agriculture
- 5.1.3. Food & Beverage
- 5.1.4. Building & Construction
- 5.1.5. Automotive
- 5.1.6. Others
- 5.2. Market Analysis, Insights and Forecast - by Type
- 5.2.1. Less than 1 Gal
- 5.2.2. 1-3 Gal
- 5.2.3. 4-6 Gal
- 5.2.4. 7-10 Gal
- 5.2.5. Above 10 Gal
- 5.3. Market Analysis, Insights and Forecast - by Region
- 5.3.1. North America
- 5.3.2. South America
- 5.3.3. Europe
- 5.3.4. Middle East & Africa
- 5.3.5. Asia Pacific
- 5.1. Market Analysis, Insights and Forecast - by Application
- 6. North America Closed Head Metal Pails Analysis, Insights and Forecast, 2020-2032
- 6.1. Market Analysis, Insights and Forecast - by Application
- 6.1.1. Chemicals
- 6.1.2. Agriculture
- 6.1.3. Food & Beverage
- 6.1.4. Building & Construction
- 6.1.5. Automotive
- 6.1.6. Others
- 6.2. Market Analysis, Insights and Forecast - by Type
- 6.2.1. Less than 1 Gal
- 6.2.2. 1-3 Gal
- 6.2.3. 4-6 Gal
- 6.2.4. 7-10 Gal
- 6.2.5. Above 10 Gal
- 6.1. Market Analysis, Insights and Forecast - by Application
- 7. South America Closed Head Metal Pails Analysis, Insights and Forecast, 2020-2032
- 7.1. Market Analysis, Insights and Forecast - by Application
- 7.1.1. Chemicals
- 7.1.2. Agriculture
- 7.1.3. Food & Beverage
- 7.1.4. Building & Construction
- 7.1.5. Automotive
- 7.1.6. Others
- 7.2. Market Analysis, Insights and Forecast - by Type
- 7.2.1. Less than 1 Gal
- 7.2.2. 1-3 Gal
- 7.2.3. 4-6 Gal
- 7.2.4. 7-10 Gal
- 7.2.5. Above 10 Gal
- 7.1. Market Analysis, Insights and Forecast - by Application
- 8. Europe Closed Head Metal Pails Analysis, Insights and Forecast, 2020-2032
- 8.1. Market Analysis, Insights and Forecast - by Application
- 8.1.1. Chemicals
- 8.1.2. Agriculture
- 8.1.3. Food & Beverage
- 8.1.4. Building & Construction
- 8.1.5. Automotive
- 8.1.6. Others
- 8.2. Market Analysis, Insights and Forecast - by Type
- 8.2.1. Less than 1 Gal
- 8.2.2. 1-3 Gal
- 8.2.3. 4-6 Gal
- 8.2.4. 7-10 Gal
- 8.2.5. Above 10 Gal
- 8.1. Market Analysis, Insights and Forecast - by Application
- 9. Middle East & Africa Closed Head Metal Pails Analysis, Insights and Forecast, 2020-2032
- 9.1. Market Analysis, Insights and Forecast - by Application
- 9.1.1. Chemicals
- 9.1.2. Agriculture
- 9.1.3. Food & Beverage
- 9.1.4. Building & Construction
- 9.1.5. Automotive
- 9.1.6. Others
- 9.2. Market Analysis, Insights and Forecast - by Type
- 9.2.1. Less than 1 Gal
- 9.2.2. 1-3 Gal
- 9.2.3. 4-6 Gal
- 9.2.4. 7-10 Gal
- 9.2.5. Above 10 Gal
- 9.1. Market Analysis, Insights and Forecast - by Application
- 10. Asia Pacific Closed Head Metal Pails Analysis, Insights and Forecast, 2020-2032
- 10.1. Market Analysis, Insights and Forecast - by Application
- 10.1.1. Chemicals
- 10.1.2. Agriculture
- 10.1.3. Food & Beverage
- 10.1.4. Building & Construction
- 10.1.5. Automotive
- 10.1.6. Others
- 10.2. Market Analysis, Insights and Forecast - by Type
- 10.2.1. Less than 1 Gal
- 10.2.2. 1-3 Gal
- 10.2.3. 4-6 Gal
- 10.2.4. 7-10 Gal
- 10.2.5. Above 10 Gal
- 10.1. Market Analysis, Insights and Forecast - by Application
- 11. Competitive Analysis
- 11.1. Global Market Share Analysis 2025
- 11.2. Company Profiles
- 11.2.1 CL Smith
- 11.2.1.1. Overview
- 11.2.1.2. Products
- 11.2.1.3. SWOT Analysis
- 11.2.1.4. Recent Developments
- 11.2.1.5. Financials (Based on Availability)
- 11.2.2 P. Wilkinson Containers
- 11.2.2.1. Overview
- 11.2.2.2. Products
- 11.2.2.3. SWOT Analysis
- 11.2.2.4. Recent Developments
- 11.2.2.5. Financials (Based on Availability)
- 11.2.3 TANKS INTERNATIONAL
- 11.2.3.1. Overview
- 11.2.3.2. Products
- 11.2.3.3. SWOT Analysis
- 11.2.3.4. Recent Developments
- 11.2.3.5. Financials (Based on Availability)
- 11.2.4 Behrens Manufacturing
- 11.2.4.1. Overview
- 11.2.4.2. Products
- 11.2.4.3. SWOT Analysis
- 11.2.4.4. Recent Developments
- 11.2.4.5. Financials (Based on Availability)
- 11.2.5 Industrial Packaging
- 11.2.5.1. Overview
- 11.2.5.2. Products
- 11.2.5.3. SWOT Analysis
- 11.2.5.4. Recent Developments
- 11.2.5.5. Financials (Based on Availability)
- 11.2.6 ASA Group
- 11.2.6.1. Overview
- 11.2.6.2. Products
- 11.2.6.3. SWOT Analysis
- 11.2.6.4. Recent Developments
- 11.2.6.5. Financials (Based on Availability)
- 11.2.7 Lancaster Container
- 11.2.7.1. Overview
- 11.2.7.2. Products
- 11.2.7.3. SWOT Analysis
- 11.2.7.4. Recent Developments
- 11.2.7.5. Financials (Based on Availability)
- 11.2.8 Aaron Packaging
- 11.2.8.1. Overview
- 11.2.8.2. Products
- 11.2.8.3. SWOT Analysis
- 11.2.8.4. Recent Developments
- 11.2.8.5. Financials (Based on Availability)
- 11.2.9 Cleveland Steel Container
- 11.2.9.1. Overview
- 11.2.9.2. Products
- 11.2.9.3. SWOT Analysis
- 11.2.9.4. Recent Developments
- 11.2.9.5. Financials (Based on Availability)
- 11.2.10 MANUPAK
- 11.2.10.1. Overview
- 11.2.10.2. Products
- 11.2.10.3. SWOT Analysis
- 11.2.10.4. Recent Developments
- 11.2.10.5. Financials (Based on Availability)
- 11.2.11 Yixing Feihong Steel Packaging
- 11.2.11.1. Overview
- 11.2.11.2. Products
- 11.2.11.3. SWOT Analysis
- 11.2.11.4. Recent Developments
- 11.2.11.5. Financials (Based on Availability)
- 11.2.12 Jiangyin YiDing Packaging Materials
- 11.2.12.1. Overview
- 11.2.12.2. Products
- 11.2.12.3. SWOT Analysis
- 11.2.12.4. Recent Developments
- 11.2.12.5. Financials (Based on Availability)
- 11.2.13 GREAT WESTERN CONTAINERS
- 11.2.13.1. Overview
- 11.2.13.2. Products
- 11.2.13.3. SWOT Analysis
- 11.2.13.4. Recent Developments
- 11.2.13.5. Financials (Based on Availability)
- 11.2.14 Japan Pail
- 11.2.14.1. Overview
- 11.2.14.2. Products
- 11.2.14.3. SWOT Analysis
- 11.2.14.4. Recent Developments
- 11.2.14.5. Financials (Based on Availability)
- 11.2.1 CL Smith
List of Figures
- Figure 1: Global Closed Head Metal Pails Revenue Breakdown (undefined, %) by Region 2025 & 2033
- Figure 2: Global Closed Head Metal Pails Volume Breakdown (K, %) by Region 2025 & 2033
- Figure 3: North America Closed Head Metal Pails Revenue (undefined), by Application 2025 & 2033
- Figure 4: North America Closed Head Metal Pails Volume (K), by Application 2025 & 2033
- Figure 5: North America Closed Head Metal Pails Revenue Share (%), by Application 2025 & 2033
- Figure 6: North America Closed Head Metal Pails Volume Share (%), by Application 2025 & 2033
- Figure 7: North America Closed Head Metal Pails Revenue (undefined), by Type 2025 & 2033
- Figure 8: North America Closed Head Metal Pails Volume (K), by Type 2025 & 2033
- Figure 9: North America Closed Head Metal Pails Revenue Share (%), by Type 2025 & 2033
- Figure 10: North America Closed Head Metal Pails Volume Share (%), by Type 2025 & 2033
- Figure 11: North America Closed Head Metal Pails Revenue (undefined), by Country 2025 & 2033
- Figure 12: North America Closed Head Metal Pails Volume (K), by Country 2025 & 2033
- Figure 13: North America Closed Head Metal Pails Revenue Share (%), by Country 2025 & 2033
- Figure 14: North America Closed Head Metal Pails Volume Share (%), by Country 2025 & 2033
- Figure 15: South America Closed Head Metal Pails Revenue (undefined), by Application 2025 & 2033
- Figure 16: South America Closed Head Metal Pails Volume (K), by Application 2025 & 2033
- Figure 17: South America Closed Head Metal Pails Revenue Share (%), by Application 2025 & 2033
- Figure 18: South America Closed Head Metal Pails Volume Share (%), by Application 2025 & 2033
- Figure 19: South America Closed Head Metal Pails Revenue (undefined), by Type 2025 & 2033
- Figure 20: South America Closed Head Metal Pails Volume (K), by Type 2025 & 2033
- Figure 21: South America Closed Head Metal Pails Revenue Share (%), by Type 2025 & 2033
- Figure 22: South America Closed Head Metal Pails Volume Share (%), by Type 2025 & 2033
- Figure 23: South America Closed Head Metal Pails Revenue (undefined), by Country 2025 & 2033
- Figure 24: South America Closed Head Metal Pails Volume (K), by Country 2025 & 2033
- Figure 25: South America Closed Head Metal Pails Revenue Share (%), by Country 2025 & 2033
- Figure 26: South America Closed Head Metal Pails Volume Share (%), by Country 2025 & 2033
- Figure 27: Europe Closed Head Metal Pails Revenue (undefined), by Application 2025 & 2033
- Figure 28: Europe Closed Head Metal Pails Volume (K), by Application 2025 & 2033
- Figure 29: Europe Closed Head Metal Pails Revenue Share (%), by Application 2025 & 2033
- Figure 30: Europe Closed Head Metal Pails Volume Share (%), by Application 2025 & 2033
- Figure 31: Europe Closed Head Metal Pails Revenue (undefined), by Type 2025 & 2033
- Figure 32: Europe Closed Head Metal Pails Volume (K), by Type 2025 & 2033
- Figure 33: Europe Closed Head Metal Pails Revenue Share (%), by Type 2025 & 2033
- Figure 34: Europe Closed Head Metal Pails Volume Share (%), by Type 2025 & 2033
- Figure 35: Europe Closed Head Metal Pails Revenue (undefined), by Country 2025 & 2033
- Figure 36: Europe Closed Head Metal Pails Volume (K), by Country 2025 & 2033
- Figure 37: Europe Closed Head Metal Pails Revenue Share (%), by Country 2025 & 2033
- Figure 38: Europe Closed Head Metal Pails Volume Share (%), by Country 2025 & 2033
- Figure 39: Middle East & Africa Closed Head Metal Pails Revenue (undefined), by Application 2025 & 2033
- Figure 40: Middle East & Africa Closed Head Metal Pails Volume (K), by Application 2025 & 2033
- Figure 41: Middle East & Africa Closed Head Metal Pails Revenue Share (%), by Application 2025 & 2033
- Figure 42: Middle East & Africa Closed Head Metal Pails Volume Share (%), by Application 2025 & 2033
- Figure 43: Middle East & Africa Closed Head Metal Pails Revenue (undefined), by Type 2025 & 2033
- Figure 44: Middle East & Africa Closed Head Metal Pails Volume (K), by Type 2025 & 2033
- Figure 45: Middle East & Africa Closed Head Metal Pails Revenue Share (%), by Type 2025 & 2033
- Figure 46: Middle East & Africa Closed Head Metal Pails Volume Share (%), by Type 2025 & 2033
- Figure 47: Middle East & Africa Closed Head Metal Pails Revenue (undefined), by Country 2025 & 2033
- Figure 48: Middle East & Africa Closed Head Metal Pails Volume (K), by Country 2025 & 2033
- Figure 49: Middle East & Africa Closed Head Metal Pails Revenue Share (%), by Country 2025 & 2033
- Figure 50: Middle East & Africa Closed Head Metal Pails Volume Share (%), by Country 2025 & 2033
- Figure 51: Asia Pacific Closed Head Metal Pails Revenue (undefined), by Application 2025 & 2033
- Figure 52: Asia Pacific Closed Head Metal Pails Volume (K), by Application 2025 & 2033
- Figure 53: Asia Pacific Closed Head Metal Pails Revenue Share (%), by Application 2025 & 2033
- Figure 54: Asia Pacific Closed Head Metal Pails Volume Share (%), by Application 2025 & 2033
- Figure 55: Asia Pacific Closed Head Metal Pails Revenue (undefined), by Type 2025 & 2033
- Figure 56: Asia Pacific Closed Head Metal Pails Volume (K), by Type 2025 & 2033
- Figure 57: Asia Pacific Closed Head Metal Pails Revenue Share (%), by Type 2025 & 2033
- Figure 58: Asia Pacific Closed Head Metal Pails Volume Share (%), by Type 2025 & 2033
- Figure 59: Asia Pacific Closed Head Metal Pails Revenue (undefined), by Country 2025 & 2033
- Figure 60: Asia Pacific Closed Head Metal Pails Volume (K), by Country 2025 & 2033
- Figure 61: Asia Pacific Closed Head Metal Pails Revenue Share (%), by Country 2025 & 2033
- Figure 62: Asia Pacific Closed Head Metal Pails Volume Share (%), by Country 2025 & 2033
List of Tables
- Table 1: Global Closed Head Metal Pails Revenue undefined Forecast, by Application 2020 & 2033
- Table 2: Global Closed Head Metal Pails Volume K Forecast, by Application 2020 & 2033
- Table 3: Global Closed Head Metal Pails Revenue undefined Forecast, by Type 2020 & 2033
- Table 4: Global Closed Head Metal Pails Volume K Forecast, by Type 2020 & 2033
- Table 5: Global Closed Head Metal Pails Revenue undefined Forecast, by Region 2020 & 2033
- Table 6: Global Closed Head Metal Pails Volume K Forecast, by Region 2020 & 2033
- Table 7: Global Closed Head Metal Pails Revenue undefined Forecast, by Application 2020 & 2033
- Table 8: Global Closed Head Metal Pails Volume K Forecast, by Application 2020 & 2033
- Table 9: Global Closed Head Metal Pails Revenue undefined Forecast, by Type 2020 & 2033
- Table 10: Global Closed Head Metal Pails Volume K Forecast, by Type 2020 & 2033
- Table 11: Global Closed Head Metal Pails Revenue undefined Forecast, by Country 2020 & 2033
- Table 12: Global Closed Head Metal Pails Volume K Forecast, by Country 2020 & 2033
- Table 13: United States Closed Head Metal Pails Revenue (undefined) Forecast, by Application 2020 & 2033
- Table 14: United States Closed Head Metal Pails Volume (K) Forecast, by Application 2020 & 2033
- Table 15: Canada Closed Head Metal Pails Revenue (undefined) Forecast, by Application 2020 & 2033
- Table 16: Canada Closed Head Metal Pails Volume (K) Forecast, by Application 2020 & 2033
- Table 17: Mexico Closed Head Metal Pails Revenue (undefined) Forecast, by Application 2020 & 2033
- Table 18: Mexico Closed Head Metal Pails Volume (K) Forecast, by Application 2020 & 2033
- Table 19: Global Closed Head Metal Pails Revenue undefined Forecast, by Application 2020 & 2033
- Table 20: Global Closed Head Metal Pails Volume K Forecast, by Application 2020 & 2033
- Table 21: Global Closed Head Metal Pails Revenue undefined Forecast, by Type 2020 & 2033
- Table 22: Global Closed Head Metal Pails Volume K Forecast, by Type 2020 & 2033
- Table 23: Global Closed Head Metal Pails Revenue undefined Forecast, by Country 2020 & 2033
- Table 24: Global Closed Head Metal Pails Volume K Forecast, by Country 2020 & 2033
- Table 25: Brazil Closed Head Metal Pails Revenue (undefined) Forecast, by Application 2020 & 2033
- Table 26: Brazil Closed Head Metal Pails Volume (K) Forecast, by Application 2020 & 2033
- Table 27: Argentina Closed Head Metal Pails Revenue (undefined) Forecast, by Application 2020 & 2033
- Table 28: Argentina Closed Head Metal Pails Volume (K) Forecast, by Application 2020 & 2033
- Table 29: Rest of South America Closed Head Metal Pails Revenue (undefined) Forecast, by Application 2020 & 2033
- Table 30: Rest of South America Closed Head Metal Pails Volume (K) Forecast, by Application 2020 & 2033
- Table 31: Global Closed Head Metal Pails Revenue undefined Forecast, by Application 2020 & 2033
- Table 32: Global Closed Head Metal Pails Volume K Forecast, by Application 2020 & 2033
- Table 33: Global Closed Head Metal Pails Revenue undefined Forecast, by Type 2020 & 2033
- Table 34: Global Closed Head Metal Pails Volume K Forecast, by Type 2020 & 2033
- Table 35: Global Closed Head Metal Pails Revenue undefined Forecast, by Country 2020 & 2033
- Table 36: Global Closed Head Metal Pails Volume K Forecast, by Country 2020 & 2033
- Table 37: United Kingdom Closed Head Metal Pails Revenue (undefined) Forecast, by Application 2020 & 2033
- Table 38: United Kingdom Closed Head Metal Pails Volume (K) Forecast, by Application 2020 & 2033
- Table 39: Germany Closed Head Metal Pails Revenue (undefined) Forecast, by Application 2020 & 2033
- Table 40: Germany Closed Head Metal Pails Volume (K) Forecast, by Application 2020 & 2033
- Table 41: France Closed Head Metal Pails Revenue (undefined) Forecast, by Application 2020 & 2033
- Table 42: France Closed Head Metal Pails Volume (K) Forecast, by Application 2020 & 2033
- Table 43: Italy Closed Head Metal Pails Revenue (undefined) Forecast, by Application 2020 & 2033
- Table 44: Italy Closed Head Metal Pails Volume (K) Forecast, by Application 2020 & 2033
- Table 45: Spain Closed Head Metal Pails Revenue (undefined) Forecast, by Application 2020 & 2033
- Table 46: Spain Closed Head Metal Pails Volume (K) Forecast, by Application 2020 & 2033
- Table 47: Russia Closed Head Metal Pails Revenue (undefined) Forecast, by Application 2020 & 2033
- Table 48: Russia Closed Head Metal Pails Volume (K) Forecast, by Application 2020 & 2033
- Table 49: Benelux Closed Head Metal Pails Revenue (undefined) Forecast, by Application 2020 & 2033
- Table 50: Benelux Closed Head Metal Pails Volume (K) Forecast, by Application 2020 & 2033
- Table 51: Nordics Closed Head Metal Pails Revenue (undefined) Forecast, by Application 2020 & 2033
- Table 52: Nordics Closed Head Metal Pails Volume (K) Forecast, by Application 2020 & 2033
- Table 53: Rest of Europe Closed Head Metal Pails Revenue (undefined) Forecast, by Application 2020 & 2033
- Table 54: Rest of Europe Closed Head Metal Pails Volume (K) Forecast, by Application 2020 & 2033
- Table 55: Global Closed Head Metal Pails Revenue undefined Forecast, by Application 2020 & 2033
- Table 56: Global Closed Head Metal Pails Volume K Forecast, by Application 2020 & 2033
- Table 57: Global Closed Head Metal Pails Revenue undefined Forecast, by Type 2020 & 2033
- Table 58: Global Closed Head Metal Pails Volume K Forecast, by Type 2020 & 2033
- Table 59: Global Closed Head Metal Pails Revenue undefined Forecast, by Country 2020 & 2033
- Table 60: Global Closed Head Metal Pails Volume K Forecast, by Country 2020 & 2033
- Table 61: Turkey Closed Head Metal Pails Revenue (undefined) Forecast, by Application 2020 & 2033
- Table 62: Turkey Closed Head Metal Pails Volume (K) Forecast, by Application 2020 & 2033
- Table 63: Israel Closed Head Metal Pails Revenue (undefined) Forecast, by Application 2020 & 2033
- Table 64: Israel Closed Head Metal Pails Volume (K) Forecast, by Application 2020 & 2033
- Table 65: GCC Closed Head Metal Pails Revenue (undefined) Forecast, by Application 2020 & 2033
- Table 66: GCC Closed Head Metal Pails Volume (K) Forecast, by Application 2020 & 2033
- Table 67: North Africa Closed Head Metal Pails Revenue (undefined) Forecast, by Application 2020 & 2033
- Table 68: North Africa Closed Head Metal Pails Volume (K) Forecast, by Application 2020 & 2033
- Table 69: South Africa Closed Head Metal Pails Revenue (undefined) Forecast, by Application 2020 & 2033
- Table 70: South Africa Closed Head Metal Pails Volume (K) Forecast, by Application 2020 & 2033
- Table 71: Rest of Middle East & Africa Closed Head Metal Pails Revenue (undefined) Forecast, by Application 2020 & 2033
- Table 72: Rest of Middle East & Africa Closed Head Metal Pails Volume (K) Forecast, by Application 2020 & 2033
- Table 73: Global Closed Head Metal Pails Revenue undefined Forecast, by Application 2020 & 2033
- Table 74: Global Closed Head Metal Pails Volume K Forecast, by Application 2020 & 2033
- Table 75: Global Closed Head Metal Pails Revenue undefined Forecast, by Type 2020 & 2033
- Table 76: Global Closed Head Metal Pails Volume K Forecast, by Type 2020 & 2033
- Table 77: Global Closed Head Metal Pails Revenue undefined Forecast, by Country 2020 & 2033
- Table 78: Global Closed Head Metal Pails Volume K Forecast, by Country 2020 & 2033
- Table 79: China Closed Head Metal Pails Revenue (undefined) Forecast, by Application 2020 & 2033
- Table 80: China Closed Head Metal Pails Volume (K) Forecast, by Application 2020 & 2033
- Table 81: India Closed Head Metal Pails Revenue (undefined) Forecast, by Application 2020 & 2033
- Table 82: India Closed Head Metal Pails Volume (K) Forecast, by Application 2020 & 2033
- Table 83: Japan Closed Head Metal Pails Revenue (undefined) Forecast, by Application 2020 & 2033
- Table 84: Japan Closed Head Metal Pails Volume (K) Forecast, by Application 2020 & 2033
- Table 85: South Korea Closed Head Metal Pails Revenue (undefined) Forecast, by Application 2020 & 2033
- Table 86: South Korea Closed Head Metal Pails Volume (K) Forecast, by Application 2020 & 2033
- Table 87: ASEAN Closed Head Metal Pails Revenue (undefined) Forecast, by Application 2020 & 2033
- Table 88: ASEAN Closed Head Metal Pails Volume (K) Forecast, by Application 2020 & 2033
- Table 89: Oceania Closed Head Metal Pails Revenue (undefined) Forecast, by Application 2020 & 2033
- Table 90: Oceania Closed Head Metal Pails Volume (K) Forecast, by Application 2020 & 2033
- Table 91: Rest of Asia Pacific Closed Head Metal Pails Revenue (undefined) Forecast, by Application 2020 & 2033
- Table 92: Rest of Asia Pacific Closed Head Metal Pails Volume (K) Forecast, by Application 2020 & 2033
Frequently Asked Questions
1. What is the projected Compound Annual Growth Rate (CAGR) of the Closed Head Metal Pails?
The projected CAGR is approximately 5%.
2. Which companies are prominent players in the Closed Head Metal Pails?
Key companies in the market include CL Smith, P. Wilkinson Containers, TANKS INTERNATIONAL, Behrens Manufacturing, Industrial Packaging, ASA Group, Lancaster Container, Aaron Packaging, Cleveland Steel Container, MANUPAK, Yixing Feihong Steel Packaging, Jiangyin YiDing Packaging Materials, GREAT WESTERN CONTAINERS, Japan Pail.
3. What are the main segments of the Closed Head Metal Pails?
The market segments include Application, Type.
4. Can you provide details about the market size?
The market size is estimated to be USD XXX N/A as of 2022.
5. What are some drivers contributing to market growth?
N/A
6. What are the notable trends driving market growth?
N/A
7. Are there any restraints impacting market growth?
N/A
8. Can you provide examples of recent developments in the market?
N/A
9. What pricing options are available for accessing the report?
Pricing options include single-user, multi-user, and enterprise licenses priced at USD 3950.00, USD 5925.00, and USD 7900.00 respectively.
10. Is the market size provided in terms of value or volume?
The market size is provided in terms of value, measured in N/A and volume, measured in K.
11. Are there any specific market keywords associated with the report?
Yes, the market keyword associated with the report is "Closed Head Metal Pails," which aids in identifying and referencing the specific market segment covered.
12. How do I determine which pricing option suits my needs best?
The pricing options vary based on user requirements and access needs. Individual users may opt for single-user licenses, while businesses requiring broader access may choose multi-user or enterprise licenses for cost-effective access to the report.
13. Are there any additional resources or data provided in the Closed Head Metal Pails report?
While the report offers comprehensive insights, it's advisable to review the specific contents or supplementary materials provided to ascertain if additional resources or data are available.
14. How can I stay updated on further developments or reports in the Closed Head Metal Pails?
To stay informed about further developments, trends, and reports in the Closed Head Metal Pails, consider subscribing to industry newsletters, following relevant companies and organizations, or regularly checking reputable industry news sources and publications.
Methodology
Step 1 - Identification of Relevant Samples Size from Population Database


Step 2 - Approaches for Defining Global Market Size (Value, Volume* & Price*)

Note*: In applicable scenarios
Step 3 - Data Sources
Primary Research
- Web Analytics
- Survey Reports
- Research Institute
- Latest Research Reports
- Opinion Leaders
Secondary Research
- Annual Reports
- White Paper
- Latest Press Release
- Industry Association
- Paid Database
- Investor Presentations

Step 4 - Data Triangulation
Involves using different sources of information in order to increase the validity of a study
These sources are likely to be stakeholders in a program - participants, other researchers, program staff, other community members, and so on.
Then we put all data in single framework & apply various statistical tools to find out the dynamic on the market.
During the analysis stage, feedback from the stakeholder groups would be compared to determine areas of agreement as well as areas of divergence