

Key Insights
The global market for wine closures is experiencing robust growth, driven by several key factors. The increasing popularity of wine, particularly in emerging economies, fuels demand for effective and aesthetically pleasing closures. Furthermore, a rising preference for premium wines, often sealed with higher-quality closures like screw caps and synthetic corks, contributes significantly to market expansion. The shift away from traditional natural cork, due to concerns regarding TCA (trichloroanisole) contamination and inconsistent quality, has also propelled the adoption of alternative closure types. This trend is further strengthened by advancements in closure technology, leading to improved oxygen management and enhanced wine preservation. While some challenges exist, such as fluctuations in raw material costs and competition from established players, the overall market outlook remains positive. We estimate the market size in 2025 to be $5 billion, with a Compound Annual Growth Rate (CAGR) of 4.5% projected from 2025-2033. This growth is expected to be driven by increasing wine consumption globally, as well as the rise of sustainability concerns pushing the adoption of more eco-friendly alternatives.
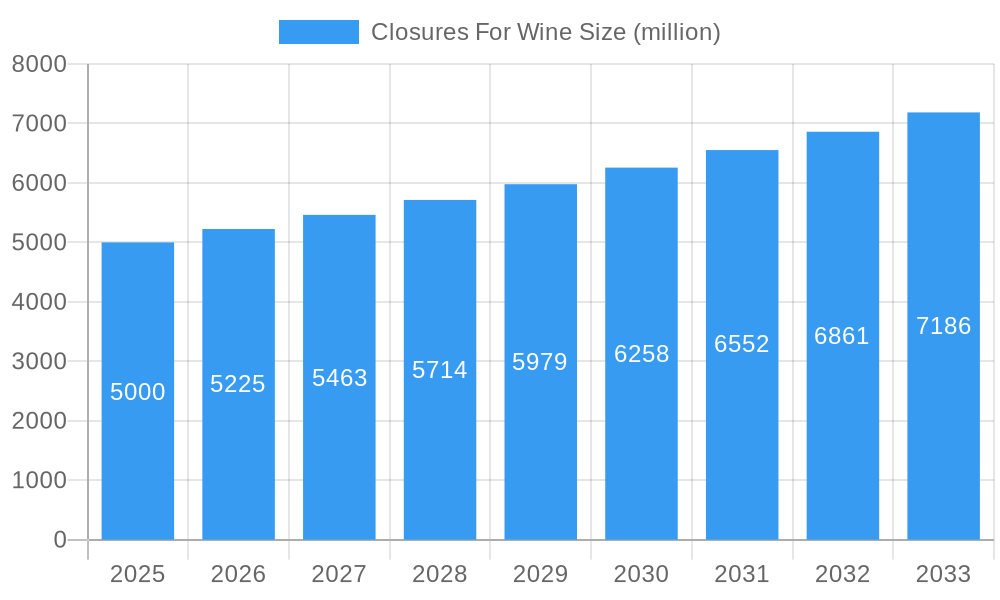
Closures For Wine Market Size (In Billion)
Market segmentation reveals a diverse landscape, with screw caps holding a significant market share due to their cost-effectiveness, ease of use, and consistent performance. Synthetic corks are also gaining traction, offering a viable alternative to natural cork while addressing the issue of TCA contamination. The geographical distribution of the market is spread across various regions, with North America and Europe currently leading in terms of consumption. However, robust growth is expected from emerging markets in Asia and Latin America driven by increasing disposable incomes and changing consumer preferences. Major players like Amorim, MASilva, and Cork Supply are constantly innovating and expanding their product portfolios, further fueling competition and market dynamism. This competitive landscape encourages investment in research and development, leading to improved closure materials and designs, ultimately benefiting the wine industry and consumers alike.
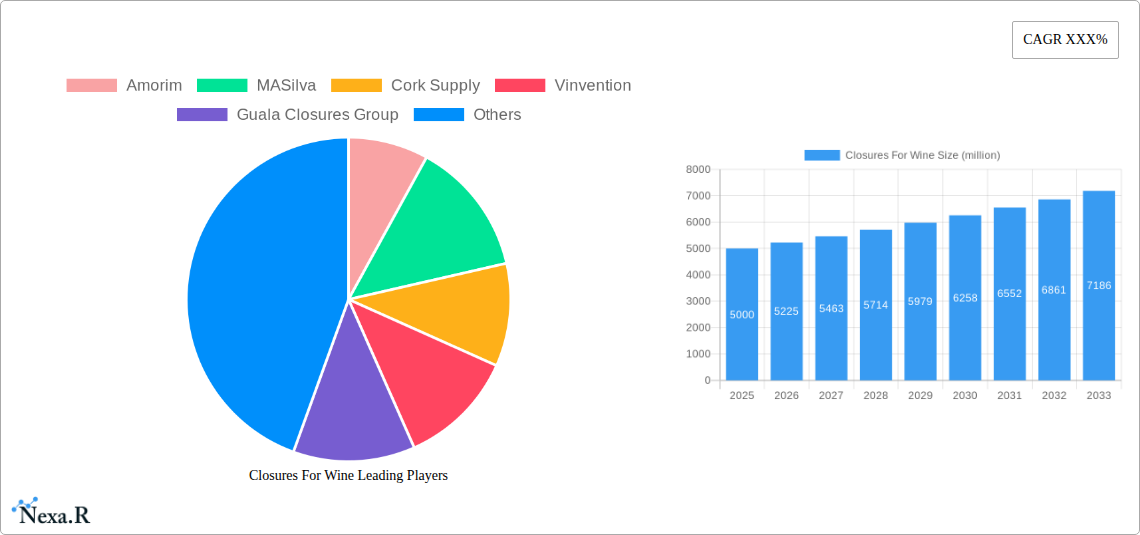
Closures For Wine Company Market Share
Closures For Wine Market Report: 2019-2033
This comprehensive report provides an in-depth analysis of the global closures for wine market, offering invaluable insights for industry professionals, investors, and strategic decision-makers. Covering the period from 2019 to 2033, with a focus on 2025, this report meticulously examines market dynamics, growth trends, key players, and emerging opportunities within the parent market of wine packaging and the child market of wine bottle closures. The report leverages extensive primary and secondary research, including data from various sources. Projected market values are in million units.
Closures For Wine Market Dynamics & Structure
The global closures for wine market is characterized by a moderately concentrated structure, with key players like Amorim, MASilva, Cork Supply, Vinvention, Guala Closures Group, Labrenta, DIAM, Precision Elite, Waterloo Container Company, and AMCOR holding significant market share. The market is driven by technological innovations, particularly in sustainable and high-performance closures, but faces regulatory hurdles concerning material sourcing and environmental impact. The market also experiences competitive pressure from substitute products like screw caps and synthetic closures. M&A activity has been moderate in recent years, with xx deals recorded between 2019 and 2024, contributing to market consolidation.
- Market Concentration: Amorim and MASilva collectively hold an estimated xx% market share in 2025.
- Technological Innovation: Focus on lightweighting, sustainability (cork, recycled materials), and improved oxygen management.
- Regulatory Framework: Growing emphasis on sustainable sourcing and reduced environmental impact is shaping industry practices.
- Competitive Substitutes: Screw caps and synthetic closures present competition, particularly in price-sensitive segments.
- End-User Demographics: The market is driven by the preferences of wineries, focusing on quality, preservation, and brand image.
- M&A Trends: Consolidation is expected to continue, driven by economies of scale and expansion into new markets.
Closures For Wine Growth Trends & Insights
The global closures for wine market experienced a compound annual growth rate (CAGR) of xx% during the historical period (2019-2024), reaching a market size of xx million units in 2024. Driven by increasing wine consumption, particularly in emerging markets, the market is projected to grow at a CAGR of xx% from 2025 to 2033, reaching xx million units by 2033. This growth is fueled by rising consumer demand for premium wines, requiring high-quality closures, and the increasing adoption of sustainable and innovative closure technologies. Market penetration of premium closures is expected to increase from xx% in 2025 to xx% by 2033. Technological disruptions, such as the development of smart closures and improved sealing technologies, are further boosting market expansion. Consumer preferences are shifting towards natural and eco-friendly closures.
Dominant Regions, Countries, or Segments in Closures For Wine
The European Union remains the dominant region for closures for wine, accounting for xx% of global market share in 2025. This dominance stems from the region's significant wine production, strong consumer base, and well-established wine culture. Other key regions include North America and Asia-Pacific, which are experiencing robust growth due to factors like rising disposable incomes and evolving consumption patterns. Within the EU, countries like France, Italy, and Spain are significant markets. The premium segment within the closures for wine market is showing the strongest growth.
- Key Drivers in the EU: Established wine industry, high wine consumption, sophisticated consumer preferences, and stringent quality standards.
- Growth Potential in Asia-Pacific: Rising disposable incomes, growing middle class, and increased preference for imported wines.
- North American Market Dynamics: Significant wine consumption, particularly in the US, and demand for diverse closure types.
Closures For Wine Product Landscape
The closures for wine market offers a diverse range of products, including natural cork, synthetic cork, screw caps, and other innovative materials. These closures cater to various wine types and price points, offering different levels of oxygen management and preservation. Technological advancements focus on improving seal integrity, preventing cork taint, and enhancing sustainability. Unique selling propositions include features like improved gas exchange, reduced TCA risk, and recyclability.
Key Drivers, Barriers & Challenges in Closures For Wine
Key Drivers: Rising wine consumption globally, increasing demand for premium wines, advancements in closure technology, and growing focus on sustainability. Government regulations promoting sustainable packaging are also a driving force.
Key Challenges: Fluctuations in raw material prices (e.g., cork), stringent environmental regulations, intense competition from substitute products, and maintaining supply chain stability. The potential impact of climate change on cork production poses a significant long-term challenge. Estimated annual losses due to supply chain disruptions between 2019 and 2024 is xx million units.
Emerging Opportunities in Closures For Wine
Untapped markets in emerging economies present significant growth opportunities. The increasing demand for sustainable and eco-friendly packaging solutions, as well as innovative closures with advanced functionalities like tamper evidence and integrated sensors, create new avenues for market expansion. Further, personalized closures, catering to individual winery brands and consumer preferences, represents an exciting opportunity.
Growth Accelerators in the Closures For Wine Industry
Technological advancements, including the development of high-performance materials and smart closures, will continue to drive market growth. Strategic partnerships between closure manufacturers and wineries will foster innovation and market penetration. Expansion into new markets, particularly in emerging economies, will play a vital role in accelerating long-term growth.
Key Players Shaping the Closures For Wine Market
- Amorim
- MASilva
- Cork Supply
- Vinvention
- Guala Closures Group
- Labrenta
- DIAM
- Precision Elite
- Waterloo Container Company
- AMCOR
Notable Milestones in Closures For Wine Sector
- 2020: Introduction of a new bio-based cork closure by Amorim.
- 2021: MASilva launches a sustainable screw cap option.
- 2022: Guala Closures Group acquires a smaller closure manufacturer, expanding its market presence.
- 2023: Significant investment in R&D in sustainable materials for wine closures.
- 2024: Industry-wide adoption of new quality standards for wine closures.
In-Depth Closures For Wine Market Outlook
The closures for wine market is poised for sustained growth over the forecast period, driven by a confluence of factors including rising wine consumption, technological innovation, and a heightened focus on sustainability. Strategic investments in R&D, expansion into new markets, and strategic partnerships will be crucial in shaping the future of this dynamic market. The market's long-term potential is significant, with opportunities for both established players and new entrants.
Closures For Wine Segmentation
-
1. Application
- 1.1. Still Wine
- 1.2. Sparkling Wine
-
2. Type
- 2.1. Cork
- 2.2. Screwcap
- 2.3. Plastic
Closures For Wine Segmentation By Geography
-
1. North America
- 1.1. United States
- 1.2. Canada
- 1.3. Mexico
-
2. South America
- 2.1. Brazil
- 2.2. Argentina
- 2.3. Rest of South America
-
3. Europe
- 3.1. United Kingdom
- 3.2. Germany
- 3.3. France
- 3.4. Italy
- 3.5. Spain
- 3.6. Russia
- 3.7. Benelux
- 3.8. Nordics
- 3.9. Rest of Europe
-
4. Middle East & Africa
- 4.1. Turkey
- 4.2. Israel
- 4.3. GCC
- 4.4. North Africa
- 4.5. South Africa
- 4.6. Rest of Middle East & Africa
-
5. Asia Pacific
- 5.1. China
- 5.2. India
- 5.3. Japan
- 5.4. South Korea
- 5.5. ASEAN
- 5.6. Oceania
- 5.7. Rest of Asia Pacific
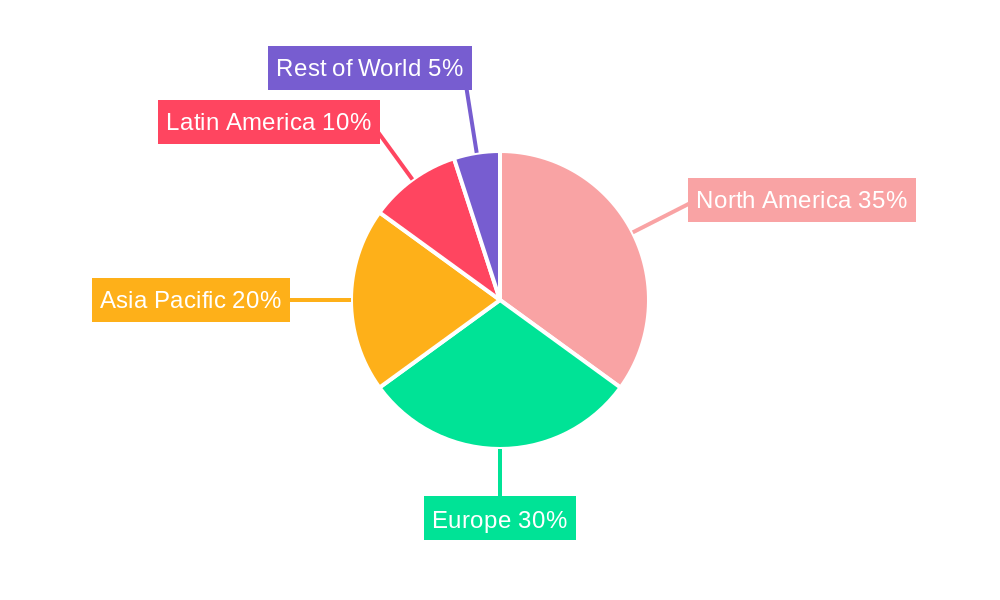
Closures For Wine Regional Market Share
Geographic Coverage of Closures For Wine
Closures For Wine REPORT HIGHLIGHTS
| Aspects | Details |
|---|---|
| Study Period | 2020-2034 |
| Base Year | 2025 |
| Estimated Year | 2026 |
| Forecast Period | 2026-2034 |
| Historical Period | 2020-2025 |
| Growth Rate | CAGR of XXX% from 2020-2034 |
| Segmentation |
|
Table of Contents
- 1. Introduction
- 1.1. Research Scope
- 1.2. Market Segmentation
- 1.3. Research Methodology
- 1.4. Definitions and Assumptions
- 2. Executive Summary
- 2.1. Introduction
- 3. Market Dynamics
- 3.1. Introduction
- 3.2. Market Drivers
- 3.3. Market Restrains
- 3.4. Market Trends
- 4. Market Factor Analysis
- 4.1. Porters Five Forces
- 4.2. Supply/Value Chain
- 4.3. PESTEL analysis
- 4.4. Market Entropy
- 4.5. Patent/Trademark Analysis
- 5. Global Closures For Wine Analysis, Insights and Forecast, 2020-2032
- 5.1. Market Analysis, Insights and Forecast - by Application
- 5.1.1. Still Wine
- 5.1.2. Sparkling Wine
- 5.2. Market Analysis, Insights and Forecast - by Type
- 5.2.1. Cork
- 5.2.2. Screwcap
- 5.2.3. Plastic
- 5.3. Market Analysis, Insights and Forecast - by Region
- 5.3.1. North America
- 5.3.2. South America
- 5.3.3. Europe
- 5.3.4. Middle East & Africa
- 5.3.5. Asia Pacific
- 5.1. Market Analysis, Insights and Forecast - by Application
- 6. North America Closures For Wine Analysis, Insights and Forecast, 2020-2032
- 6.1. Market Analysis, Insights and Forecast - by Application
- 6.1.1. Still Wine
- 6.1.2. Sparkling Wine
- 6.2. Market Analysis, Insights and Forecast - by Type
- 6.2.1. Cork
- 6.2.2. Screwcap
- 6.2.3. Plastic
- 6.1. Market Analysis, Insights and Forecast - by Application
- 7. South America Closures For Wine Analysis, Insights and Forecast, 2020-2032
- 7.1. Market Analysis, Insights and Forecast - by Application
- 7.1.1. Still Wine
- 7.1.2. Sparkling Wine
- 7.2. Market Analysis, Insights and Forecast - by Type
- 7.2.1. Cork
- 7.2.2. Screwcap
- 7.2.3. Plastic
- 7.1. Market Analysis, Insights and Forecast - by Application
- 8. Europe Closures For Wine Analysis, Insights and Forecast, 2020-2032
- 8.1. Market Analysis, Insights and Forecast - by Application
- 8.1.1. Still Wine
- 8.1.2. Sparkling Wine
- 8.2. Market Analysis, Insights and Forecast - by Type
- 8.2.1. Cork
- 8.2.2. Screwcap
- 8.2.3. Plastic
- 8.1. Market Analysis, Insights and Forecast - by Application
- 9. Middle East & Africa Closures For Wine Analysis, Insights and Forecast, 2020-2032
- 9.1. Market Analysis, Insights and Forecast - by Application
- 9.1.1. Still Wine
- 9.1.2. Sparkling Wine
- 9.2. Market Analysis, Insights and Forecast - by Type
- 9.2.1. Cork
- 9.2.2. Screwcap
- 9.2.3. Plastic
- 9.1. Market Analysis, Insights and Forecast - by Application
- 10. Asia Pacific Closures For Wine Analysis, Insights and Forecast, 2020-2032
- 10.1. Market Analysis, Insights and Forecast - by Application
- 10.1.1. Still Wine
- 10.1.2. Sparkling Wine
- 10.2. Market Analysis, Insights and Forecast - by Type
- 10.2.1. Cork
- 10.2.2. Screwcap
- 10.2.3. Plastic
- 10.1. Market Analysis, Insights and Forecast - by Application
- 11. Competitive Analysis
- 11.1. Global Market Share Analysis 2025
- 11.2. Company Profiles
- 11.2.1 Amorim
- 11.2.1.1. Overview
- 11.2.1.2. Products
- 11.2.1.3. SWOT Analysis
- 11.2.1.4. Recent Developments
- 11.2.1.5. Financials (Based on Availability)
- 11.2.2 MASilva
- 11.2.2.1. Overview
- 11.2.2.2. Products
- 11.2.2.3. SWOT Analysis
- 11.2.2.4. Recent Developments
- 11.2.2.5. Financials (Based on Availability)
- 11.2.3 Cork Supply
- 11.2.3.1. Overview
- 11.2.3.2. Products
- 11.2.3.3. SWOT Analysis
- 11.2.3.4. Recent Developments
- 11.2.3.5. Financials (Based on Availability)
- 11.2.4 Vinvention
- 11.2.4.1. Overview
- 11.2.4.2. Products
- 11.2.4.3. SWOT Analysis
- 11.2.4.4. Recent Developments
- 11.2.4.5. Financials (Based on Availability)
- 11.2.5 Guala Closures Group
- 11.2.5.1. Overview
- 11.2.5.2. Products
- 11.2.5.3. SWOT Analysis
- 11.2.5.4. Recent Developments
- 11.2.5.5. Financials (Based on Availability)
- 11.2.6 Labrenta
- 11.2.6.1. Overview
- 11.2.6.2. Products
- 11.2.6.3. SWOT Analysis
- 11.2.6.4. Recent Developments
- 11.2.6.5. Financials (Based on Availability)
- 11.2.7 DIAM
- 11.2.7.1. Overview
- 11.2.7.2. Products
- 11.2.7.3. SWOT Analysis
- 11.2.7.4. Recent Developments
- 11.2.7.5. Financials (Based on Availability)
- 11.2.8 Precision Elite
- 11.2.8.1. Overview
- 11.2.8.2. Products
- 11.2.8.3. SWOT Analysis
- 11.2.8.4. Recent Developments
- 11.2.8.5. Financials (Based on Availability)
- 11.2.9 Waterloo Container Company
- 11.2.9.1. Overview
- 11.2.9.2. Products
- 11.2.9.3. SWOT Analysis
- 11.2.9.4. Recent Developments
- 11.2.9.5. Financials (Based on Availability)
- 11.2.10 AMCOR
- 11.2.10.1. Overview
- 11.2.10.2. Products
- 11.2.10.3. SWOT Analysis
- 11.2.10.4. Recent Developments
- 11.2.10.5. Financials (Based on Availability)
- 11.2.1 Amorim
List of Figures
- Figure 1: Global Closures For Wine Revenue Breakdown (million, %) by Region 2025 & 2033
- Figure 2: Global Closures For Wine Volume Breakdown (K, %) by Region 2025 & 2033
- Figure 3: North America Closures For Wine Revenue (million), by Application 2025 & 2033
- Figure 4: North America Closures For Wine Volume (K), by Application 2025 & 2033
- Figure 5: North America Closures For Wine Revenue Share (%), by Application 2025 & 2033
- Figure 6: North America Closures For Wine Volume Share (%), by Application 2025 & 2033
- Figure 7: North America Closures For Wine Revenue (million), by Type 2025 & 2033
- Figure 8: North America Closures For Wine Volume (K), by Type 2025 & 2033
- Figure 9: North America Closures For Wine Revenue Share (%), by Type 2025 & 2033
- Figure 10: North America Closures For Wine Volume Share (%), by Type 2025 & 2033
- Figure 11: North America Closures For Wine Revenue (million), by Country 2025 & 2033
- Figure 12: North America Closures For Wine Volume (K), by Country 2025 & 2033
- Figure 13: North America Closures For Wine Revenue Share (%), by Country 2025 & 2033
- Figure 14: North America Closures For Wine Volume Share (%), by Country 2025 & 2033
- Figure 15: South America Closures For Wine Revenue (million), by Application 2025 & 2033
- Figure 16: South America Closures For Wine Volume (K), by Application 2025 & 2033
- Figure 17: South America Closures For Wine Revenue Share (%), by Application 2025 & 2033
- Figure 18: South America Closures For Wine Volume Share (%), by Application 2025 & 2033
- Figure 19: South America Closures For Wine Revenue (million), by Type 2025 & 2033
- Figure 20: South America Closures For Wine Volume (K), by Type 2025 & 2033
- Figure 21: South America Closures For Wine Revenue Share (%), by Type 2025 & 2033
- Figure 22: South America Closures For Wine Volume Share (%), by Type 2025 & 2033
- Figure 23: South America Closures For Wine Revenue (million), by Country 2025 & 2033
- Figure 24: South America Closures For Wine Volume (K), by Country 2025 & 2033
- Figure 25: South America Closures For Wine Revenue Share (%), by Country 2025 & 2033
- Figure 26: South America Closures For Wine Volume Share (%), by Country 2025 & 2033
- Figure 27: Europe Closures For Wine Revenue (million), by Application 2025 & 2033
- Figure 28: Europe Closures For Wine Volume (K), by Application 2025 & 2033
- Figure 29: Europe Closures For Wine Revenue Share (%), by Application 2025 & 2033
- Figure 30: Europe Closures For Wine Volume Share (%), by Application 2025 & 2033
- Figure 31: Europe Closures For Wine Revenue (million), by Type 2025 & 2033
- Figure 32: Europe Closures For Wine Volume (K), by Type 2025 & 2033
- Figure 33: Europe Closures For Wine Revenue Share (%), by Type 2025 & 2033
- Figure 34: Europe Closures For Wine Volume Share (%), by Type 2025 & 2033
- Figure 35: Europe Closures For Wine Revenue (million), by Country 2025 & 2033
- Figure 36: Europe Closures For Wine Volume (K), by Country 2025 & 2033
- Figure 37: Europe Closures For Wine Revenue Share (%), by Country 2025 & 2033
- Figure 38: Europe Closures For Wine Volume Share (%), by Country 2025 & 2033
- Figure 39: Middle East & Africa Closures For Wine Revenue (million), by Application 2025 & 2033
- Figure 40: Middle East & Africa Closures For Wine Volume (K), by Application 2025 & 2033
- Figure 41: Middle East & Africa Closures For Wine Revenue Share (%), by Application 2025 & 2033
- Figure 42: Middle East & Africa Closures For Wine Volume Share (%), by Application 2025 & 2033
- Figure 43: Middle East & Africa Closures For Wine Revenue (million), by Type 2025 & 2033
- Figure 44: Middle East & Africa Closures For Wine Volume (K), by Type 2025 & 2033
- Figure 45: Middle East & Africa Closures For Wine Revenue Share (%), by Type 2025 & 2033
- Figure 46: Middle East & Africa Closures For Wine Volume Share (%), by Type 2025 & 2033
- Figure 47: Middle East & Africa Closures For Wine Revenue (million), by Country 2025 & 2033
- Figure 48: Middle East & Africa Closures For Wine Volume (K), by Country 2025 & 2033
- Figure 49: Middle East & Africa Closures For Wine Revenue Share (%), by Country 2025 & 2033
- Figure 50: Middle East & Africa Closures For Wine Volume Share (%), by Country 2025 & 2033
- Figure 51: Asia Pacific Closures For Wine Revenue (million), by Application 2025 & 2033
- Figure 52: Asia Pacific Closures For Wine Volume (K), by Application 2025 & 2033
- Figure 53: Asia Pacific Closures For Wine Revenue Share (%), by Application 2025 & 2033
- Figure 54: Asia Pacific Closures For Wine Volume Share (%), by Application 2025 & 2033
- Figure 55: Asia Pacific Closures For Wine Revenue (million), by Type 2025 & 2033
- Figure 56: Asia Pacific Closures For Wine Volume (K), by Type 2025 & 2033
- Figure 57: Asia Pacific Closures For Wine Revenue Share (%), by Type 2025 & 2033
- Figure 58: Asia Pacific Closures For Wine Volume Share (%), by Type 2025 & 2033
- Figure 59: Asia Pacific Closures For Wine Revenue (million), by Country 2025 & 2033
- Figure 60: Asia Pacific Closures For Wine Volume (K), by Country 2025 & 2033
- Figure 61: Asia Pacific Closures For Wine Revenue Share (%), by Country 2025 & 2033
- Figure 62: Asia Pacific Closures For Wine Volume Share (%), by Country 2025 & 2033
List of Tables
- Table 1: Global Closures For Wine Revenue million Forecast, by Application 2020 & 2033
- Table 2: Global Closures For Wine Volume K Forecast, by Application 2020 & 2033
- Table 3: Global Closures For Wine Revenue million Forecast, by Type 2020 & 2033
- Table 4: Global Closures For Wine Volume K Forecast, by Type 2020 & 2033
- Table 5: Global Closures For Wine Revenue million Forecast, by Region 2020 & 2033
- Table 6: Global Closures For Wine Volume K Forecast, by Region 2020 & 2033
- Table 7: Global Closures For Wine Revenue million Forecast, by Application 2020 & 2033
- Table 8: Global Closures For Wine Volume K Forecast, by Application 2020 & 2033
- Table 9: Global Closures For Wine Revenue million Forecast, by Type 2020 & 2033
- Table 10: Global Closures For Wine Volume K Forecast, by Type 2020 & 2033
- Table 11: Global Closures For Wine Revenue million Forecast, by Country 2020 & 2033
- Table 12: Global Closures For Wine Volume K Forecast, by Country 2020 & 2033
- Table 13: United States Closures For Wine Revenue (million) Forecast, by Application 2020 & 2033
- Table 14: United States Closures For Wine Volume (K) Forecast, by Application 2020 & 2033
- Table 15: Canada Closures For Wine Revenue (million) Forecast, by Application 2020 & 2033
- Table 16: Canada Closures For Wine Volume (K) Forecast, by Application 2020 & 2033
- Table 17: Mexico Closures For Wine Revenue (million) Forecast, by Application 2020 & 2033
- Table 18: Mexico Closures For Wine Volume (K) Forecast, by Application 2020 & 2033
- Table 19: Global Closures For Wine Revenue million Forecast, by Application 2020 & 2033
- Table 20: Global Closures For Wine Volume K Forecast, by Application 2020 & 2033
- Table 21: Global Closures For Wine Revenue million Forecast, by Type 2020 & 2033
- Table 22: Global Closures For Wine Volume K Forecast, by Type 2020 & 2033
- Table 23: Global Closures For Wine Revenue million Forecast, by Country 2020 & 2033
- Table 24: Global Closures For Wine Volume K Forecast, by Country 2020 & 2033
- Table 25: Brazil Closures For Wine Revenue (million) Forecast, by Application 2020 & 2033
- Table 26: Brazil Closures For Wine Volume (K) Forecast, by Application 2020 & 2033
- Table 27: Argentina Closures For Wine Revenue (million) Forecast, by Application 2020 & 2033
- Table 28: Argentina Closures For Wine Volume (K) Forecast, by Application 2020 & 2033
- Table 29: Rest of South America Closures For Wine Revenue (million) Forecast, by Application 2020 & 2033
- Table 30: Rest of South America Closures For Wine Volume (K) Forecast, by Application 2020 & 2033
- Table 31: Global Closures For Wine Revenue million Forecast, by Application 2020 & 2033
- Table 32: Global Closures For Wine Volume K Forecast, by Application 2020 & 2033
- Table 33: Global Closures For Wine Revenue million Forecast, by Type 2020 & 2033
- Table 34: Global Closures For Wine Volume K Forecast, by Type 2020 & 2033
- Table 35: Global Closures For Wine Revenue million Forecast, by Country 2020 & 2033
- Table 36: Global Closures For Wine Volume K Forecast, by Country 2020 & 2033
- Table 37: United Kingdom Closures For Wine Revenue (million) Forecast, by Application 2020 & 2033
- Table 38: United Kingdom Closures For Wine Volume (K) Forecast, by Application 2020 & 2033
- Table 39: Germany Closures For Wine Revenue (million) Forecast, by Application 2020 & 2033
- Table 40: Germany Closures For Wine Volume (K) Forecast, by Application 2020 & 2033
- Table 41: France Closures For Wine Revenue (million) Forecast, by Application 2020 & 2033
- Table 42: France Closures For Wine Volume (K) Forecast, by Application 2020 & 2033
- Table 43: Italy Closures For Wine Revenue (million) Forecast, by Application 2020 & 2033
- Table 44: Italy Closures For Wine Volume (K) Forecast, by Application 2020 & 2033
- Table 45: Spain Closures For Wine Revenue (million) Forecast, by Application 2020 & 2033
- Table 46: Spain Closures For Wine Volume (K) Forecast, by Application 2020 & 2033
- Table 47: Russia Closures For Wine Revenue (million) Forecast, by Application 2020 & 2033
- Table 48: Russia Closures For Wine Volume (K) Forecast, by Application 2020 & 2033
- Table 49: Benelux Closures For Wine Revenue (million) Forecast, by Application 2020 & 2033
- Table 50: Benelux Closures For Wine Volume (K) Forecast, by Application 2020 & 2033
- Table 51: Nordics Closures For Wine Revenue (million) Forecast, by Application 2020 & 2033
- Table 52: Nordics Closures For Wine Volume (K) Forecast, by Application 2020 & 2033
- Table 53: Rest of Europe Closures For Wine Revenue (million) Forecast, by Application 2020 & 2033
- Table 54: Rest of Europe Closures For Wine Volume (K) Forecast, by Application 2020 & 2033
- Table 55: Global Closures For Wine Revenue million Forecast, by Application 2020 & 2033
- Table 56: Global Closures For Wine Volume K Forecast, by Application 2020 & 2033
- Table 57: Global Closures For Wine Revenue million Forecast, by Type 2020 & 2033
- Table 58: Global Closures For Wine Volume K Forecast, by Type 2020 & 2033
- Table 59: Global Closures For Wine Revenue million Forecast, by Country 2020 & 2033
- Table 60: Global Closures For Wine Volume K Forecast, by Country 2020 & 2033
- Table 61: Turkey Closures For Wine Revenue (million) Forecast, by Application 2020 & 2033
- Table 62: Turkey Closures For Wine Volume (K) Forecast, by Application 2020 & 2033
- Table 63: Israel Closures For Wine Revenue (million) Forecast, by Application 2020 & 2033
- Table 64: Israel Closures For Wine Volume (K) Forecast, by Application 2020 & 2033
- Table 65: GCC Closures For Wine Revenue (million) Forecast, by Application 2020 & 2033
- Table 66: GCC Closures For Wine Volume (K) Forecast, by Application 2020 & 2033
- Table 67: North Africa Closures For Wine Revenue (million) Forecast, by Application 2020 & 2033
- Table 68: North Africa Closures For Wine Volume (K) Forecast, by Application 2020 & 2033
- Table 69: South Africa Closures For Wine Revenue (million) Forecast, by Application 2020 & 2033
- Table 70: South Africa Closures For Wine Volume (K) Forecast, by Application 2020 & 2033
- Table 71: Rest of Middle East & Africa Closures For Wine Revenue (million) Forecast, by Application 2020 & 2033
- Table 72: Rest of Middle East & Africa Closures For Wine Volume (K) Forecast, by Application 2020 & 2033
- Table 73: Global Closures For Wine Revenue million Forecast, by Application 2020 & 2033
- Table 74: Global Closures For Wine Volume K Forecast, by Application 2020 & 2033
- Table 75: Global Closures For Wine Revenue million Forecast, by Type 2020 & 2033
- Table 76: Global Closures For Wine Volume K Forecast, by Type 2020 & 2033
- Table 77: Global Closures For Wine Revenue million Forecast, by Country 2020 & 2033
- Table 78: Global Closures For Wine Volume K Forecast, by Country 2020 & 2033
- Table 79: China Closures For Wine Revenue (million) Forecast, by Application 2020 & 2033
- Table 80: China Closures For Wine Volume (K) Forecast, by Application 2020 & 2033
- Table 81: India Closures For Wine Revenue (million) Forecast, by Application 2020 & 2033
- Table 82: India Closures For Wine Volume (K) Forecast, by Application 2020 & 2033
- Table 83: Japan Closures For Wine Revenue (million) Forecast, by Application 2020 & 2033
- Table 84: Japan Closures For Wine Volume (K) Forecast, by Application 2020 & 2033
- Table 85: South Korea Closures For Wine Revenue (million) Forecast, by Application 2020 & 2033
- Table 86: South Korea Closures For Wine Volume (K) Forecast, by Application 2020 & 2033
- Table 87: ASEAN Closures For Wine Revenue (million) Forecast, by Application 2020 & 2033
- Table 88: ASEAN Closures For Wine Volume (K) Forecast, by Application 2020 & 2033
- Table 89: Oceania Closures For Wine Revenue (million) Forecast, by Application 2020 & 2033
- Table 90: Oceania Closures For Wine Volume (K) Forecast, by Application 2020 & 2033
- Table 91: Rest of Asia Pacific Closures For Wine Revenue (million) Forecast, by Application 2020 & 2033
- Table 92: Rest of Asia Pacific Closures For Wine Volume (K) Forecast, by Application 2020 & 2033
Frequently Asked Questions
1. What is the projected Compound Annual Growth Rate (CAGR) of the Closures For Wine?
The projected CAGR is approximately XXX%.
2. Which companies are prominent players in the Closures For Wine?
Key companies in the market include Amorim, MASilva, Cork Supply, Vinvention, Guala Closures Group, Labrenta, DIAM, Precision Elite, Waterloo Container Company, AMCOR.
3. What are the main segments of the Closures For Wine?
The market segments include Application, Type.
4. Can you provide details about the market size?
The market size is estimated to be USD XXX million as of 2022.
5. What are some drivers contributing to market growth?
N/A
6. What are the notable trends driving market growth?
N/A
7. Are there any restraints impacting market growth?
N/A
8. Can you provide examples of recent developments in the market?
N/A
9. What pricing options are available for accessing the report?
Pricing options include single-user, multi-user, and enterprise licenses priced at USD 3950.00, USD 5925.00, and USD 7900.00 respectively.
10. Is the market size provided in terms of value or volume?
The market size is provided in terms of value, measured in million and volume, measured in K.
11. Are there any specific market keywords associated with the report?
Yes, the market keyword associated with the report is "Closures For Wine," which aids in identifying and referencing the specific market segment covered.
12. How do I determine which pricing option suits my needs best?
The pricing options vary based on user requirements and access needs. Individual users may opt for single-user licenses, while businesses requiring broader access may choose multi-user or enterprise licenses for cost-effective access to the report.
13. Are there any additional resources or data provided in the Closures For Wine report?
While the report offers comprehensive insights, it's advisable to review the specific contents or supplementary materials provided to ascertain if additional resources or data are available.
14. How can I stay updated on further developments or reports in the Closures For Wine?
To stay informed about further developments, trends, and reports in the Closures For Wine, consider subscribing to industry newsletters, following relevant companies and organizations, or regularly checking reputable industry news sources and publications.
Methodology
Step 1 - Identification of Relevant Samples Size from Population Database


Step 2 - Approaches for Defining Global Market Size (Value, Volume* & Price*)

Note*: In applicable scenarios
Step 3 - Data Sources
Primary Research
- Web Analytics
- Survey Reports
- Research Institute
- Latest Research Reports
- Opinion Leaders
Secondary Research
- Annual Reports
- White Paper
- Latest Press Release
- Industry Association
- Paid Database
- Investor Presentations

Step 4 - Data Triangulation
Involves using different sources of information in order to increase the validity of a study
These sources are likely to be stakeholders in a program - participants, other researchers, program staff, other community members, and so on.
Then we put all data in single framework & apply various statistical tools to find out the dynamic on the market.
During the analysis stage, feedback from the stakeholder groups would be compared to determine areas of agreement as well as areas of divergence