

Key Insights
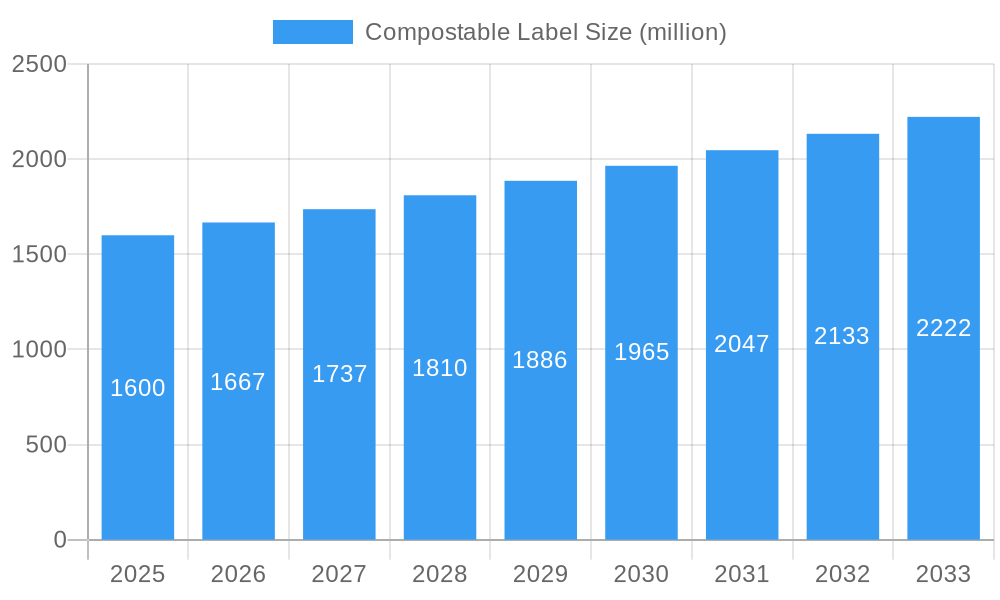
The global compostable label market is poised for significant expansion, projected to reach $1.6 billion in 2025. This growth is fueled by a robust CAGR of 4.3% from 2019 to 2033, indicating a sustained upward trajectory. Key drivers for this expansion stem from increasing consumer demand for sustainable packaging solutions, coupled with stricter environmental regulations worldwide that encourage the adoption of eco-friendly materials. The food and beverage sector, a primary consumer of labeling solutions, is at the forefront of this shift, seeking to align its brand image with environmental responsibility. Cosmetics and other diverse applications are also witnessing a growing preference for compostable labels, driven by brand differentiation and a desire to appeal to environmentally conscious demographics. The market is characterized by an increasing focus on innovation in material science, leading to the development of more efficient and cost-effective compostable label solutions.
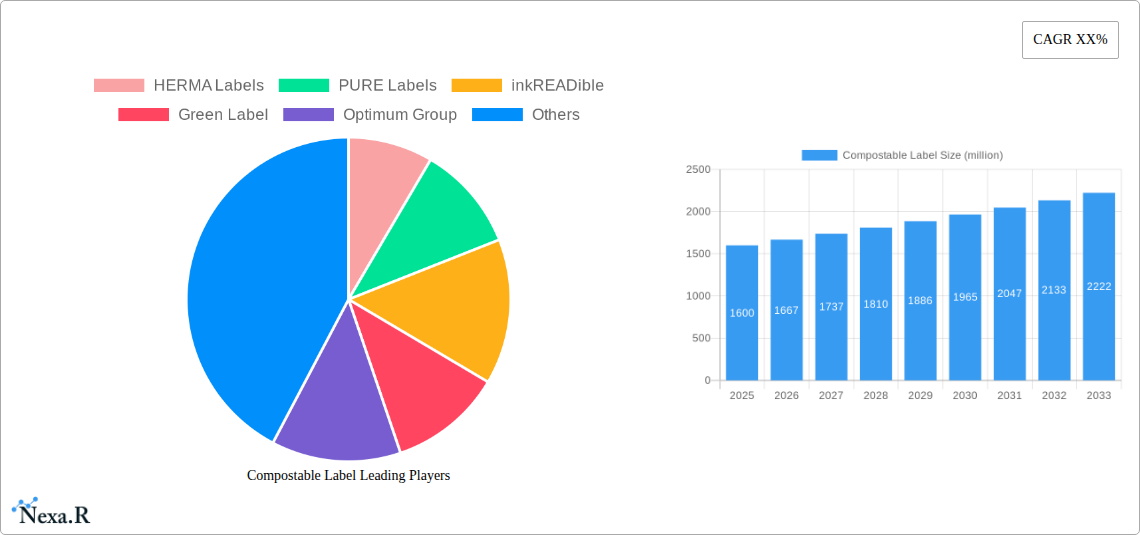
Compostable Label Market Size (In Billion)
The market is segmented into "White" and "Transparent" types, with "White" labels likely dominating due to their broad applicability and cost-effectiveness in various consumer goods. The "Application" segment is led by the "Food" sector, followed by "Cosmetics" and then "Others," reflecting the pervasive need for clear, informative, and sustainable labeling across industries. Restraints, such as higher initial costs compared to conventional labels and potential performance limitations in certain extreme conditions, are being actively addressed through technological advancements and economies of scale. Leading companies like Avery Dennison, HERMA Labels, and PURE Labels are investing heavily in research and development to overcome these challenges and capture market share. Geographically, Asia Pacific, particularly China and India, is emerging as a significant growth hub due to rapid industrialization and a burgeoning middle class with growing environmental awareness. North America and Europe continue to be strong markets, driven by established sustainability initiatives and consumer pressure.
Compostable Label Company Market Share
Compostable Label Market: Sustainable Packaging Solutions Poised for Explosive Growth
This comprehensive report offers an in-depth analysis of the global Compostable Label market, charting its trajectory from 2019 to 2033. With a robust focus on key drivers, market dynamics, regional dominance, and future opportunities, this study is an indispensable resource for manufacturers, suppliers, investors, and industry stakeholders seeking to navigate and capitalize on the burgeoning demand for eco-friendly labeling solutions. The report meticulously analyzes market segmentation by application (Food, Cosmetics, Others) and type (White, Transparent), providing granular insights into their respective growth potentials. We leverage a wealth of data from the historical period (2019-2024), base year (2025), estimated year (2025), and forecast period (2025-2033) to deliver an accurate and forward-looking market outlook. This report specifically integrates high-traffic keywords crucial for SEO optimization, ensuring maximum visibility for professionals seeking information on sustainable packaging, biodegradable labels, eco-friendly printing, and circular economy solutions.
Compostable Label Market Dynamics & Structure
The compostable label market is characterized by a moderately concentrated landscape, with a few key players holding significant market share while numerous smaller enterprises contribute to a dynamic competitive environment. Technological innovation is a primary driver, fueled by advancements in bio-based materials, printing technologies, and adhesion solutions that enhance compostability without compromising performance. Regulatory frameworks, particularly those promoting sustainable waste management and reducing single-use plastics, are increasingly shaping market entry and product development. Competitive product substitutes, such as recyclable labels and non-compostable alternatives, pose a challenge, yet the growing consumer and corporate preference for certified compostable options is steadily eroding their market share. End-user demographics are shifting significantly, with a pronounced demand from environmentally conscious consumers and businesses aiming to meet sustainability targets. Mergers & Acquisitions (M&A) trends indicate consolidation and strategic partnerships as companies seek to expand their product portfolios, gain market access, and achieve economies of scale.
- Market Concentration: Moderately concentrated, with key players like Avery Dennison, HERMA Labels, and PURE Labels holding substantial influence.
- Technological Innovation: Driven by biopolymer research, advanced printing inks, and barrier property enhancement.
- Regulatory Frameworks: Increasingly stringent waste management policies and extended producer responsibility schemes.
- Competitive Product Substitutes: Recyclable labels, compostable films, and traditional non-eco-friendly labels.
- End-User Demographics: Growing demand from food & beverage, personal care, and sustainable consumer goods sectors.
- M&A Trends: Strategic acquisitions to enhance product offerings and market reach, observed with Xinxing Label and Elevate Packaging showing interest in expanding capabilities.
Compostable Label Growth Trends & Insights
The compostable label market is experiencing robust growth, propelled by a confluence of escalating environmental awareness, stringent government regulations, and a paradigm shift in consumer preferences towards sustainable products. The market size is projected to expand significantly, with adoption rates steadily increasing across various industries. This growth is underpinned by significant technological disruptions, including the development of novel bio-based polymers that offer enhanced compostability and performance characteristics, as well as advancements in printing and adhesive technologies tailored for sustainable materials. Consumer behavior is playing a pivotal role, with a growing segment actively seeking products with clear eco-friendly credentials, including compostable packaging and labels, to align with their personal values and contribute to a circular economy. This shift is compelling brands to invest in sustainable solutions to maintain customer loyalty and brand reputation. The market penetration of compostable labels, while still nascent in certain regions, is rapidly gaining momentum, driven by increasing availability of certified materials and a growing understanding of their benefits.
The CAGR for the compostable label market is projected to be approximately XX% over the forecast period, indicating substantial expansion from its current valuation. In the base year of 2025, the global market size for compostable labels is estimated to reach $XX billion. This growth is not merely opportunistic but is deeply rooted in fundamental changes in how businesses and consumers perceive and interact with packaging. The food and beverage sector, a major consumer of labels, is leading this charge due to increasing consumer demand for sustainably packaged food items and the growing emphasis on reducing food waste through responsible packaging. Similarly, the cosmetics industry, driven by a conscious consumer base and a desire to project an image of environmental responsibility, is rapidly adopting compostable labeling solutions. The "Others" segment, encompassing industries like pharmaceuticals, e-commerce, and industrial goods, is also witnessing a significant uptick in demand as sustainability becomes a universal business imperative.
Technological advancements are not just about creating new materials but also about optimizing their application. Innovations in pressure-sensitive adhesives that are also compostable, and printing inks that do not hinder the decomposition process, are crucial for widespread adoption. Furthermore, the development of labels designed for specific composting environments – industrial or home – caters to diverse consumer needs and local waste management infrastructures. The evolving consumer landscape, with younger generations showing a particularly strong preference for eco-friendly products, ensures a sustained demand for compostable labels. Brands are recognizing that sustainability is no longer a niche selling point but a core expectation, and compostable labels are a tangible way to demonstrate this commitment. The increasing availability of standardized certifications for compostability further instills confidence in both manufacturers and consumers, fostering trust and driving market growth. The interplay between technological innovation, consumer demand, and supportive regulatory policies creates a powerful engine for the sustained and accelerated growth of the compostable label market.
Dominant Regions, Countries, or Segments in Compostable Label
The Food segment is emerging as the dominant force driving the growth of the global compostable label market. This dominance is fueled by a confluence of factors, including increasing consumer demand for sustainably packaged food items, stringent regulations aimed at reducing food waste and packaging materials, and the food industry's proactive stance on corporate social responsibility. In 2025, the Food application segment is estimated to account for XX% of the total compostable label market, translating to a market value of $XX billion. This segment's growth potential is immense, as brands continually seek innovative ways to differentiate their products on crowded shelves while appealing to environmentally conscious consumers. The need for clear labeling of ingredients, origin, and shelf life, coupled with the desire for compostable packaging, makes compostable labels an indispensable component for the food industry.
- Key Drivers for Food Segment Dominance:
- Consumer Demand: Growing preference for eco-friendly food packaging.
- Regulatory Push: Government initiatives to curb packaging waste and promote circular economy principles.
- Brand Differentiation: Labels as a key tool for communicating sustainability credentials.
- Food Safety & Traceability: Compostable labels offering an eco-conscious solution for essential labeling needs.
The White compostable label type also holds a significant advantage, particularly within the dominant Food and Cosmetics applications. White labels provide a versatile and universally accepted aesthetic for branding, product information, and compliance markings. Their ability to showcase vibrant printing and maintain clarity makes them a preferred choice for a wide range of products. In 2025, the White label segment is projected to capture XX% of the market share, valued at approximately $XX billion. The reliability and established manufacturing processes for white compostable materials contribute to their widespread adoption.
- Key Drivers for White Label Dominance:
- Versatility: Suitable for a broad spectrum of product branding and information.
- Print Quality: Excellent for high-resolution graphics and text.
- Cost-Effectiveness: Mature production processes contribute to competitive pricing.
- Consumer Familiarity: A widely recognized and accepted label appearance.
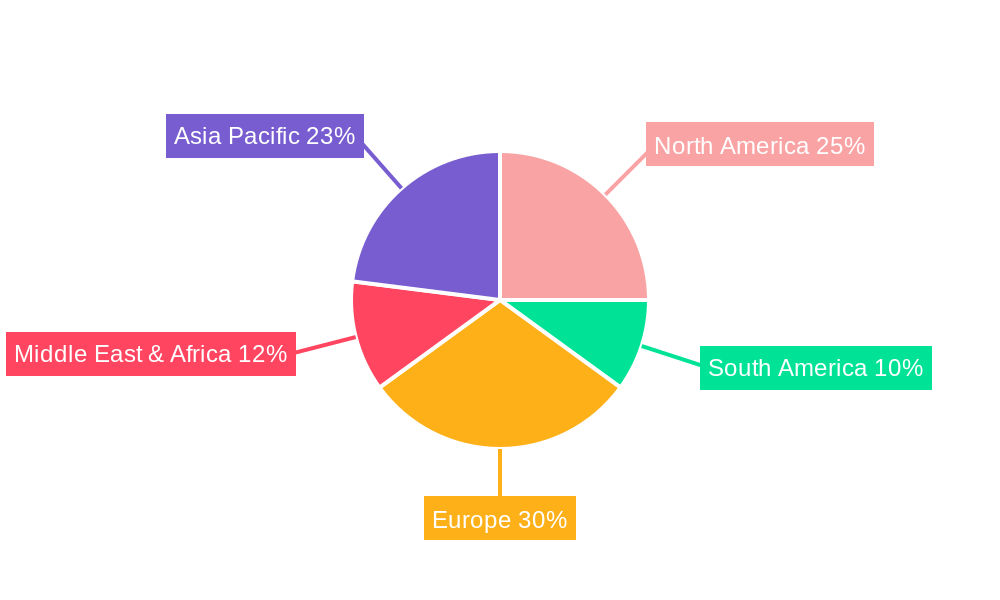
Regionally, Europe is leading the charge in the compostable label market, driven by its progressive environmental policies, high consumer awareness, and robust recycling and composting infrastructure. European countries are at the forefront of implementing Extended Producer Responsibility (EPR) schemes and plastic reduction targets, creating a fertile ground for the adoption of compostable solutions. In 2025, Europe is estimated to hold XX% of the global compostable label market share, valued at $XX billion. The region's strong commitment to sustainability and the presence of leading sustainable packaging manufacturers further solidify its dominance. North America and the Asia-Pacific region are also demonstrating rapid growth, with increasing adoption driven by growing environmental consciousness and policy shifts.
- Key Drivers for European Dominance:
- Strong Environmental Policies: EU directives on waste reduction and sustainable packaging.
- High Consumer Awareness: Proactive engagement in sustainable practices.
- Developed Infrastructure: Extensive composting and waste management facilities.
- Corporate Sustainability Goals: Leading companies setting ambitious environmental targets.
The interplay between these dominant segments and regions creates a powerful engine for the overall growth of the compostable label market. As consumer preferences continue to evolve and regulatory landscapes become more conducive to sustainable practices, the market is poised for significant expansion, with the Food application and White label types leading the way, supported by the pioneering efforts of regions like Europe.
Compostable Label Product Landscape
The compostable label product landscape is rapidly evolving with innovative solutions designed for enhanced sustainability and performance. Manufacturers are introducing a diverse range of compostable label materials derived from plant-based sources like corn starch, sugarcane, and wood pulp, offering biodegradable and home-compostable certifications. Unique selling propositions include improved printability, water resistance, and adhesion properties on various substrates, ensuring they meet the functional requirements of diverse applications in the food and cosmetics industries. Technological advancements focus on creating labels that degrade effectively in industrial and home composting environments without leaving harmful residues, contributing to a truly circular economy.
Key Drivers, Barriers & Challenges in Compostable Label
Key Drivers:
- Surging Consumer Demand: Growing eco-consciousness drives preference for sustainable packaging.
- Stringent Environmental Regulations: Government mandates and policies promoting waste reduction and biodegradability.
- Corporate Sustainability Goals: Businesses actively seeking to reduce their environmental footprint.
- Technological Advancements: Development of higher-performing, cost-effective compostable materials and adhesives.
- Brand Image Enhancement: Companies leveraging eco-friendly labels to build positive brand perception.
Barriers & Challenges:
- Cost Competitiveness: Higher initial costs compared to conventional petroleum-based labels.
- Performance Limitations: Durability, moisture resistance, and shelf-life concerns in certain applications.
- Infrastructure Gaps: Limited availability of industrial composting facilities in some regions.
- Consumer Education: Lack of widespread understanding regarding proper disposal of compostable materials.
- Supply Chain Volatility: Potential disruptions in the sourcing of raw materials for bioplastics.
- Regulatory Harmonization: Inconsistent international standards for compostability certification.
- Competitive Pressure: Ongoing dominance of non-compostable but cheaper alternatives.
Emerging Opportunities in Compostable Label
Emerging opportunities in the compostable label sector lie in the development of specialized labels for niche applications requiring enhanced durability or specific barrier properties, such as those for frozen foods or outdoor products. The burgeoning e-commerce industry presents a significant untapped market for compostable shipping labels. Furthermore, innovations in smart labeling technologies integrated with compostable materials could offer new avenues for product tracking and consumer engagement. The growing demand for home-compostable solutions, catering to consumers with accessible composting facilities, presents another promising area for market penetration. Collaboration with waste management companies to improve collection and processing infrastructure will also be key to unlocking further growth.
Growth Accelerators in the Compostable Label Industry
Growth accelerators for the compostable label industry include ongoing research and development into novel bio-based polymers offering superior performance and cost-effectiveness. Strategic partnerships between label manufacturers, raw material suppliers, and major brand owners are crucial for driving widespread adoption and scaling production. Market expansion into developing economies, where environmental regulations are becoming more stringent and consumer awareness is rising, presents a significant growth opportunity. The development of standardized certifications and clear labeling guidelines will foster greater consumer trust and simplify market entry for new players. Investments in advanced manufacturing processes to improve efficiency and reduce production costs will further accelerate growth.
Key Players Shaping the Compostable Label Market
- HERMA Labels
- PURE Labels
- inkREADible
- Green Label
- Optimum Group
- A4Labels
- Wedderburn
- Labels Plus
- Elevate Packaging
- Xinxing Label
- Avery Dennison
- Huizhou Yito Packaging
Notable Milestones in Compostable Label Sector
- 2019: Increased focus on bio-based materials and certifications like TÜV Austria OK Compost.
- 2020: Launch of new compostable adhesive formulations by key players.
- 2021: Growing adoption by major food and beverage brands in Europe.
- 2022: advancements in home-compostable label materials gain traction.
- 2023: Increased M&A activity as companies seek to expand their sustainable packaging portfolios.
- 2024: Growing awareness and demand for compostable labels in the cosmetics sector.
In-Depth Compostable Label Market Outlook
The compostable label market is poised for substantial future growth, driven by a robust combination of consumer demand, regulatory tailwinds, and continuous innovation. Key growth accelerators include the development of next-generation bio-based materials that offer enhanced functionality and cost-competitiveness, alongside strategic collaborations that streamline supply chains and accelerate market penetration. The increasing global commitment to circular economy principles and plastic reduction further solidifies the long-term potential of compostable labeling solutions. Market expansion into underserved regions and the development of specialized applications will unlock new revenue streams. The future of labeling is undeniably sustainable, with compostable solutions at the forefront of this transformative shift.
Compostable Label Segmentation
-
1. Application
- 1.1. Food
- 1.2. Cosmetics
- 1.3. Others
-
2. Types
- 2.1. White
- 2.2. Transparent
Compostable Label Segmentation By Geography
-
1. North America
- 1.1. United States
- 1.2. Canada
- 1.3. Mexico
-
2. South America
- 2.1. Brazil
- 2.2. Argentina
- 2.3. Rest of South America
-
3. Europe
- 3.1. United Kingdom
- 3.2. Germany
- 3.3. France
- 3.4. Italy
- 3.5. Spain
- 3.6. Russia
- 3.7. Benelux
- 3.8. Nordics
- 3.9. Rest of Europe
-
4. Middle East & Africa
- 4.1. Turkey
- 4.2. Israel
- 4.3. GCC
- 4.4. North Africa
- 4.5. South Africa
- 4.6. Rest of Middle East & Africa
-
5. Asia Pacific
- 5.1. China
- 5.2. India
- 5.3. Japan
- 5.4. South Korea
- 5.5. ASEAN
- 5.6. Oceania
- 5.7. Rest of Asia Pacific
Compostable Label Regional Market Share
Geographic Coverage of Compostable Label
Compostable Label REPORT HIGHLIGHTS
| Aspects | Details |
|---|---|
| Study Period | 2020-2034 |
| Base Year | 2025 |
| Estimated Year | 2026 |
| Forecast Period | 2026-2034 |
| Historical Period | 2020-2025 |
| Growth Rate | CAGR of 4.3% from 2020-2034 |
| Segmentation |
|
Table of Contents
- 1. Introduction
- 1.1. Research Scope
- 1.2. Market Segmentation
- 1.3. Research Methodology
- 1.4. Definitions and Assumptions
- 2. Executive Summary
- 2.1. Introduction
- 3. Market Dynamics
- 3.1. Introduction
- 3.2. Market Drivers
- 3.3. Market Restrains
- 3.4. Market Trends
- 4. Market Factor Analysis
- 4.1. Porters Five Forces
- 4.2. Supply/Value Chain
- 4.3. PESTEL analysis
- 4.4. Market Entropy
- 4.5. Patent/Trademark Analysis
- 5. Global Compostable Label Analysis, Insights and Forecast, 2020-2032
- 5.1. Market Analysis, Insights and Forecast - by Application
- 5.1.1. Food
- 5.1.2. Cosmetics
- 5.1.3. Others
- 5.2. Market Analysis, Insights and Forecast - by Types
- 5.2.1. White
- 5.2.2. Transparent
- 5.3. Market Analysis, Insights and Forecast - by Region
- 5.3.1. North America
- 5.3.2. South America
- 5.3.3. Europe
- 5.3.4. Middle East & Africa
- 5.3.5. Asia Pacific
- 5.1. Market Analysis, Insights and Forecast - by Application
- 6. North America Compostable Label Analysis, Insights and Forecast, 2020-2032
- 6.1. Market Analysis, Insights and Forecast - by Application
- 6.1.1. Food
- 6.1.2. Cosmetics
- 6.1.3. Others
- 6.2. Market Analysis, Insights and Forecast - by Types
- 6.2.1. White
- 6.2.2. Transparent
- 6.1. Market Analysis, Insights and Forecast - by Application
- 7. South America Compostable Label Analysis, Insights and Forecast, 2020-2032
- 7.1. Market Analysis, Insights and Forecast - by Application
- 7.1.1. Food
- 7.1.2. Cosmetics
- 7.1.3. Others
- 7.2. Market Analysis, Insights and Forecast - by Types
- 7.2.1. White
- 7.2.2. Transparent
- 7.1. Market Analysis, Insights and Forecast - by Application
- 8. Europe Compostable Label Analysis, Insights and Forecast, 2020-2032
- 8.1. Market Analysis, Insights and Forecast - by Application
- 8.1.1. Food
- 8.1.2. Cosmetics
- 8.1.3. Others
- 8.2. Market Analysis, Insights and Forecast - by Types
- 8.2.1. White
- 8.2.2. Transparent
- 8.1. Market Analysis, Insights and Forecast - by Application
- 9. Middle East & Africa Compostable Label Analysis, Insights and Forecast, 2020-2032
- 9.1. Market Analysis, Insights and Forecast - by Application
- 9.1.1. Food
- 9.1.2. Cosmetics
- 9.1.3. Others
- 9.2. Market Analysis, Insights and Forecast - by Types
- 9.2.1. White
- 9.2.2. Transparent
- 9.1. Market Analysis, Insights and Forecast - by Application
- 10. Asia Pacific Compostable Label Analysis, Insights and Forecast, 2020-2032
- 10.1. Market Analysis, Insights and Forecast - by Application
- 10.1.1. Food
- 10.1.2. Cosmetics
- 10.1.3. Others
- 10.2. Market Analysis, Insights and Forecast - by Types
- 10.2.1. White
- 10.2.2. Transparent
- 10.1. Market Analysis, Insights and Forecast - by Application
- 11. Competitive Analysis
- 11.1. Global Market Share Analysis 2025
- 11.2. Company Profiles
- 11.2.1 HERMA Labels
- 11.2.1.1. Overview
- 11.2.1.2. Products
- 11.2.1.3. SWOT Analysis
- 11.2.1.4. Recent Developments
- 11.2.1.5. Financials (Based on Availability)
- 11.2.2 PURE Labels
- 11.2.2.1. Overview
- 11.2.2.2. Products
- 11.2.2.3. SWOT Analysis
- 11.2.2.4. Recent Developments
- 11.2.2.5. Financials (Based on Availability)
- 11.2.3 inkREADible
- 11.2.3.1. Overview
- 11.2.3.2. Products
- 11.2.3.3. SWOT Analysis
- 11.2.3.4. Recent Developments
- 11.2.3.5. Financials (Based on Availability)
- 11.2.4 Green Label
- 11.2.4.1. Overview
- 11.2.4.2. Products
- 11.2.4.3. SWOT Analysis
- 11.2.4.4. Recent Developments
- 11.2.4.5. Financials (Based on Availability)
- 11.2.5 Optimum Group
- 11.2.5.1. Overview
- 11.2.5.2. Products
- 11.2.5.3. SWOT Analysis
- 11.2.5.4. Recent Developments
- 11.2.5.5. Financials (Based on Availability)
- 11.2.6 A4Labels
- 11.2.6.1. Overview
- 11.2.6.2. Products
- 11.2.6.3. SWOT Analysis
- 11.2.6.4. Recent Developments
- 11.2.6.5. Financials (Based on Availability)
- 11.2.7 Wedderburn
- 11.2.7.1. Overview
- 11.2.7.2. Products
- 11.2.7.3. SWOT Analysis
- 11.2.7.4. Recent Developments
- 11.2.7.5. Financials (Based on Availability)
- 11.2.8 Labels Plus
- 11.2.8.1. Overview
- 11.2.8.2. Products
- 11.2.8.3. SWOT Analysis
- 11.2.8.4. Recent Developments
- 11.2.8.5. Financials (Based on Availability)
- 11.2.9 Elevate Packaging
- 11.2.9.1. Overview
- 11.2.9.2. Products
- 11.2.9.3. SWOT Analysis
- 11.2.9.4. Recent Developments
- 11.2.9.5. Financials (Based on Availability)
- 11.2.10 Xinxing Label
- 11.2.10.1. Overview
- 11.2.10.2. Products
- 11.2.10.3. SWOT Analysis
- 11.2.10.4. Recent Developments
- 11.2.10.5. Financials (Based on Availability)
- 11.2.11 Avery Dennison
- 11.2.11.1. Overview
- 11.2.11.2. Products
- 11.2.11.3. SWOT Analysis
- 11.2.11.4. Recent Developments
- 11.2.11.5. Financials (Based on Availability)
- 11.2.12 Huizhou Yito Packaging
- 11.2.12.1. Overview
- 11.2.12.2. Products
- 11.2.12.3. SWOT Analysis
- 11.2.12.4. Recent Developments
- 11.2.12.5. Financials (Based on Availability)
- 11.2.1 HERMA Labels
List of Figures
- Figure 1: Global Compostable Label Revenue Breakdown (undefined, %) by Region 2025 & 2033
- Figure 2: Global Compostable Label Volume Breakdown (K, %) by Region 2025 & 2033
- Figure 3: North America Compostable Label Revenue (undefined), by Application 2025 & 2033
- Figure 4: North America Compostable Label Volume (K), by Application 2025 & 2033
- Figure 5: North America Compostable Label Revenue Share (%), by Application 2025 & 2033
- Figure 6: North America Compostable Label Volume Share (%), by Application 2025 & 2033
- Figure 7: North America Compostable Label Revenue (undefined), by Types 2025 & 2033
- Figure 8: North America Compostable Label Volume (K), by Types 2025 & 2033
- Figure 9: North America Compostable Label Revenue Share (%), by Types 2025 & 2033
- Figure 10: North America Compostable Label Volume Share (%), by Types 2025 & 2033
- Figure 11: North America Compostable Label Revenue (undefined), by Country 2025 & 2033
- Figure 12: North America Compostable Label Volume (K), by Country 2025 & 2033
- Figure 13: North America Compostable Label Revenue Share (%), by Country 2025 & 2033
- Figure 14: North America Compostable Label Volume Share (%), by Country 2025 & 2033
- Figure 15: South America Compostable Label Revenue (undefined), by Application 2025 & 2033
- Figure 16: South America Compostable Label Volume (K), by Application 2025 & 2033
- Figure 17: South America Compostable Label Revenue Share (%), by Application 2025 & 2033
- Figure 18: South America Compostable Label Volume Share (%), by Application 2025 & 2033
- Figure 19: South America Compostable Label Revenue (undefined), by Types 2025 & 2033
- Figure 20: South America Compostable Label Volume (K), by Types 2025 & 2033
- Figure 21: South America Compostable Label Revenue Share (%), by Types 2025 & 2033
- Figure 22: South America Compostable Label Volume Share (%), by Types 2025 & 2033
- Figure 23: South America Compostable Label Revenue (undefined), by Country 2025 & 2033
- Figure 24: South America Compostable Label Volume (K), by Country 2025 & 2033
- Figure 25: South America Compostable Label Revenue Share (%), by Country 2025 & 2033
- Figure 26: South America Compostable Label Volume Share (%), by Country 2025 & 2033
- Figure 27: Europe Compostable Label Revenue (undefined), by Application 2025 & 2033
- Figure 28: Europe Compostable Label Volume (K), by Application 2025 & 2033
- Figure 29: Europe Compostable Label Revenue Share (%), by Application 2025 & 2033
- Figure 30: Europe Compostable Label Volume Share (%), by Application 2025 & 2033
- Figure 31: Europe Compostable Label Revenue (undefined), by Types 2025 & 2033
- Figure 32: Europe Compostable Label Volume (K), by Types 2025 & 2033
- Figure 33: Europe Compostable Label Revenue Share (%), by Types 2025 & 2033
- Figure 34: Europe Compostable Label Volume Share (%), by Types 2025 & 2033
- Figure 35: Europe Compostable Label Revenue (undefined), by Country 2025 & 2033
- Figure 36: Europe Compostable Label Volume (K), by Country 2025 & 2033
- Figure 37: Europe Compostable Label Revenue Share (%), by Country 2025 & 2033
- Figure 38: Europe Compostable Label Volume Share (%), by Country 2025 & 2033
- Figure 39: Middle East & Africa Compostable Label Revenue (undefined), by Application 2025 & 2033
- Figure 40: Middle East & Africa Compostable Label Volume (K), by Application 2025 & 2033
- Figure 41: Middle East & Africa Compostable Label Revenue Share (%), by Application 2025 & 2033
- Figure 42: Middle East & Africa Compostable Label Volume Share (%), by Application 2025 & 2033
- Figure 43: Middle East & Africa Compostable Label Revenue (undefined), by Types 2025 & 2033
- Figure 44: Middle East & Africa Compostable Label Volume (K), by Types 2025 & 2033
- Figure 45: Middle East & Africa Compostable Label Revenue Share (%), by Types 2025 & 2033
- Figure 46: Middle East & Africa Compostable Label Volume Share (%), by Types 2025 & 2033
- Figure 47: Middle East & Africa Compostable Label Revenue (undefined), by Country 2025 & 2033
- Figure 48: Middle East & Africa Compostable Label Volume (K), by Country 2025 & 2033
- Figure 49: Middle East & Africa Compostable Label Revenue Share (%), by Country 2025 & 2033
- Figure 50: Middle East & Africa Compostable Label Volume Share (%), by Country 2025 & 2033
- Figure 51: Asia Pacific Compostable Label Revenue (undefined), by Application 2025 & 2033
- Figure 52: Asia Pacific Compostable Label Volume (K), by Application 2025 & 2033
- Figure 53: Asia Pacific Compostable Label Revenue Share (%), by Application 2025 & 2033
- Figure 54: Asia Pacific Compostable Label Volume Share (%), by Application 2025 & 2033
- Figure 55: Asia Pacific Compostable Label Revenue (undefined), by Types 2025 & 2033
- Figure 56: Asia Pacific Compostable Label Volume (K), by Types 2025 & 2033
- Figure 57: Asia Pacific Compostable Label Revenue Share (%), by Types 2025 & 2033
- Figure 58: Asia Pacific Compostable Label Volume Share (%), by Types 2025 & 2033
- Figure 59: Asia Pacific Compostable Label Revenue (undefined), by Country 2025 & 2033
- Figure 60: Asia Pacific Compostable Label Volume (K), by Country 2025 & 2033
- Figure 61: Asia Pacific Compostable Label Revenue Share (%), by Country 2025 & 2033
- Figure 62: Asia Pacific Compostable Label Volume Share (%), by Country 2025 & 2033
List of Tables
- Table 1: Global Compostable Label Revenue undefined Forecast, by Application 2020 & 2033
- Table 2: Global Compostable Label Volume K Forecast, by Application 2020 & 2033
- Table 3: Global Compostable Label Revenue undefined Forecast, by Types 2020 & 2033
- Table 4: Global Compostable Label Volume K Forecast, by Types 2020 & 2033
- Table 5: Global Compostable Label Revenue undefined Forecast, by Region 2020 & 2033
- Table 6: Global Compostable Label Volume K Forecast, by Region 2020 & 2033
- Table 7: Global Compostable Label Revenue undefined Forecast, by Application 2020 & 2033
- Table 8: Global Compostable Label Volume K Forecast, by Application 2020 & 2033
- Table 9: Global Compostable Label Revenue undefined Forecast, by Types 2020 & 2033
- Table 10: Global Compostable Label Volume K Forecast, by Types 2020 & 2033
- Table 11: Global Compostable Label Revenue undefined Forecast, by Country 2020 & 2033
- Table 12: Global Compostable Label Volume K Forecast, by Country 2020 & 2033
- Table 13: United States Compostable Label Revenue (undefined) Forecast, by Application 2020 & 2033
- Table 14: United States Compostable Label Volume (K) Forecast, by Application 2020 & 2033
- Table 15: Canada Compostable Label Revenue (undefined) Forecast, by Application 2020 & 2033
- Table 16: Canada Compostable Label Volume (K) Forecast, by Application 2020 & 2033
- Table 17: Mexico Compostable Label Revenue (undefined) Forecast, by Application 2020 & 2033
- Table 18: Mexico Compostable Label Volume (K) Forecast, by Application 2020 & 2033
- Table 19: Global Compostable Label Revenue undefined Forecast, by Application 2020 & 2033
- Table 20: Global Compostable Label Volume K Forecast, by Application 2020 & 2033
- Table 21: Global Compostable Label Revenue undefined Forecast, by Types 2020 & 2033
- Table 22: Global Compostable Label Volume K Forecast, by Types 2020 & 2033
- Table 23: Global Compostable Label Revenue undefined Forecast, by Country 2020 & 2033
- Table 24: Global Compostable Label Volume K Forecast, by Country 2020 & 2033
- Table 25: Brazil Compostable Label Revenue (undefined) Forecast, by Application 2020 & 2033
- Table 26: Brazil Compostable Label Volume (K) Forecast, by Application 2020 & 2033
- Table 27: Argentina Compostable Label Revenue (undefined) Forecast, by Application 2020 & 2033
- Table 28: Argentina Compostable Label Volume (K) Forecast, by Application 2020 & 2033
- Table 29: Rest of South America Compostable Label Revenue (undefined) Forecast, by Application 2020 & 2033
- Table 30: Rest of South America Compostable Label Volume (K) Forecast, by Application 2020 & 2033
- Table 31: Global Compostable Label Revenue undefined Forecast, by Application 2020 & 2033
- Table 32: Global Compostable Label Volume K Forecast, by Application 2020 & 2033
- Table 33: Global Compostable Label Revenue undefined Forecast, by Types 2020 & 2033
- Table 34: Global Compostable Label Volume K Forecast, by Types 2020 & 2033
- Table 35: Global Compostable Label Revenue undefined Forecast, by Country 2020 & 2033
- Table 36: Global Compostable Label Volume K Forecast, by Country 2020 & 2033
- Table 37: United Kingdom Compostable Label Revenue (undefined) Forecast, by Application 2020 & 2033
- Table 38: United Kingdom Compostable Label Volume (K) Forecast, by Application 2020 & 2033
- Table 39: Germany Compostable Label Revenue (undefined) Forecast, by Application 2020 & 2033
- Table 40: Germany Compostable Label Volume (K) Forecast, by Application 2020 & 2033
- Table 41: France Compostable Label Revenue (undefined) Forecast, by Application 2020 & 2033
- Table 42: France Compostable Label Volume (K) Forecast, by Application 2020 & 2033
- Table 43: Italy Compostable Label Revenue (undefined) Forecast, by Application 2020 & 2033
- Table 44: Italy Compostable Label Volume (K) Forecast, by Application 2020 & 2033
- Table 45: Spain Compostable Label Revenue (undefined) Forecast, by Application 2020 & 2033
- Table 46: Spain Compostable Label Volume (K) Forecast, by Application 2020 & 2033
- Table 47: Russia Compostable Label Revenue (undefined) Forecast, by Application 2020 & 2033
- Table 48: Russia Compostable Label Volume (K) Forecast, by Application 2020 & 2033
- Table 49: Benelux Compostable Label Revenue (undefined) Forecast, by Application 2020 & 2033
- Table 50: Benelux Compostable Label Volume (K) Forecast, by Application 2020 & 2033
- Table 51: Nordics Compostable Label Revenue (undefined) Forecast, by Application 2020 & 2033
- Table 52: Nordics Compostable Label Volume (K) Forecast, by Application 2020 & 2033
- Table 53: Rest of Europe Compostable Label Revenue (undefined) Forecast, by Application 2020 & 2033
- Table 54: Rest of Europe Compostable Label Volume (K) Forecast, by Application 2020 & 2033
- Table 55: Global Compostable Label Revenue undefined Forecast, by Application 2020 & 2033
- Table 56: Global Compostable Label Volume K Forecast, by Application 2020 & 2033
- Table 57: Global Compostable Label Revenue undefined Forecast, by Types 2020 & 2033
- Table 58: Global Compostable Label Volume K Forecast, by Types 2020 & 2033
- Table 59: Global Compostable Label Revenue undefined Forecast, by Country 2020 & 2033
- Table 60: Global Compostable Label Volume K Forecast, by Country 2020 & 2033
- Table 61: Turkey Compostable Label Revenue (undefined) Forecast, by Application 2020 & 2033
- Table 62: Turkey Compostable Label Volume (K) Forecast, by Application 2020 & 2033
- Table 63: Israel Compostable Label Revenue (undefined) Forecast, by Application 2020 & 2033
- Table 64: Israel Compostable Label Volume (K) Forecast, by Application 2020 & 2033
- Table 65: GCC Compostable Label Revenue (undefined) Forecast, by Application 2020 & 2033
- Table 66: GCC Compostable Label Volume (K) Forecast, by Application 2020 & 2033
- Table 67: North Africa Compostable Label Revenue (undefined) Forecast, by Application 2020 & 2033
- Table 68: North Africa Compostable Label Volume (K) Forecast, by Application 2020 & 2033
- Table 69: South Africa Compostable Label Revenue (undefined) Forecast, by Application 2020 & 2033
- Table 70: South Africa Compostable Label Volume (K) Forecast, by Application 2020 & 2033
- Table 71: Rest of Middle East & Africa Compostable Label Revenue (undefined) Forecast, by Application 2020 & 2033
- Table 72: Rest of Middle East & Africa Compostable Label Volume (K) Forecast, by Application 2020 & 2033
- Table 73: Global Compostable Label Revenue undefined Forecast, by Application 2020 & 2033
- Table 74: Global Compostable Label Volume K Forecast, by Application 2020 & 2033
- Table 75: Global Compostable Label Revenue undefined Forecast, by Types 2020 & 2033
- Table 76: Global Compostable Label Volume K Forecast, by Types 2020 & 2033
- Table 77: Global Compostable Label Revenue undefined Forecast, by Country 2020 & 2033
- Table 78: Global Compostable Label Volume K Forecast, by Country 2020 & 2033
- Table 79: China Compostable Label Revenue (undefined) Forecast, by Application 2020 & 2033
- Table 80: China Compostable Label Volume (K) Forecast, by Application 2020 & 2033
- Table 81: India Compostable Label Revenue (undefined) Forecast, by Application 2020 & 2033
- Table 82: India Compostable Label Volume (K) Forecast, by Application 2020 & 2033
- Table 83: Japan Compostable Label Revenue (undefined) Forecast, by Application 2020 & 2033
- Table 84: Japan Compostable Label Volume (K) Forecast, by Application 2020 & 2033
- Table 85: South Korea Compostable Label Revenue (undefined) Forecast, by Application 2020 & 2033
- Table 86: South Korea Compostable Label Volume (K) Forecast, by Application 2020 & 2033
- Table 87: ASEAN Compostable Label Revenue (undefined) Forecast, by Application 2020 & 2033
- Table 88: ASEAN Compostable Label Volume (K) Forecast, by Application 2020 & 2033
- Table 89: Oceania Compostable Label Revenue (undefined) Forecast, by Application 2020 & 2033
- Table 90: Oceania Compostable Label Volume (K) Forecast, by Application 2020 & 2033
- Table 91: Rest of Asia Pacific Compostable Label Revenue (undefined) Forecast, by Application 2020 & 2033
- Table 92: Rest of Asia Pacific Compostable Label Volume (K) Forecast, by Application 2020 & 2033
Frequently Asked Questions
1. What is the projected Compound Annual Growth Rate (CAGR) of the Compostable Label?
The projected CAGR is approximately 4.3%.
2. Which companies are prominent players in the Compostable Label?
Key companies in the market include HERMA Labels, PURE Labels, inkREADible, Green Label, Optimum Group, A4Labels, Wedderburn, Labels Plus, Elevate Packaging, Xinxing Label, Avery Dennison, Huizhou Yito Packaging.
3. What are the main segments of the Compostable Label?
The market segments include Application, Types.
4. Can you provide details about the market size?
The market size is estimated to be USD XXX N/A as of 2022.
5. What are some drivers contributing to market growth?
N/A
6. What are the notable trends driving market growth?
N/A
7. Are there any restraints impacting market growth?
N/A
8. Can you provide examples of recent developments in the market?
N/A
9. What pricing options are available for accessing the report?
Pricing options include single-user, multi-user, and enterprise licenses priced at USD 3350.00, USD 5025.00, and USD 6700.00 respectively.
10. Is the market size provided in terms of value or volume?
The market size is provided in terms of value, measured in N/A and volume, measured in K.
11. Are there any specific market keywords associated with the report?
Yes, the market keyword associated with the report is "Compostable Label," which aids in identifying and referencing the specific market segment covered.
12. How do I determine which pricing option suits my needs best?
The pricing options vary based on user requirements and access needs. Individual users may opt for single-user licenses, while businesses requiring broader access may choose multi-user or enterprise licenses for cost-effective access to the report.
13. Are there any additional resources or data provided in the Compostable Label report?
While the report offers comprehensive insights, it's advisable to review the specific contents or supplementary materials provided to ascertain if additional resources or data are available.
14. How can I stay updated on further developments or reports in the Compostable Label?
To stay informed about further developments, trends, and reports in the Compostable Label, consider subscribing to industry newsletters, following relevant companies and organizations, or regularly checking reputable industry news sources and publications.
Methodology
Step 1 - Identification of Relevant Samples Size from Population Database


Step 2 - Approaches for Defining Global Market Size (Value, Volume* & Price*)

Note*: In applicable scenarios
Step 3 - Data Sources
Primary Research
- Web Analytics
- Survey Reports
- Research Institute
- Latest Research Reports
- Opinion Leaders
Secondary Research
- Annual Reports
- White Paper
- Latest Press Release
- Industry Association
- Paid Database
- Investor Presentations

Step 4 - Data Triangulation
Involves using different sources of information in order to increase the validity of a study
These sources are likely to be stakeholders in a program - participants, other researchers, program staff, other community members, and so on.
Then we put all data in single framework & apply various statistical tools to find out the dynamic on the market.
During the analysis stage, feedback from the stakeholder groups would be compared to determine areas of agreement as well as areas of divergence