

Key Insights
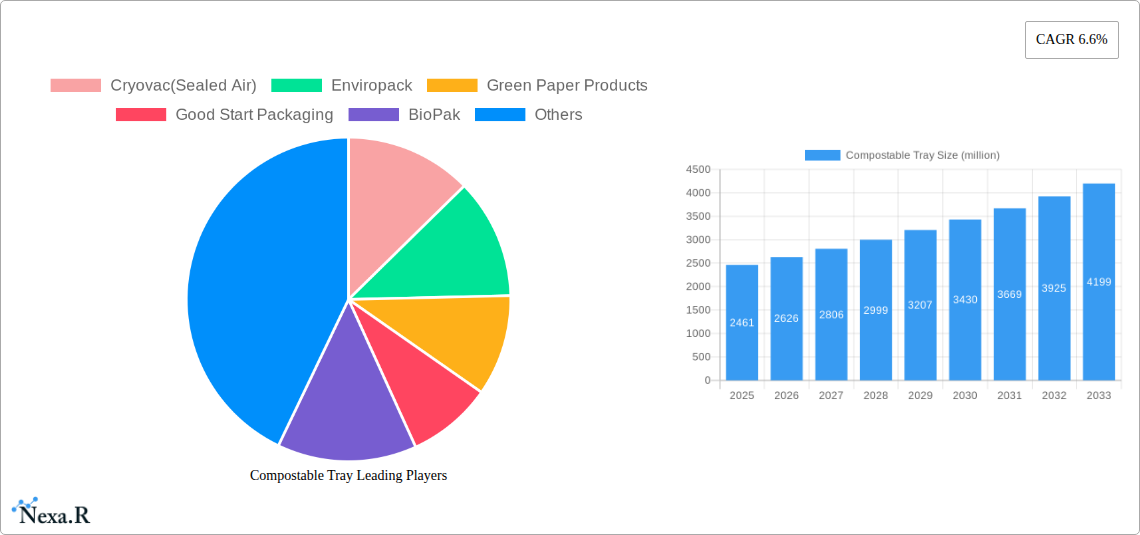
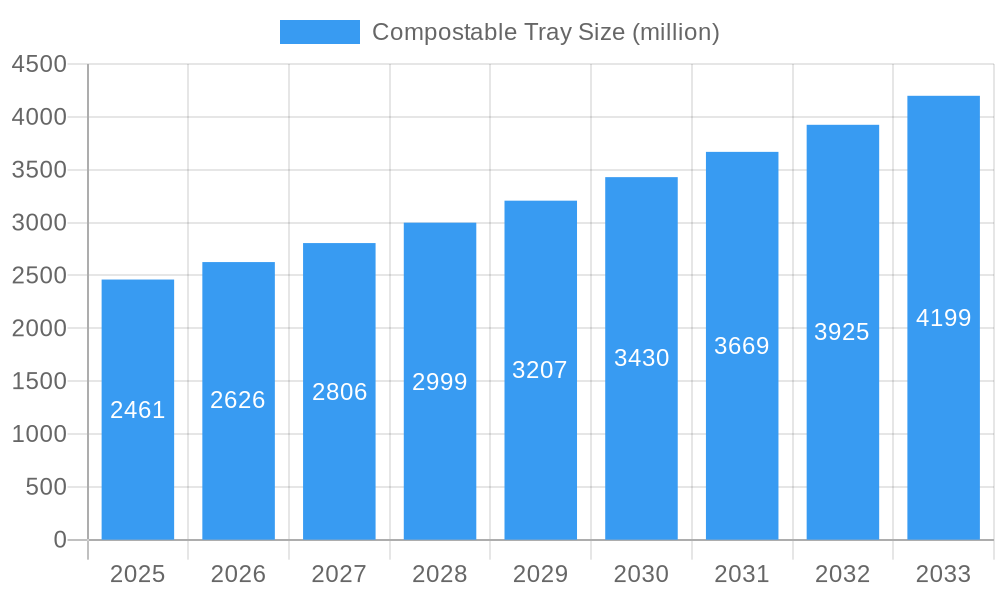
The compostable tray market, valued at $2461 million in 2025, is projected to experience robust growth, driven by the increasing consumer demand for eco-friendly packaging solutions and stringent government regulations aimed at reducing plastic waste. A Compound Annual Growth Rate (CAGR) of 6.6% from 2025 to 2033 indicates a significant expansion, reaching an estimated market value exceeding $4000 million by 2033. This growth is fueled by the rising awareness of environmental sustainability among consumers and businesses alike, leading to a preference for biodegradable and compostable alternatives to traditional plastic trays. Key players like Cryovac (Sealed Air), Enviropack, and BioPak are driving innovation in materials and design, offering a wider range of compostable tray options for various applications, from food packaging to industrial uses. The market segmentation, while not explicitly provided, likely includes variations based on material type (e.g., PLA, sugarcane bagasse), application (food service, retail, industrial), and size/design.
Compostable Tray Market Size (In Billion)
Despite the positive outlook, challenges remain. The relatively higher cost of compostable trays compared to conventional plastic alternatives could hinder widespread adoption, particularly among price-sensitive consumers and businesses. Furthermore, the infrastructure for efficient composting and recycling of these trays needs further development to ensure their full environmental benefits are realized. Overcoming these hurdles requires collaboration between manufacturers, retailers, and governments to promote the adoption of compostable trays and establish robust waste management systems. The market’s success will largely depend on the continued development of cost-effective production methods and improved access to composting facilities. The competitive landscape is dynamic, with established players and emerging companies vying for market share through product innovation and strategic partnerships.
Compostable Tray Company Market Share
Compostable Tray Market Report: 2019-2033
This comprehensive report provides a detailed analysis of the global compostable tray market, offering invaluable insights for industry professionals, investors, and stakeholders. Covering the period 2019-2033, with a base year of 2025, this report meticulously examines market dynamics, growth trends, key players, and future prospects. The report forecasts the market to reach xx million units by 2033, presenting a significant opportunity for growth within the broader sustainable packaging market.
Compostable Tray Market Dynamics & Structure
The global compostable tray market is characterized by a moderately fragmented landscape, with several key players competing for market share. Technological innovation, driven by advancements in bioplastics and compostable materials, is a primary growth driver. Stringent environmental regulations across various regions are further propelling market expansion. The market witnesses continuous innovation, leading to improved performance characteristics and increased adoption. However, higher production costs compared to conventional trays remain a significant barrier. Market concentration is relatively low, with no single dominant player holding a significant majority. Mergers and acquisitions (M&A) activity has been moderate, primarily focusing on expanding product portfolios and geographical reach.
- Market Concentration: Moderately Fragmented (HHI xx)
- Technological Innovation: Focus on bio-based polymers, improved compostability, and enhanced barrier properties.
- Regulatory Framework: Increasingly stringent regulations favoring compostable packaging in various regions.
- Competitive Substitutes: Traditional plastic trays, paperboard trays.
- End-User Demographics: Primarily food service, grocery, and retail sectors; increasing demand from e-commerce.
- M&A Trends: Moderate activity, with a focus on strategic acquisitions to enhance product lines and market penetration. xx M&A deals were recorded between 2019 and 2024.
Compostable Tray Growth Trends & Insights
The compostable tray market has experienced substantial growth over the historical period (2019-2024), driven by escalating consumer demand for eco-friendly packaging solutions and stricter environmental regulations. The market size witnessed a CAGR of xx% during 2019-2024, reaching xx million units in 2024. Technological disruptions, including the development of innovative bio-based materials and improved manufacturing processes, have significantly impacted market growth. A shift in consumer behavior towards sustainable consumption patterns has fueled demand for compostable trays, resulting in increased market penetration in various segments. The forecast period (2025-2033) projects continued expansion, with a projected CAGR of xx%, driven by rising consumer awareness and government initiatives promoting sustainable packaging. This growth is expected to be further accelerated by the increasing demand for food delivery and takeaway services.
Dominant Regions, Countries, or Segments in Compostable Tray
North America and Europe currently dominate the compostable tray market, driven by strong consumer awareness of environmental sustainability and the presence of established regulatory frameworks supporting compostable packaging. Stringent environmental policies in these regions, coupled with high consumer disposable income, have resulted in higher adoption rates. Asia-Pacific is anticipated to experience the highest growth rate in the forecast period due to increasing urbanization, rising disposable income, and a growing focus on sustainable practices.
- North America: High adoption rates driven by stringent regulations and strong consumer preference for sustainable packaging. Market share: xx%
- Europe: Significant market size driven by environmentally conscious consumers and supportive government policies. Market share: xx%
- Asia-Pacific: Highest growth potential fueled by rising disposable income and increasing awareness of environmental issues. Market share: xx%
- Key Drivers: Stringent environmental regulations, rising consumer awareness, and increasing demand from the food service industry.
Compostable Tray Product Landscape
Compostable trays are available in a variety of materials, including PLA (polylactic acid), sugarcane bagasse, and other bio-based polymers. These trays offer varying levels of durability, barrier properties, and compostability. Recent innovations focus on enhancing barrier properties to extend shelf life and reduce food waste. The development of trays with improved heat resistance for hot food applications is also a notable advancement. Unique selling propositions include enhanced biodegradability, compostability in home composting systems, and reduced environmental impact compared to traditional plastic trays.
Key Drivers, Barriers & Challenges in Compostable Tray
Key Drivers:
- Growing consumer demand for sustainable and eco-friendly packaging
- Increasing stringent environmental regulations globally
- Rising demand for takeaway and delivery services
- Advancements in bio-based material technology
Challenges & Restraints:
- Higher production costs compared to conventional plastic trays
- Limited availability of efficient industrial composting infrastructure in some regions
- Concerns about the compostability and biodegradability of some materials
- Competition from alternative packaging solutions
Emerging Opportunities in Compostable Tray
Emerging opportunities lie in expanding into untapped markets, particularly in developing economies, and developing compostable trays for specialized applications, such as ready-to-eat meals and frozen food. Customization options, such as printing and branding, further open avenues for market penetration. The increasing demand for eco-friendly solutions within the e-commerce sector also presents significant opportunities for growth.
Growth Accelerators in the Compostable Tray Industry
Technological advancements in bioplastics and compostable materials are key growth accelerators. Strategic partnerships between packaging manufacturers and food producers are also accelerating market adoption. Government initiatives promoting sustainable packaging, along with consumer awareness campaigns, will further propel market expansion. The development of innovative compostable materials with improved barrier properties and heat resistance will enhance their applicability across diverse food applications.
Key Players Shaping the Compostable Tray Market
- Cryovac (Sealed Air)
- Enviropack
- Green Paper Products
- Good Start Packaging
- BioPak
- BIOPAP
- Ecoocel
- Cima-pak
- COPAR
- Pure Option
- Enduro
- YUTOECO
Notable Milestones in Compostable Tray Sector
- 2021: Introduction of a new PLA-based compostable tray with enhanced heat resistance by BioPak.
- 2022: Partnership between a major food producer and a compostable tray manufacturer to launch a sustainable packaging line.
- 2023: Implementation of stricter regulations on single-use plastics in several European countries, stimulating demand for compostable alternatives.
In-Depth Compostable Tray Market Outlook
The compostable tray market is poised for significant growth over the forecast period (2025-2033), driven by a confluence of factors including strong consumer demand for environmentally friendly packaging, supportive government policies, and technological advancements. Strategic investments in research and development of innovative bio-based materials will further enhance the market's prospects. Expanding into new geographic regions and developing innovative product applications will unlock substantial growth opportunities. The market presents a compelling investment opportunity for businesses seeking to capitalize on the growing demand for sustainable packaging solutions.
Compostable Tray Segmentation
-
1. Application
- 1.1. Restaurants
- 1.2. Retail
- 1.3. Hotel
- 1.4. Others
-
2. Type
- 2.1. Bagasse Trays
- 2.2. Cardboard Trays
- 2.3. Others
Compostable Tray Segmentation By Geography
-
1. North America
- 1.1. United States
- 1.2. Canada
- 1.3. Mexico
-
2. South America
- 2.1. Brazil
- 2.2. Argentina
- 2.3. Rest of South America
-
3. Europe
- 3.1. United Kingdom
- 3.2. Germany
- 3.3. France
- 3.4. Italy
- 3.5. Spain
- 3.6. Russia
- 3.7. Benelux
- 3.8. Nordics
- 3.9. Rest of Europe
-
4. Middle East & Africa
- 4.1. Turkey
- 4.2. Israel
- 4.3. GCC
- 4.4. North Africa
- 4.5. South Africa
- 4.6. Rest of Middle East & Africa
-
5. Asia Pacific
- 5.1. China
- 5.2. India
- 5.3. Japan
- 5.4. South Korea
- 5.5. ASEAN
- 5.6. Oceania
- 5.7. Rest of Asia Pacific

Compostable Tray Regional Market Share
Geographic Coverage of Compostable Tray
Compostable Tray REPORT HIGHLIGHTS
| Aspects | Details |
|---|---|
| Study Period | 2020-2034 |
| Base Year | 2025 |
| Estimated Year | 2026 |
| Forecast Period | 2026-2034 |
| Historical Period | 2020-2025 |
| Growth Rate | CAGR of 6.6% from 2020-2034 |
| Segmentation |
|
Table of Contents
- 1. Introduction
- 1.1. Research Scope
- 1.2. Market Segmentation
- 1.3. Research Methodology
- 1.4. Definitions and Assumptions
- 2. Executive Summary
- 2.1. Introduction
- 3. Market Dynamics
- 3.1. Introduction
- 3.2. Market Drivers
- 3.3. Market Restrains
- 3.4. Market Trends
- 4. Market Factor Analysis
- 4.1. Porters Five Forces
- 4.2. Supply/Value Chain
- 4.3. PESTEL analysis
- 4.4. Market Entropy
- 4.5. Patent/Trademark Analysis
- 5. Global Compostable Tray Analysis, Insights and Forecast, 2020-2032
- 5.1. Market Analysis, Insights and Forecast - by Application
- 5.1.1. Restaurants
- 5.1.2. Retail
- 5.1.3. Hotel
- 5.1.4. Others
- 5.2. Market Analysis, Insights and Forecast - by Type
- 5.2.1. Bagasse Trays
- 5.2.2. Cardboard Trays
- 5.2.3. Others
- 5.3. Market Analysis, Insights and Forecast - by Region
- 5.3.1. North America
- 5.3.2. South America
- 5.3.3. Europe
- 5.3.4. Middle East & Africa
- 5.3.5. Asia Pacific
- 5.1. Market Analysis, Insights and Forecast - by Application
- 6. North America Compostable Tray Analysis, Insights and Forecast, 2020-2032
- 6.1. Market Analysis, Insights and Forecast - by Application
- 6.1.1. Restaurants
- 6.1.2. Retail
- 6.1.3. Hotel
- 6.1.4. Others
- 6.2. Market Analysis, Insights and Forecast - by Type
- 6.2.1. Bagasse Trays
- 6.2.2. Cardboard Trays
- 6.2.3. Others
- 6.1. Market Analysis, Insights and Forecast - by Application
- 7. South America Compostable Tray Analysis, Insights and Forecast, 2020-2032
- 7.1. Market Analysis, Insights and Forecast - by Application
- 7.1.1. Restaurants
- 7.1.2. Retail
- 7.1.3. Hotel
- 7.1.4. Others
- 7.2. Market Analysis, Insights and Forecast - by Type
- 7.2.1. Bagasse Trays
- 7.2.2. Cardboard Trays
- 7.2.3. Others
- 7.1. Market Analysis, Insights and Forecast - by Application
- 8. Europe Compostable Tray Analysis, Insights and Forecast, 2020-2032
- 8.1. Market Analysis, Insights and Forecast - by Application
- 8.1.1. Restaurants
- 8.1.2. Retail
- 8.1.3. Hotel
- 8.1.4. Others
- 8.2. Market Analysis, Insights and Forecast - by Type
- 8.2.1. Bagasse Trays
- 8.2.2. Cardboard Trays
- 8.2.3. Others
- 8.1. Market Analysis, Insights and Forecast - by Application
- 9. Middle East & Africa Compostable Tray Analysis, Insights and Forecast, 2020-2032
- 9.1. Market Analysis, Insights and Forecast - by Application
- 9.1.1. Restaurants
- 9.1.2. Retail
- 9.1.3. Hotel
- 9.1.4. Others
- 9.2. Market Analysis, Insights and Forecast - by Type
- 9.2.1. Bagasse Trays
- 9.2.2. Cardboard Trays
- 9.2.3. Others
- 9.1. Market Analysis, Insights and Forecast - by Application
- 10. Asia Pacific Compostable Tray Analysis, Insights and Forecast, 2020-2032
- 10.1. Market Analysis, Insights and Forecast - by Application
- 10.1.1. Restaurants
- 10.1.2. Retail
- 10.1.3. Hotel
- 10.1.4. Others
- 10.2. Market Analysis, Insights and Forecast - by Type
- 10.2.1. Bagasse Trays
- 10.2.2. Cardboard Trays
- 10.2.3. Others
- 10.1. Market Analysis, Insights and Forecast - by Application
- 11. Competitive Analysis
- 11.1. Global Market Share Analysis 2025
- 11.2. Company Profiles
- 11.2.1 Cryovac(Sealed Air)
- 11.2.1.1. Overview
- 11.2.1.2. Products
- 11.2.1.3. SWOT Analysis
- 11.2.1.4. Recent Developments
- 11.2.1.5. Financials (Based on Availability)
- 11.2.2 Enviropack
- 11.2.2.1. Overview
- 11.2.2.2. Products
- 11.2.2.3. SWOT Analysis
- 11.2.2.4. Recent Developments
- 11.2.2.5. Financials (Based on Availability)
- 11.2.3 Green Paper Products
- 11.2.3.1. Overview
- 11.2.3.2. Products
- 11.2.3.3. SWOT Analysis
- 11.2.3.4. Recent Developments
- 11.2.3.5. Financials (Based on Availability)
- 11.2.4 Good Start Packaging
- 11.2.4.1. Overview
- 11.2.4.2. Products
- 11.2.4.3. SWOT Analysis
- 11.2.4.4. Recent Developments
- 11.2.4.5. Financials (Based on Availability)
- 11.2.5 BioPak
- 11.2.5.1. Overview
- 11.2.5.2. Products
- 11.2.5.3. SWOT Analysis
- 11.2.5.4. Recent Developments
- 11.2.5.5. Financials (Based on Availability)
- 11.2.6 BIOPAP
- 11.2.6.1. Overview
- 11.2.6.2. Products
- 11.2.6.3. SWOT Analysis
- 11.2.6.4. Recent Developments
- 11.2.6.5. Financials (Based on Availability)
- 11.2.7 Ecoocel
- 11.2.7.1. Overview
- 11.2.7.2. Products
- 11.2.7.3. SWOT Analysis
- 11.2.7.4. Recent Developments
- 11.2.7.5. Financials (Based on Availability)
- 11.2.8 Cima-pak
- 11.2.8.1. Overview
- 11.2.8.2. Products
- 11.2.8.3. SWOT Analysis
- 11.2.8.4. Recent Developments
- 11.2.8.5. Financials (Based on Availability)
- 11.2.9 COPAR
- 11.2.9.1. Overview
- 11.2.9.2. Products
- 11.2.9.3. SWOT Analysis
- 11.2.9.4. Recent Developments
- 11.2.9.5. Financials (Based on Availability)
- 11.2.10 Pure Option
- 11.2.10.1. Overview
- 11.2.10.2. Products
- 11.2.10.3. SWOT Analysis
- 11.2.10.4. Recent Developments
- 11.2.10.5. Financials (Based on Availability)
- 11.2.11 Enduro
- 11.2.11.1. Overview
- 11.2.11.2. Products
- 11.2.11.3. SWOT Analysis
- 11.2.11.4. Recent Developments
- 11.2.11.5. Financials (Based on Availability)
- 11.2.12 YUTOECO
- 11.2.12.1. Overview
- 11.2.12.2. Products
- 11.2.12.3. SWOT Analysis
- 11.2.12.4. Recent Developments
- 11.2.12.5. Financials (Based on Availability)
- 11.2.1 Cryovac(Sealed Air)
List of Figures
- Figure 1: Global Compostable Tray Revenue Breakdown (million, %) by Region 2025 & 2033
- Figure 2: Global Compostable Tray Volume Breakdown (K, %) by Region 2025 & 2033
- Figure 3: North America Compostable Tray Revenue (million), by Application 2025 & 2033
- Figure 4: North America Compostable Tray Volume (K), by Application 2025 & 2033
- Figure 5: North America Compostable Tray Revenue Share (%), by Application 2025 & 2033
- Figure 6: North America Compostable Tray Volume Share (%), by Application 2025 & 2033
- Figure 7: North America Compostable Tray Revenue (million), by Type 2025 & 2033
- Figure 8: North America Compostable Tray Volume (K), by Type 2025 & 2033
- Figure 9: North America Compostable Tray Revenue Share (%), by Type 2025 & 2033
- Figure 10: North America Compostable Tray Volume Share (%), by Type 2025 & 2033
- Figure 11: North America Compostable Tray Revenue (million), by Country 2025 & 2033
- Figure 12: North America Compostable Tray Volume (K), by Country 2025 & 2033
- Figure 13: North America Compostable Tray Revenue Share (%), by Country 2025 & 2033
- Figure 14: North America Compostable Tray Volume Share (%), by Country 2025 & 2033
- Figure 15: South America Compostable Tray Revenue (million), by Application 2025 & 2033
- Figure 16: South America Compostable Tray Volume (K), by Application 2025 & 2033
- Figure 17: South America Compostable Tray Revenue Share (%), by Application 2025 & 2033
- Figure 18: South America Compostable Tray Volume Share (%), by Application 2025 & 2033
- Figure 19: South America Compostable Tray Revenue (million), by Type 2025 & 2033
- Figure 20: South America Compostable Tray Volume (K), by Type 2025 & 2033
- Figure 21: South America Compostable Tray Revenue Share (%), by Type 2025 & 2033
- Figure 22: South America Compostable Tray Volume Share (%), by Type 2025 & 2033
- Figure 23: South America Compostable Tray Revenue (million), by Country 2025 & 2033
- Figure 24: South America Compostable Tray Volume (K), by Country 2025 & 2033
- Figure 25: South America Compostable Tray Revenue Share (%), by Country 2025 & 2033
- Figure 26: South America Compostable Tray Volume Share (%), by Country 2025 & 2033
- Figure 27: Europe Compostable Tray Revenue (million), by Application 2025 & 2033
- Figure 28: Europe Compostable Tray Volume (K), by Application 2025 & 2033
- Figure 29: Europe Compostable Tray Revenue Share (%), by Application 2025 & 2033
- Figure 30: Europe Compostable Tray Volume Share (%), by Application 2025 & 2033
- Figure 31: Europe Compostable Tray Revenue (million), by Type 2025 & 2033
- Figure 32: Europe Compostable Tray Volume (K), by Type 2025 & 2033
- Figure 33: Europe Compostable Tray Revenue Share (%), by Type 2025 & 2033
- Figure 34: Europe Compostable Tray Volume Share (%), by Type 2025 & 2033
- Figure 35: Europe Compostable Tray Revenue (million), by Country 2025 & 2033
- Figure 36: Europe Compostable Tray Volume (K), by Country 2025 & 2033
- Figure 37: Europe Compostable Tray Revenue Share (%), by Country 2025 & 2033
- Figure 38: Europe Compostable Tray Volume Share (%), by Country 2025 & 2033
- Figure 39: Middle East & Africa Compostable Tray Revenue (million), by Application 2025 & 2033
- Figure 40: Middle East & Africa Compostable Tray Volume (K), by Application 2025 & 2033
- Figure 41: Middle East & Africa Compostable Tray Revenue Share (%), by Application 2025 & 2033
- Figure 42: Middle East & Africa Compostable Tray Volume Share (%), by Application 2025 & 2033
- Figure 43: Middle East & Africa Compostable Tray Revenue (million), by Type 2025 & 2033
- Figure 44: Middle East & Africa Compostable Tray Volume (K), by Type 2025 & 2033
- Figure 45: Middle East & Africa Compostable Tray Revenue Share (%), by Type 2025 & 2033
- Figure 46: Middle East & Africa Compostable Tray Volume Share (%), by Type 2025 & 2033
- Figure 47: Middle East & Africa Compostable Tray Revenue (million), by Country 2025 & 2033
- Figure 48: Middle East & Africa Compostable Tray Volume (K), by Country 2025 & 2033
- Figure 49: Middle East & Africa Compostable Tray Revenue Share (%), by Country 2025 & 2033
- Figure 50: Middle East & Africa Compostable Tray Volume Share (%), by Country 2025 & 2033
- Figure 51: Asia Pacific Compostable Tray Revenue (million), by Application 2025 & 2033
- Figure 52: Asia Pacific Compostable Tray Volume (K), by Application 2025 & 2033
- Figure 53: Asia Pacific Compostable Tray Revenue Share (%), by Application 2025 & 2033
- Figure 54: Asia Pacific Compostable Tray Volume Share (%), by Application 2025 & 2033
- Figure 55: Asia Pacific Compostable Tray Revenue (million), by Type 2025 & 2033
- Figure 56: Asia Pacific Compostable Tray Volume (K), by Type 2025 & 2033
- Figure 57: Asia Pacific Compostable Tray Revenue Share (%), by Type 2025 & 2033
- Figure 58: Asia Pacific Compostable Tray Volume Share (%), by Type 2025 & 2033
- Figure 59: Asia Pacific Compostable Tray Revenue (million), by Country 2025 & 2033
- Figure 60: Asia Pacific Compostable Tray Volume (K), by Country 2025 & 2033
- Figure 61: Asia Pacific Compostable Tray Revenue Share (%), by Country 2025 & 2033
- Figure 62: Asia Pacific Compostable Tray Volume Share (%), by Country 2025 & 2033
List of Tables
- Table 1: Global Compostable Tray Revenue million Forecast, by Application 2020 & 2033
- Table 2: Global Compostable Tray Volume K Forecast, by Application 2020 & 2033
- Table 3: Global Compostable Tray Revenue million Forecast, by Type 2020 & 2033
- Table 4: Global Compostable Tray Volume K Forecast, by Type 2020 & 2033
- Table 5: Global Compostable Tray Revenue million Forecast, by Region 2020 & 2033
- Table 6: Global Compostable Tray Volume K Forecast, by Region 2020 & 2033
- Table 7: Global Compostable Tray Revenue million Forecast, by Application 2020 & 2033
- Table 8: Global Compostable Tray Volume K Forecast, by Application 2020 & 2033
- Table 9: Global Compostable Tray Revenue million Forecast, by Type 2020 & 2033
- Table 10: Global Compostable Tray Volume K Forecast, by Type 2020 & 2033
- Table 11: Global Compostable Tray Revenue million Forecast, by Country 2020 & 2033
- Table 12: Global Compostable Tray Volume K Forecast, by Country 2020 & 2033
- Table 13: United States Compostable Tray Revenue (million) Forecast, by Application 2020 & 2033
- Table 14: United States Compostable Tray Volume (K) Forecast, by Application 2020 & 2033
- Table 15: Canada Compostable Tray Revenue (million) Forecast, by Application 2020 & 2033
- Table 16: Canada Compostable Tray Volume (K) Forecast, by Application 2020 & 2033
- Table 17: Mexico Compostable Tray Revenue (million) Forecast, by Application 2020 & 2033
- Table 18: Mexico Compostable Tray Volume (K) Forecast, by Application 2020 & 2033
- Table 19: Global Compostable Tray Revenue million Forecast, by Application 2020 & 2033
- Table 20: Global Compostable Tray Volume K Forecast, by Application 2020 & 2033
- Table 21: Global Compostable Tray Revenue million Forecast, by Type 2020 & 2033
- Table 22: Global Compostable Tray Volume K Forecast, by Type 2020 & 2033
- Table 23: Global Compostable Tray Revenue million Forecast, by Country 2020 & 2033
- Table 24: Global Compostable Tray Volume K Forecast, by Country 2020 & 2033
- Table 25: Brazil Compostable Tray Revenue (million) Forecast, by Application 2020 & 2033
- Table 26: Brazil Compostable Tray Volume (K) Forecast, by Application 2020 & 2033
- Table 27: Argentina Compostable Tray Revenue (million) Forecast, by Application 2020 & 2033
- Table 28: Argentina Compostable Tray Volume (K) Forecast, by Application 2020 & 2033
- Table 29: Rest of South America Compostable Tray Revenue (million) Forecast, by Application 2020 & 2033
- Table 30: Rest of South America Compostable Tray Volume (K) Forecast, by Application 2020 & 2033
- Table 31: Global Compostable Tray Revenue million Forecast, by Application 2020 & 2033
- Table 32: Global Compostable Tray Volume K Forecast, by Application 2020 & 2033
- Table 33: Global Compostable Tray Revenue million Forecast, by Type 2020 & 2033
- Table 34: Global Compostable Tray Volume K Forecast, by Type 2020 & 2033
- Table 35: Global Compostable Tray Revenue million Forecast, by Country 2020 & 2033
- Table 36: Global Compostable Tray Volume K Forecast, by Country 2020 & 2033
- Table 37: United Kingdom Compostable Tray Revenue (million) Forecast, by Application 2020 & 2033
- Table 38: United Kingdom Compostable Tray Volume (K) Forecast, by Application 2020 & 2033
- Table 39: Germany Compostable Tray Revenue (million) Forecast, by Application 2020 & 2033
- Table 40: Germany Compostable Tray Volume (K) Forecast, by Application 2020 & 2033
- Table 41: France Compostable Tray Revenue (million) Forecast, by Application 2020 & 2033
- Table 42: France Compostable Tray Volume (K) Forecast, by Application 2020 & 2033
- Table 43: Italy Compostable Tray Revenue (million) Forecast, by Application 2020 & 2033
- Table 44: Italy Compostable Tray Volume (K) Forecast, by Application 2020 & 2033
- Table 45: Spain Compostable Tray Revenue (million) Forecast, by Application 2020 & 2033
- Table 46: Spain Compostable Tray Volume (K) Forecast, by Application 2020 & 2033
- Table 47: Russia Compostable Tray Revenue (million) Forecast, by Application 2020 & 2033
- Table 48: Russia Compostable Tray Volume (K) Forecast, by Application 2020 & 2033
- Table 49: Benelux Compostable Tray Revenue (million) Forecast, by Application 2020 & 2033
- Table 50: Benelux Compostable Tray Volume (K) Forecast, by Application 2020 & 2033
- Table 51: Nordics Compostable Tray Revenue (million) Forecast, by Application 2020 & 2033
- Table 52: Nordics Compostable Tray Volume (K) Forecast, by Application 2020 & 2033
- Table 53: Rest of Europe Compostable Tray Revenue (million) Forecast, by Application 2020 & 2033
- Table 54: Rest of Europe Compostable Tray Volume (K) Forecast, by Application 2020 & 2033
- Table 55: Global Compostable Tray Revenue million Forecast, by Application 2020 & 2033
- Table 56: Global Compostable Tray Volume K Forecast, by Application 2020 & 2033
- Table 57: Global Compostable Tray Revenue million Forecast, by Type 2020 & 2033
- Table 58: Global Compostable Tray Volume K Forecast, by Type 2020 & 2033
- Table 59: Global Compostable Tray Revenue million Forecast, by Country 2020 & 2033
- Table 60: Global Compostable Tray Volume K Forecast, by Country 2020 & 2033
- Table 61: Turkey Compostable Tray Revenue (million) Forecast, by Application 2020 & 2033
- Table 62: Turkey Compostable Tray Volume (K) Forecast, by Application 2020 & 2033
- Table 63: Israel Compostable Tray Revenue (million) Forecast, by Application 2020 & 2033
- Table 64: Israel Compostable Tray Volume (K) Forecast, by Application 2020 & 2033
- Table 65: GCC Compostable Tray Revenue (million) Forecast, by Application 2020 & 2033
- Table 66: GCC Compostable Tray Volume (K) Forecast, by Application 2020 & 2033
- Table 67: North Africa Compostable Tray Revenue (million) Forecast, by Application 2020 & 2033
- Table 68: North Africa Compostable Tray Volume (K) Forecast, by Application 2020 & 2033
- Table 69: South Africa Compostable Tray Revenue (million) Forecast, by Application 2020 & 2033
- Table 70: South Africa Compostable Tray Volume (K) Forecast, by Application 2020 & 2033
- Table 71: Rest of Middle East & Africa Compostable Tray Revenue (million) Forecast, by Application 2020 & 2033
- Table 72: Rest of Middle East & Africa Compostable Tray Volume (K) Forecast, by Application 2020 & 2033
- Table 73: Global Compostable Tray Revenue million Forecast, by Application 2020 & 2033
- Table 74: Global Compostable Tray Volume K Forecast, by Application 2020 & 2033
- Table 75: Global Compostable Tray Revenue million Forecast, by Type 2020 & 2033
- Table 76: Global Compostable Tray Volume K Forecast, by Type 2020 & 2033
- Table 77: Global Compostable Tray Revenue million Forecast, by Country 2020 & 2033
- Table 78: Global Compostable Tray Volume K Forecast, by Country 2020 & 2033
- Table 79: China Compostable Tray Revenue (million) Forecast, by Application 2020 & 2033
- Table 80: China Compostable Tray Volume (K) Forecast, by Application 2020 & 2033
- Table 81: India Compostable Tray Revenue (million) Forecast, by Application 2020 & 2033
- Table 82: India Compostable Tray Volume (K) Forecast, by Application 2020 & 2033
- Table 83: Japan Compostable Tray Revenue (million) Forecast, by Application 2020 & 2033
- Table 84: Japan Compostable Tray Volume (K) Forecast, by Application 2020 & 2033
- Table 85: South Korea Compostable Tray Revenue (million) Forecast, by Application 2020 & 2033
- Table 86: South Korea Compostable Tray Volume (K) Forecast, by Application 2020 & 2033
- Table 87: ASEAN Compostable Tray Revenue (million) Forecast, by Application 2020 & 2033
- Table 88: ASEAN Compostable Tray Volume (K) Forecast, by Application 2020 & 2033
- Table 89: Oceania Compostable Tray Revenue (million) Forecast, by Application 2020 & 2033
- Table 90: Oceania Compostable Tray Volume (K) Forecast, by Application 2020 & 2033
- Table 91: Rest of Asia Pacific Compostable Tray Revenue (million) Forecast, by Application 2020 & 2033
- Table 92: Rest of Asia Pacific Compostable Tray Volume (K) Forecast, by Application 2020 & 2033
Frequently Asked Questions
1. What is the projected Compound Annual Growth Rate (CAGR) of the Compostable Tray?
The projected CAGR is approximately 6.6%.
2. Which companies are prominent players in the Compostable Tray?
Key companies in the market include Cryovac(Sealed Air), Enviropack, Green Paper Products, Good Start Packaging, BioPak, BIOPAP, Ecoocel, Cima-pak, COPAR, Pure Option, Enduro, YUTOECO.
3. What are the main segments of the Compostable Tray?
The market segments include Application, Type.
4. Can you provide details about the market size?
The market size is estimated to be USD 2461 million as of 2022.
5. What are some drivers contributing to market growth?
N/A
6. What are the notable trends driving market growth?
N/A
7. Are there any restraints impacting market growth?
N/A
8. Can you provide examples of recent developments in the market?
N/A
9. What pricing options are available for accessing the report?
Pricing options include single-user, multi-user, and enterprise licenses priced at USD 3950.00, USD 5925.00, and USD 7900.00 respectively.
10. Is the market size provided in terms of value or volume?
The market size is provided in terms of value, measured in million and volume, measured in K.
11. Are there any specific market keywords associated with the report?
Yes, the market keyword associated with the report is "Compostable Tray," which aids in identifying and referencing the specific market segment covered.
12. How do I determine which pricing option suits my needs best?
The pricing options vary based on user requirements and access needs. Individual users may opt for single-user licenses, while businesses requiring broader access may choose multi-user or enterprise licenses for cost-effective access to the report.
13. Are there any additional resources or data provided in the Compostable Tray report?
While the report offers comprehensive insights, it's advisable to review the specific contents or supplementary materials provided to ascertain if additional resources or data are available.
14. How can I stay updated on further developments or reports in the Compostable Tray?
To stay informed about further developments, trends, and reports in the Compostable Tray, consider subscribing to industry newsletters, following relevant companies and organizations, or regularly checking reputable industry news sources and publications.
Methodology
Step 1 - Identification of Relevant Samples Size from Population Database


Step 2 - Approaches for Defining Global Market Size (Value, Volume* & Price*)

Note*: In applicable scenarios
Step 3 - Data Sources
Primary Research
- Web Analytics
- Survey Reports
- Research Institute
- Latest Research Reports
- Opinion Leaders
Secondary Research
- Annual Reports
- White Paper
- Latest Press Release
- Industry Association
- Paid Database
- Investor Presentations

Step 4 - Data Triangulation
Involves using different sources of information in order to increase the validity of a study
These sources are likely to be stakeholders in a program - participants, other researchers, program staff, other community members, and so on.
Then we put all data in single framework & apply various statistical tools to find out the dynamic on the market.
During the analysis stage, feedback from the stakeholder groups would be compared to determine areas of agreement as well as areas of divergence