

Key Insights
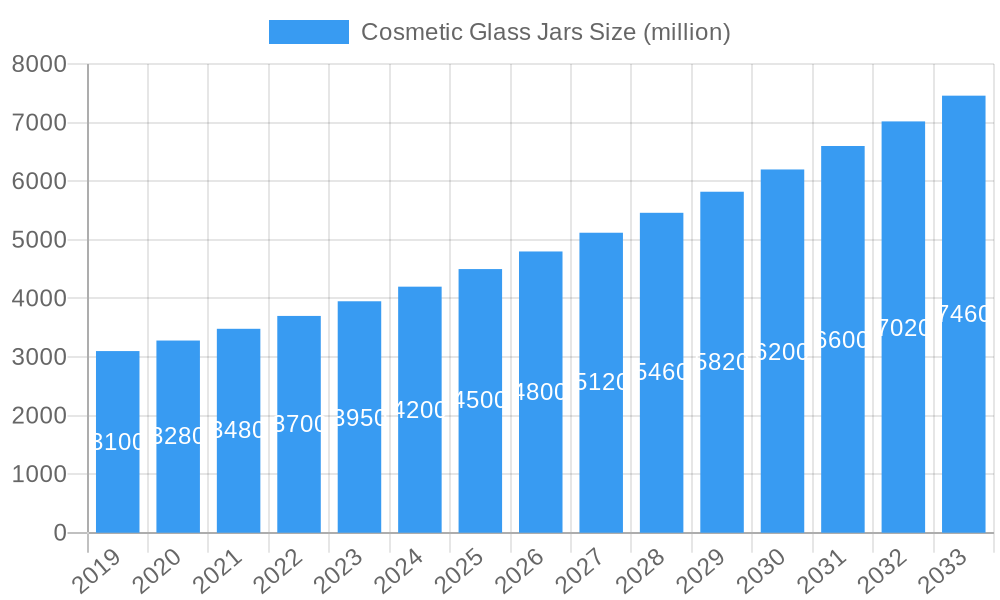
The global Cosmetic Glass Jars market is projected to reach $8.12 billion by 2025, exhibiting a Compound Annual Growth Rate (CAGR) of 2.98% through 2033. Growth is driven by increasing demand for premium skincare, sustainable packaging preferences, and glass's aesthetic and product integrity benefits. Key factors include e-commerce growth necessitating secure and appealing packaging, and rising consumer interest in natural/organic ingredients often packaged in glass. Innovations in lightweight glass and advanced finishes are also catering to evolving brand and consumer desires for luxury and eco-conscious options.
Cosmetic Glass Jars Market Size (In Billion)
Market segmentation indicates the "Over 150ml" category will lead in value, while the "0-50 ml" segment is expected to experience significant volume growth due to trial-size, luxury samples, and travel-friendly formulations. While glass production costs and fragility present challenges, advancements in manufacturing and the premium, environmental perception of glass are mitigating these factors. Geographically, the Asia Pacific region is a key growth driver due to rising disposable incomes and expanding beauty industries in China and India. North America and Europe remain mature, stable markets fueled by established luxury brands and a strong consumer base.
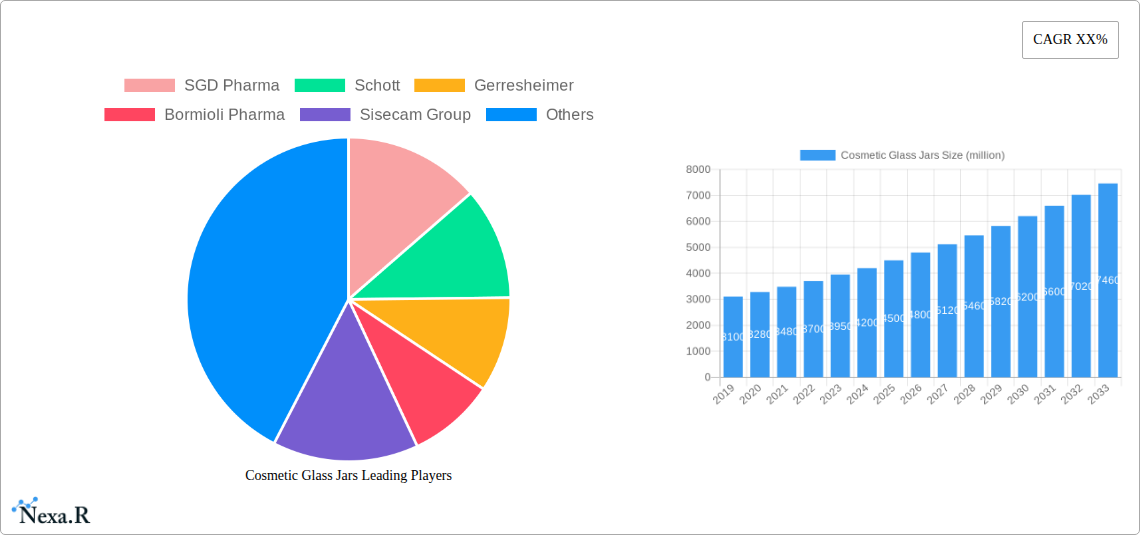
Cosmetic Glass Jars Company Market Share
This report provides a detailed analysis of the Cosmetic Glass Jars market, offering critical insights for stakeholders. The study covers the historical period 2019-2024, a base year of 2025, and a forecast period of 2025-2033. Analysis includes market dynamics, growth trends, regional performance, product innovations, key drivers, opportunities, and the competitive landscape, supported by extensive quantitative data and expert qualitative assessments.
Cosmetic Glass Jars Market Dynamics & Structure
The global Cosmetic Glass Jars market exhibits a moderately consolidated structure, with a few leading players holding significant market share. Technological innovation is a primary driver, with advancements in glass manufacturing, design, and sustainable practices shaping product offerings. Regulatory frameworks, particularly concerning material safety and environmental impact, are increasingly influencing production and packaging choices. The threat of competitive product substitutes, such as plastic and aluminum, remains, but the inherent premium appeal and recyclability of glass continue to favor its adoption in high-value cosmetic segments. End-user demographics, characterized by a growing demand for premium and eco-conscious beauty products, are steering market preferences towards aesthetically pleasing and sustainable glass packaging. Mergers and acquisitions (M&A) activity, while not excessively high, plays a role in market consolidation and expansion, with X M&A deals recorded in the historical period, aiming to acquire new technologies or expand geographical reach. Key innovation barriers include the capital-intensive nature of advanced glass production and the need for specialized tooling for intricate designs.
- Market Concentration: Moderately consolidated with a presence of both global leaders and regional specialists.
- Technological Innovation: Driven by enhanced barrier properties, lightweighting techniques, and sustainable coating options.
- Regulatory Frameworks: Focus on material traceability, recyclability standards, and reduced carbon footprint in manufacturing.
- Competitive Substitutes: Primarily high-barrier plastics and premium metal packaging.
- End-User Demographics: Increasing preference for luxury, eco-friendly, and aesthetically superior packaging.
- M&A Trends: Strategic acquisitions for technology integration and market access, with an estimated Y deals in the forecast period.
Cosmetic Glass Jars Growth Trends & Insights
The global Cosmetic Glass Jars market is projected to witness robust growth driven by escalating consumer demand for premium beauty and personal care products, coupled with a growing preference for sustainable and recyclable packaging solutions. The market size is estimated to have reached $XX billion in 2024 and is anticipated to expand at a Compound Annual Growth Rate (CAGR) of XX% during the forecast period of 2025–2033, reaching an estimated $YY billion by 2033. Adoption rates for glass jars in the skincare and perfume segments are particularly high, reflecting their perceived value and inertness. Technological disruptions, such as the development of thinner yet stronger glass formulations and advanced decorative techniques, are further enhancing the appeal and functionality of cosmetic glass jars. Consumer behavior shifts towards conscious consumption and a desire for products that align with ethical and environmental values are significantly influencing purchasing decisions, favoring glass packaging for its perceived naturalness and luxury. The penetration of glass jars in emerging economies is also on an upward trajectory, fueled by increasing disposable incomes and a burgeoning beauty industry.
Dominant Regions, Countries, or Segments in Cosmetic Glass Jars
The Skin Care Products segment, particularly within the 0-50 ml size category, is a dominant force propelling the growth of the global Cosmetic Glass Jars market. This dominance is attributed to several interconnected factors. North America, led by the United States, and Europe, with countries like France and Germany, are the primary epicenters of this growth, owing to their mature beauty markets, high disposable incomes, and strong consumer inclination towards premium cosmetic formulations. The demand for high-efficacy skincare, anti-aging serums, and luxury moisturizers, often packaged in small, elegant glass jars, continues to surge.
- Skin Care Products Dominance: The segment accounts for an estimated XX% of the total market share in 2025. This is driven by the perception of glass as a premium and inert material that preserves the integrity and efficacy of sophisticated skincare formulations.
- 0-50 ml Size Category Leadership: This sub-segment holds an estimated YY% market share within the skincare application. These smaller sizes are ideal for premium serums, eye creams, and single-application treatments, offering convenience and perceived luxury.
- Regional Powerhouses (North America & Europe): These regions contribute significantly due to established luxury cosmetic brands, stringent quality standards, and a well-informed consumer base that values aesthetic appeal and product safety. Economic policies supporting manufacturing and innovation in these regions further bolster their leadership.
- Key Drivers in Dominant Segments:
- Premiumization Trend: Consumers are willing to pay more for products perceived as high-quality and luxurious.
- Sustainability Consciousness: The inherent recyclability and eco-friendly image of glass resonate with environmentally aware consumers.
- Product Integrity: Glass's non-reactive nature ensures that sensitive ingredients in skincare products remain stable and potent.
- Brand Differentiation: Unique glass jar designs and finishes allow brands to stand out on crowded retail shelves.
- Growth Potential: Emerging markets in Asia-Pacific are showing increasing adoption of skincare products packaged in glass, signaling future expansion opportunities.
Cosmetic Glass Jars Product Landscape
The cosmetic glass jars product landscape is characterized by continuous innovation focused on aesthetic appeal, functionality, and sustainability. Manufacturers are increasingly offering bespoke designs, including custom shapes, colors, and finishes like frosted, metallized, and matte coatings, to enhance brand identity. Performance metrics such as barrier properties against UV light and oxygen, inertness to preserve product formulation, and durability are paramount. Technological advancements in glass manufacturing enable the production of lighter-weight yet stronger jars, reducing material usage and transportation costs. The integration of smart features, though nascent, is also being explored.
Key Drivers, Barriers & Challenges in Cosmetic Glass Jars
The cosmetic glass jars market is propelled by the escalating demand for premium and sustainable beauty products, driven by evolving consumer preferences for eco-friendly packaging and the inherent luxury associated with glass. Technological advancements in glass manufacturing, leading to lighter, stronger, and more aesthetically versatile jars, also act as significant growth catalysts. Furthermore, regulatory pushes towards reducing plastic waste and promoting circular economy principles favor glass packaging. The parent market's growth, fueled by the burgeoning global cosmetics industry, directly benefits the cosmetic glass jars sector.
Key challenges include the higher cost of production and transportation compared to plastic alternatives, potential for breakage during transit, and the energy-intensive nature of glass manufacturing. Supply chain disruptions and fluctuations in raw material prices can also pose significant hurdles. Competitive pressures from innovative plastic and metal packaging solutions, especially in mass-market segments, remain a constant concern. Regulatory complexities surrounding glass recycling infrastructure in certain regions can also impact adoption.
Emerging Opportunities in Cosmetic Glass Jars
Emerging opportunities lie in the development of highly customized and artisanal glass jars for niche luxury brands and direct-to-consumer (DTC) beauty lines. The increasing popularity of refillable cosmetic products presents a significant avenue for glass jar manufacturers to innovate with robust and aesthetically pleasing designs that encourage repeated use. Furthermore, advancements in decorative techniques, such as digital printing and specialized coatings, allow for intricate branding and unique visual effects, catering to the demand for personalized and premium packaging. The growing focus on the circular economy and the demand for traceable and recycled glass content offers opportunities for manufacturers to champion sustainable sourcing and production practices.
Growth Accelerators in the Cosmetic Glass Jars Industry
Catalysts driving long-term growth in the cosmetic glass jars industry include the persistent global trend towards premiumization in the beauty sector, where glass packaging signifies quality and luxury. Strategic partnerships between glass manufacturers and cosmetic brands for co-development of innovative packaging solutions are accelerating product differentiation. Market expansion into emerging economies, driven by rising disposable incomes and a growing middle class with increasing interest in personal care, represents a significant growth avenue. Continuous investment in research and development for lighter-weight glass, enhanced barrier properties, and advanced decorative finishes will further solidify glass's position as a preferred packaging material.
Key Players Shaping the Cosmetic Glass Jars Market
- SGD Pharma
- Schott
- Gerresheimer
- Bormioli Pharma
- Sisecam Group
- PGP Glass
- Pragati Glass
- Shiotani Glass
- Pochet
- Stoelzle Glass
- Vitro Packaging
- Heinz Glas
- Zignago Vetro
- VERESCENCE
- Shandong Pharmaceutical Glass
- ChongQing Zhengchuan Pharmaceutical Packaging
- Anhui Deli Household Glass
Notable Milestones in Cosmetic Glass Jars Sector
- 2021: Increased investment in R&D for lightweight glass formulations by major players.
- 2022: Growing adoption of recycled glass content in cosmetic jar production driven by sustainability initiatives.
- 2022: Introduction of advanced decorative techniques such as digital printing for enhanced customization.
- 2023: Strategic collaborations between glass manufacturers and luxury beauty brands to develop unique packaging solutions.
- 2023: Emergence of innovative refillable glass jar systems to support the circular economy.
- 2024: Expansion of production capacities by key players to meet rising global demand.
In-Depth Cosmetic Glass Jars Market Outlook
The future of the cosmetic glass jars market is exceptionally promising, driven by an unwavering consumer preference for premium, sustainable, and aesthetically superior packaging. Growth accelerators such as technological advancements in glass manufacturing, enabling lighter and more durable products, and the increasing demand for eco-friendly solutions, will continue to fuel market expansion. Strategic market penetration into rapidly developing economies, coupled with the rise of direct-to-consumer (DTC) brands seeking distinct packaging, presents significant untapped potential. The industry is poised for continued innovation, focusing on enhanced customization, functional designs that support product integrity, and a stronger emphasis on circular economy principles, ensuring sustained growth and market leadership.
Cosmetic Glass Jars Segmentation
-
1. Application
- 1.1. Skin Care Products
- 1.2. Perfume
- 1.3. Nail Polish
- 1.4. Essential Oil
- 1.5. Other
-
2. Types
- 2.1. 0-50 ml
- 2.2. 50-150 ml
- 2.3. Over 150ml
Cosmetic Glass Jars Segmentation By Geography
-
1. North America
- 1.1. United States
- 1.2. Canada
- 1.3. Mexico
-
2. South America
- 2.1. Brazil
- 2.2. Argentina
- 2.3. Rest of South America
-
3. Europe
- 3.1. United Kingdom
- 3.2. Germany
- 3.3. France
- 3.4. Italy
- 3.5. Spain
- 3.6. Russia
- 3.7. Benelux
- 3.8. Nordics
- 3.9. Rest of Europe
-
4. Middle East & Africa
- 4.1. Turkey
- 4.2. Israel
- 4.3. GCC
- 4.4. North Africa
- 4.5. South Africa
- 4.6. Rest of Middle East & Africa
-
5. Asia Pacific
- 5.1. China
- 5.2. India
- 5.3. Japan
- 5.4. South Korea
- 5.5. ASEAN
- 5.6. Oceania
- 5.7. Rest of Asia Pacific
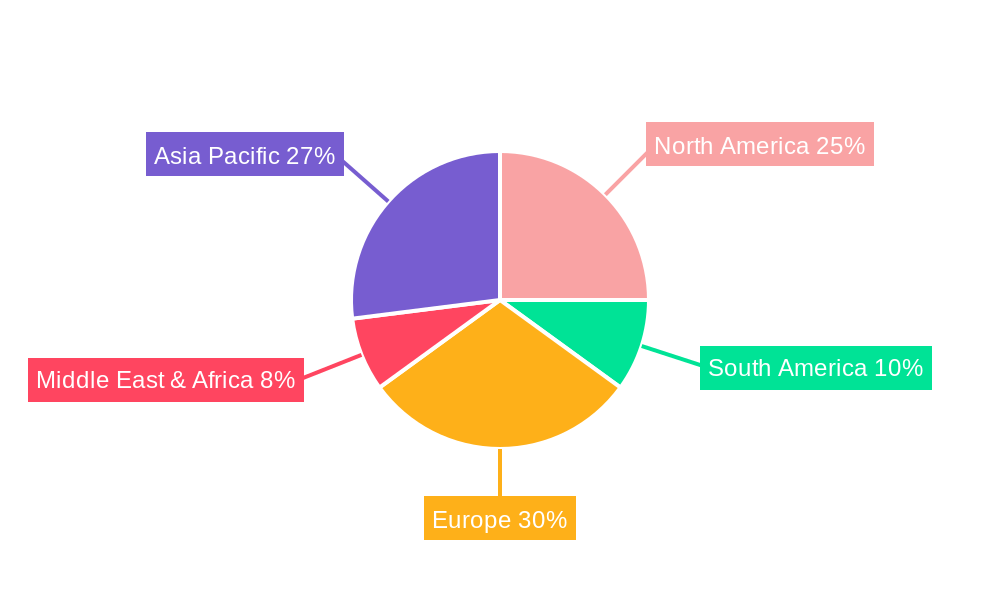
Cosmetic Glass Jars Regional Market Share
Geographic Coverage of Cosmetic Glass Jars
Cosmetic Glass Jars REPORT HIGHLIGHTS
| Aspects | Details |
|---|---|
| Study Period | 2020-2034 |
| Base Year | 2025 |
| Estimated Year | 2026 |
| Forecast Period | 2026-2034 |
| Historical Period | 2020-2025 |
| Growth Rate | CAGR of 2.98% from 2020-2034 |
| Segmentation |
|
Table of Contents
- 1. Introduction
- 1.1. Research Scope
- 1.2. Market Segmentation
- 1.3. Research Methodology
- 1.4. Definitions and Assumptions
- 2. Executive Summary
- 2.1. Introduction
- 3. Market Dynamics
- 3.1. Introduction
- 3.2. Market Drivers
- 3.3. Market Restrains
- 3.4. Market Trends
- 4. Market Factor Analysis
- 4.1. Porters Five Forces
- 4.2. Supply/Value Chain
- 4.3. PESTEL analysis
- 4.4. Market Entropy
- 4.5. Patent/Trademark Analysis
- 5. Global Cosmetic Glass Jars Analysis, Insights and Forecast, 2020-2032
- 5.1. Market Analysis, Insights and Forecast - by Application
- 5.1.1. Skin Care Products
- 5.1.2. Perfume
- 5.1.3. Nail Polish
- 5.1.4. Essential Oil
- 5.1.5. Other
- 5.2. Market Analysis, Insights and Forecast - by Types
- 5.2.1. 0-50 ml
- 5.2.2. 50-150 ml
- 5.2.3. Over 150ml
- 5.3. Market Analysis, Insights and Forecast - by Region
- 5.3.1. North America
- 5.3.2. South America
- 5.3.3. Europe
- 5.3.4. Middle East & Africa
- 5.3.5. Asia Pacific
- 5.1. Market Analysis, Insights and Forecast - by Application
- 6. North America Cosmetic Glass Jars Analysis, Insights and Forecast, 2020-2032
- 6.1. Market Analysis, Insights and Forecast - by Application
- 6.1.1. Skin Care Products
- 6.1.2. Perfume
- 6.1.3. Nail Polish
- 6.1.4. Essential Oil
- 6.1.5. Other
- 6.2. Market Analysis, Insights and Forecast - by Types
- 6.2.1. 0-50 ml
- 6.2.2. 50-150 ml
- 6.2.3. Over 150ml
- 6.1. Market Analysis, Insights and Forecast - by Application
- 7. South America Cosmetic Glass Jars Analysis, Insights and Forecast, 2020-2032
- 7.1. Market Analysis, Insights and Forecast - by Application
- 7.1.1. Skin Care Products
- 7.1.2. Perfume
- 7.1.3. Nail Polish
- 7.1.4. Essential Oil
- 7.1.5. Other
- 7.2. Market Analysis, Insights and Forecast - by Types
- 7.2.1. 0-50 ml
- 7.2.2. 50-150 ml
- 7.2.3. Over 150ml
- 7.1. Market Analysis, Insights and Forecast - by Application
- 8. Europe Cosmetic Glass Jars Analysis, Insights and Forecast, 2020-2032
- 8.1. Market Analysis, Insights and Forecast - by Application
- 8.1.1. Skin Care Products
- 8.1.2. Perfume
- 8.1.3. Nail Polish
- 8.1.4. Essential Oil
- 8.1.5. Other
- 8.2. Market Analysis, Insights and Forecast - by Types
- 8.2.1. 0-50 ml
- 8.2.2. 50-150 ml
- 8.2.3. Over 150ml
- 8.1. Market Analysis, Insights and Forecast - by Application
- 9. Middle East & Africa Cosmetic Glass Jars Analysis, Insights and Forecast, 2020-2032
- 9.1. Market Analysis, Insights and Forecast - by Application
- 9.1.1. Skin Care Products
- 9.1.2. Perfume
- 9.1.3. Nail Polish
- 9.1.4. Essential Oil
- 9.1.5. Other
- 9.2. Market Analysis, Insights and Forecast - by Types
- 9.2.1. 0-50 ml
- 9.2.2. 50-150 ml
- 9.2.3. Over 150ml
- 9.1. Market Analysis, Insights and Forecast - by Application
- 10. Asia Pacific Cosmetic Glass Jars Analysis, Insights and Forecast, 2020-2032
- 10.1. Market Analysis, Insights and Forecast - by Application
- 10.1.1. Skin Care Products
- 10.1.2. Perfume
- 10.1.3. Nail Polish
- 10.1.4. Essential Oil
- 10.1.5. Other
- 10.2. Market Analysis, Insights and Forecast - by Types
- 10.2.1. 0-50 ml
- 10.2.2. 50-150 ml
- 10.2.3. Over 150ml
- 10.1. Market Analysis, Insights and Forecast - by Application
- 11. Competitive Analysis
- 11.1. Global Market Share Analysis 2025
- 11.2. Company Profiles
- 11.2.1 SGD Pharma
- 11.2.1.1. Overview
- 11.2.1.2. Products
- 11.2.1.3. SWOT Analysis
- 11.2.1.4. Recent Developments
- 11.2.1.5. Financials (Based on Availability)
- 11.2.2 Schott
- 11.2.2.1. Overview
- 11.2.2.2. Products
- 11.2.2.3. SWOT Analysis
- 11.2.2.4. Recent Developments
- 11.2.2.5. Financials (Based on Availability)
- 11.2.3 Gerresheimer
- 11.2.3.1. Overview
- 11.2.3.2. Products
- 11.2.3.3. SWOT Analysis
- 11.2.3.4. Recent Developments
- 11.2.3.5. Financials (Based on Availability)
- 11.2.4 Bormioli Pharma
- 11.2.4.1. Overview
- 11.2.4.2. Products
- 11.2.4.3. SWOT Analysis
- 11.2.4.4. Recent Developments
- 11.2.4.5. Financials (Based on Availability)
- 11.2.5 Sisecam Group
- 11.2.5.1. Overview
- 11.2.5.2. Products
- 11.2.5.3. SWOT Analysis
- 11.2.5.4. Recent Developments
- 11.2.5.5. Financials (Based on Availability)
- 11.2.6 PGP Glass
- 11.2.6.1. Overview
- 11.2.6.2. Products
- 11.2.6.3. SWOT Analysis
- 11.2.6.4. Recent Developments
- 11.2.6.5. Financials (Based on Availability)
- 11.2.7 Pragati Glass
- 11.2.7.1. Overview
- 11.2.7.2. Products
- 11.2.7.3. SWOT Analysis
- 11.2.7.4. Recent Developments
- 11.2.7.5. Financials (Based on Availability)
- 11.2.8 Shiotani Glass
- 11.2.8.1. Overview
- 11.2.8.2. Products
- 11.2.8.3. SWOT Analysis
- 11.2.8.4. Recent Developments
- 11.2.8.5. Financials (Based on Availability)
- 11.2.9 Pochet
- 11.2.9.1. Overview
- 11.2.9.2. Products
- 11.2.9.3. SWOT Analysis
- 11.2.9.4. Recent Developments
- 11.2.9.5. Financials (Based on Availability)
- 11.2.10 Stoelzle Glass
- 11.2.10.1. Overview
- 11.2.10.2. Products
- 11.2.10.3. SWOT Analysis
- 11.2.10.4. Recent Developments
- 11.2.10.5. Financials (Based on Availability)
- 11.2.11 Vitro Packaging
- 11.2.11.1. Overview
- 11.2.11.2. Products
- 11.2.11.3. SWOT Analysis
- 11.2.11.4. Recent Developments
- 11.2.11.5. Financials (Based on Availability)
- 11.2.12 Heinz Glas
- 11.2.12.1. Overview
- 11.2.12.2. Products
- 11.2.12.3. SWOT Analysis
- 11.2.12.4. Recent Developments
- 11.2.12.5. Financials (Based on Availability)
- 11.2.13 Zignago Vetro
- 11.2.13.1. Overview
- 11.2.13.2. Products
- 11.2.13.3. SWOT Analysis
- 11.2.13.4. Recent Developments
- 11.2.13.5. Financials (Based on Availability)
- 11.2.14 VERESCENCE
- 11.2.14.1. Overview
- 11.2.14.2. Products
- 11.2.14.3. SWOT Analysis
- 11.2.14.4. Recent Developments
- 11.2.14.5. Financials (Based on Availability)
- 11.2.15 Shandong Pharmaceutical Glass
- 11.2.15.1. Overview
- 11.2.15.2. Products
- 11.2.15.3. SWOT Analysis
- 11.2.15.4. Recent Developments
- 11.2.15.5. Financials (Based on Availability)
- 11.2.16 ChongQing Zhengchuan Pharmaceutical Packaging
- 11.2.16.1. Overview
- 11.2.16.2. Products
- 11.2.16.3. SWOT Analysis
- 11.2.16.4. Recent Developments
- 11.2.16.5. Financials (Based on Availability)
- 11.2.17 Anhui Deli Household Glass
- 11.2.17.1. Overview
- 11.2.17.2. Products
- 11.2.17.3. SWOT Analysis
- 11.2.17.4. Recent Developments
- 11.2.17.5. Financials (Based on Availability)
- 11.2.1 SGD Pharma
List of Figures
- Figure 1: Global Cosmetic Glass Jars Revenue Breakdown (billion, %) by Region 2025 & 2033
- Figure 2: North America Cosmetic Glass Jars Revenue (billion), by Application 2025 & 2033
- Figure 3: North America Cosmetic Glass Jars Revenue Share (%), by Application 2025 & 2033
- Figure 4: North America Cosmetic Glass Jars Revenue (billion), by Types 2025 & 2033
- Figure 5: North America Cosmetic Glass Jars Revenue Share (%), by Types 2025 & 2033
- Figure 6: North America Cosmetic Glass Jars Revenue (billion), by Country 2025 & 2033
- Figure 7: North America Cosmetic Glass Jars Revenue Share (%), by Country 2025 & 2033
- Figure 8: South America Cosmetic Glass Jars Revenue (billion), by Application 2025 & 2033
- Figure 9: South America Cosmetic Glass Jars Revenue Share (%), by Application 2025 & 2033
- Figure 10: South America Cosmetic Glass Jars Revenue (billion), by Types 2025 & 2033
- Figure 11: South America Cosmetic Glass Jars Revenue Share (%), by Types 2025 & 2033
- Figure 12: South America Cosmetic Glass Jars Revenue (billion), by Country 2025 & 2033
- Figure 13: South America Cosmetic Glass Jars Revenue Share (%), by Country 2025 & 2033
- Figure 14: Europe Cosmetic Glass Jars Revenue (billion), by Application 2025 & 2033
- Figure 15: Europe Cosmetic Glass Jars Revenue Share (%), by Application 2025 & 2033
- Figure 16: Europe Cosmetic Glass Jars Revenue (billion), by Types 2025 & 2033
- Figure 17: Europe Cosmetic Glass Jars Revenue Share (%), by Types 2025 & 2033
- Figure 18: Europe Cosmetic Glass Jars Revenue (billion), by Country 2025 & 2033
- Figure 19: Europe Cosmetic Glass Jars Revenue Share (%), by Country 2025 & 2033
- Figure 20: Middle East & Africa Cosmetic Glass Jars Revenue (billion), by Application 2025 & 2033
- Figure 21: Middle East & Africa Cosmetic Glass Jars Revenue Share (%), by Application 2025 & 2033
- Figure 22: Middle East & Africa Cosmetic Glass Jars Revenue (billion), by Types 2025 & 2033
- Figure 23: Middle East & Africa Cosmetic Glass Jars Revenue Share (%), by Types 2025 & 2033
- Figure 24: Middle East & Africa Cosmetic Glass Jars Revenue (billion), by Country 2025 & 2033
- Figure 25: Middle East & Africa Cosmetic Glass Jars Revenue Share (%), by Country 2025 & 2033
- Figure 26: Asia Pacific Cosmetic Glass Jars Revenue (billion), by Application 2025 & 2033
- Figure 27: Asia Pacific Cosmetic Glass Jars Revenue Share (%), by Application 2025 & 2033
- Figure 28: Asia Pacific Cosmetic Glass Jars Revenue (billion), by Types 2025 & 2033
- Figure 29: Asia Pacific Cosmetic Glass Jars Revenue Share (%), by Types 2025 & 2033
- Figure 30: Asia Pacific Cosmetic Glass Jars Revenue (billion), by Country 2025 & 2033
- Figure 31: Asia Pacific Cosmetic Glass Jars Revenue Share (%), by Country 2025 & 2033
List of Tables
- Table 1: Global Cosmetic Glass Jars Revenue billion Forecast, by Application 2020 & 2033
- Table 2: Global Cosmetic Glass Jars Revenue billion Forecast, by Types 2020 & 2033
- Table 3: Global Cosmetic Glass Jars Revenue billion Forecast, by Region 2020 & 2033
- Table 4: Global Cosmetic Glass Jars Revenue billion Forecast, by Application 2020 & 2033
- Table 5: Global Cosmetic Glass Jars Revenue billion Forecast, by Types 2020 & 2033
- Table 6: Global Cosmetic Glass Jars Revenue billion Forecast, by Country 2020 & 2033
- Table 7: United States Cosmetic Glass Jars Revenue (billion) Forecast, by Application 2020 & 2033
- Table 8: Canada Cosmetic Glass Jars Revenue (billion) Forecast, by Application 2020 & 2033
- Table 9: Mexico Cosmetic Glass Jars Revenue (billion) Forecast, by Application 2020 & 2033
- Table 10: Global Cosmetic Glass Jars Revenue billion Forecast, by Application 2020 & 2033
- Table 11: Global Cosmetic Glass Jars Revenue billion Forecast, by Types 2020 & 2033
- Table 12: Global Cosmetic Glass Jars Revenue billion Forecast, by Country 2020 & 2033
- Table 13: Brazil Cosmetic Glass Jars Revenue (billion) Forecast, by Application 2020 & 2033
- Table 14: Argentina Cosmetic Glass Jars Revenue (billion) Forecast, by Application 2020 & 2033
- Table 15: Rest of South America Cosmetic Glass Jars Revenue (billion) Forecast, by Application 2020 & 2033
- Table 16: Global Cosmetic Glass Jars Revenue billion Forecast, by Application 2020 & 2033
- Table 17: Global Cosmetic Glass Jars Revenue billion Forecast, by Types 2020 & 2033
- Table 18: Global Cosmetic Glass Jars Revenue billion Forecast, by Country 2020 & 2033
- Table 19: United Kingdom Cosmetic Glass Jars Revenue (billion) Forecast, by Application 2020 & 2033
- Table 20: Germany Cosmetic Glass Jars Revenue (billion) Forecast, by Application 2020 & 2033
- Table 21: France Cosmetic Glass Jars Revenue (billion) Forecast, by Application 2020 & 2033
- Table 22: Italy Cosmetic Glass Jars Revenue (billion) Forecast, by Application 2020 & 2033
- Table 23: Spain Cosmetic Glass Jars Revenue (billion) Forecast, by Application 2020 & 2033
- Table 24: Russia Cosmetic Glass Jars Revenue (billion) Forecast, by Application 2020 & 2033
- Table 25: Benelux Cosmetic Glass Jars Revenue (billion) Forecast, by Application 2020 & 2033
- Table 26: Nordics Cosmetic Glass Jars Revenue (billion) Forecast, by Application 2020 & 2033
- Table 27: Rest of Europe Cosmetic Glass Jars Revenue (billion) Forecast, by Application 2020 & 2033
- Table 28: Global Cosmetic Glass Jars Revenue billion Forecast, by Application 2020 & 2033
- Table 29: Global Cosmetic Glass Jars Revenue billion Forecast, by Types 2020 & 2033
- Table 30: Global Cosmetic Glass Jars Revenue billion Forecast, by Country 2020 & 2033
- Table 31: Turkey Cosmetic Glass Jars Revenue (billion) Forecast, by Application 2020 & 2033
- Table 32: Israel Cosmetic Glass Jars Revenue (billion) Forecast, by Application 2020 & 2033
- Table 33: GCC Cosmetic Glass Jars Revenue (billion) Forecast, by Application 2020 & 2033
- Table 34: North Africa Cosmetic Glass Jars Revenue (billion) Forecast, by Application 2020 & 2033
- Table 35: South Africa Cosmetic Glass Jars Revenue (billion) Forecast, by Application 2020 & 2033
- Table 36: Rest of Middle East & Africa Cosmetic Glass Jars Revenue (billion) Forecast, by Application 2020 & 2033
- Table 37: Global Cosmetic Glass Jars Revenue billion Forecast, by Application 2020 & 2033
- Table 38: Global Cosmetic Glass Jars Revenue billion Forecast, by Types 2020 & 2033
- Table 39: Global Cosmetic Glass Jars Revenue billion Forecast, by Country 2020 & 2033
- Table 40: China Cosmetic Glass Jars Revenue (billion) Forecast, by Application 2020 & 2033
- Table 41: India Cosmetic Glass Jars Revenue (billion) Forecast, by Application 2020 & 2033
- Table 42: Japan Cosmetic Glass Jars Revenue (billion) Forecast, by Application 2020 & 2033
- Table 43: South Korea Cosmetic Glass Jars Revenue (billion) Forecast, by Application 2020 & 2033
- Table 44: ASEAN Cosmetic Glass Jars Revenue (billion) Forecast, by Application 2020 & 2033
- Table 45: Oceania Cosmetic Glass Jars Revenue (billion) Forecast, by Application 2020 & 2033
- Table 46: Rest of Asia Pacific Cosmetic Glass Jars Revenue (billion) Forecast, by Application 2020 & 2033
Frequently Asked Questions
1. What is the projected Compound Annual Growth Rate (CAGR) of the Cosmetic Glass Jars?
The projected CAGR is approximately 2.98%.
2. Which companies are prominent players in the Cosmetic Glass Jars?
Key companies in the market include SGD Pharma, Schott, Gerresheimer, Bormioli Pharma, Sisecam Group, PGP Glass, Pragati Glass, Shiotani Glass, Pochet, Stoelzle Glass, Vitro Packaging, Heinz Glas, Zignago Vetro, VERESCENCE, Shandong Pharmaceutical Glass, ChongQing Zhengchuan Pharmaceutical Packaging, Anhui Deli Household Glass.
3. What are the main segments of the Cosmetic Glass Jars?
The market segments include Application, Types.
4. Can you provide details about the market size?
The market size is estimated to be USD 8.12 billion as of 2022.
5. What are some drivers contributing to market growth?
N/A
6. What are the notable trends driving market growth?
N/A
7. Are there any restraints impacting market growth?
N/A
8. Can you provide examples of recent developments in the market?
N/A
9. What pricing options are available for accessing the report?
Pricing options include single-user, multi-user, and enterprise licenses priced at USD 2900.00, USD 4350.00, and USD 5800.00 respectively.
10. Is the market size provided in terms of value or volume?
The market size is provided in terms of value, measured in billion.
11. Are there any specific market keywords associated with the report?
Yes, the market keyword associated with the report is "Cosmetic Glass Jars," which aids in identifying and referencing the specific market segment covered.
12. How do I determine which pricing option suits my needs best?
The pricing options vary based on user requirements and access needs. Individual users may opt for single-user licenses, while businesses requiring broader access may choose multi-user or enterprise licenses for cost-effective access to the report.
13. Are there any additional resources or data provided in the Cosmetic Glass Jars report?
While the report offers comprehensive insights, it's advisable to review the specific contents or supplementary materials provided to ascertain if additional resources or data are available.
14. How can I stay updated on further developments or reports in the Cosmetic Glass Jars?
To stay informed about further developments, trends, and reports in the Cosmetic Glass Jars, consider subscribing to industry newsletters, following relevant companies and organizations, or regularly checking reputable industry news sources and publications.
Methodology
Step 1 - Identification of Relevant Samples Size from Population Database


Step 2 - Approaches for Defining Global Market Size (Value, Volume* & Price*)

Note*: In applicable scenarios
Step 3 - Data Sources
Primary Research
- Web Analytics
- Survey Reports
- Research Institute
- Latest Research Reports
- Opinion Leaders
Secondary Research
- Annual Reports
- White Paper
- Latest Press Release
- Industry Association
- Paid Database
- Investor Presentations

Step 4 - Data Triangulation
Involves using different sources of information in order to increase the validity of a study
These sources are likely to be stakeholders in a program - participants, other researchers, program staff, other community members, and so on.
Then we put all data in single framework & apply various statistical tools to find out the dynamic on the market.
During the analysis stage, feedback from the stakeholder groups would be compared to determine areas of agreement as well as areas of divergence