

Key Insights
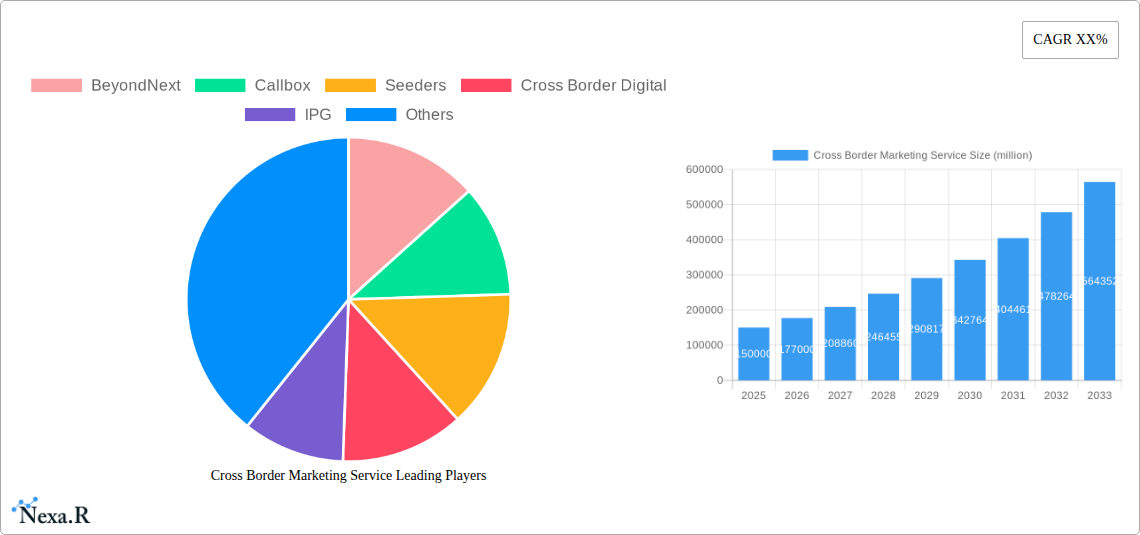
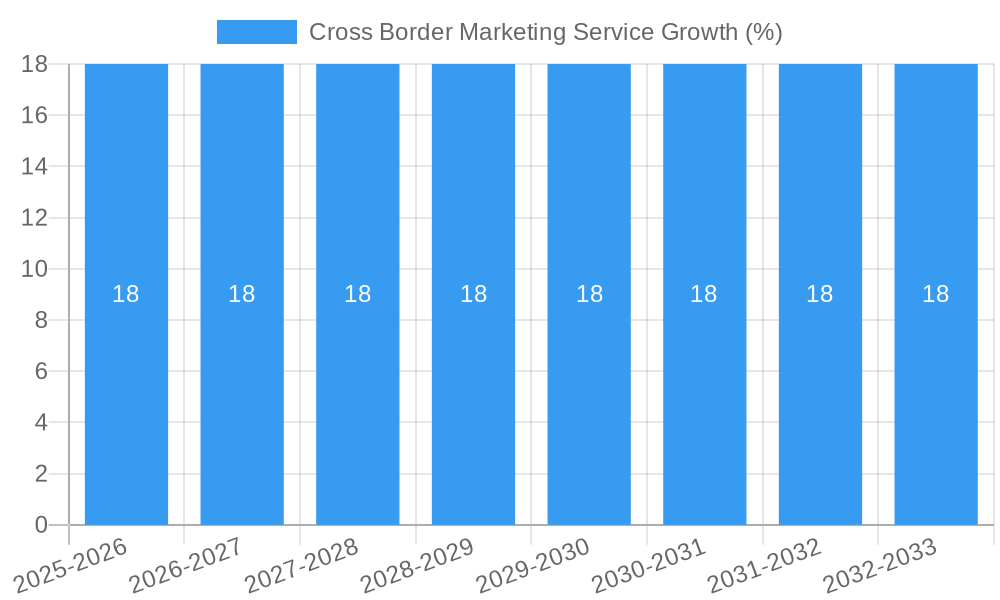
The global Cross Border Marketing Service market is experiencing robust growth, projected to reach an estimated USD 150,000 million in 2025. This expansion is fueled by a significant Compound Annual Growth Rate (CAGR) of 18%, indicating a dynamic and rapidly evolving industry. The market's trajectory is largely propelled by the increasing globalization of businesses and the imperative for companies to reach diverse international audiences. Key drivers include the surge in e-commerce, the growing demand for localized marketing campaigns to resonate with specific cultural nuances, and the strategic need for businesses to diversify their customer base and mitigate risks associated with over-reliance on single markets. The digital transformation across industries further amplifies the need for specialized cross-border marketing expertise, encompassing Search Engine Optimization (SEO) tailored for international search engines, targeted social media advertising across different platforms and regions, and a spectrum of other innovative digital marketing strategies. The market is segmented to cater to both Big Enterprises, requiring comprehensive global strategies, and Small and Medium-sized Enterprises (SMEs), seeking cost-effective and efficient international outreach solutions.
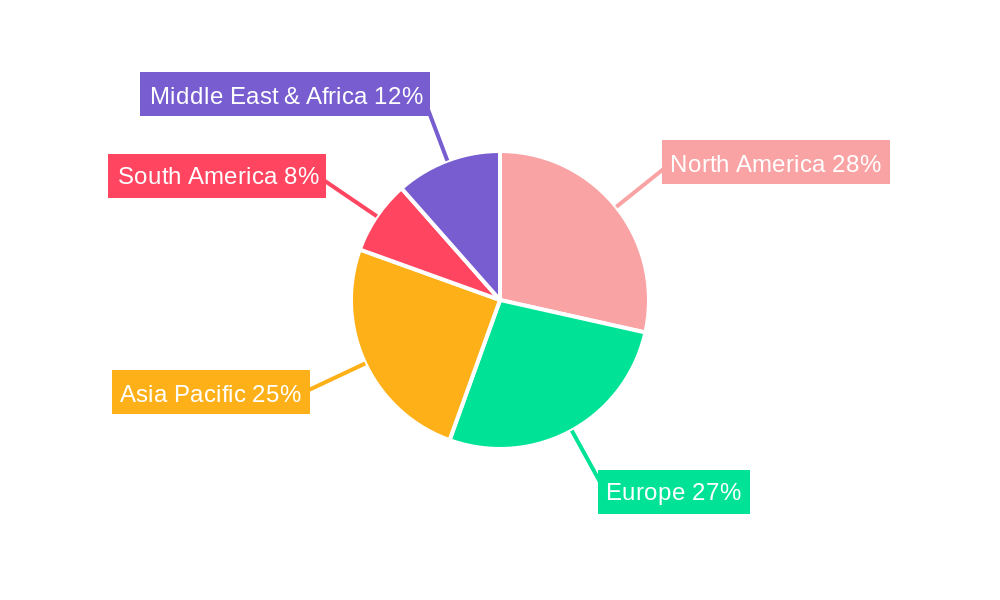
This market's impressive growth is further underscored by emerging trends such as the heightened adoption of AI and machine learning for hyper-personalized cross-border campaigns, the increasing focus on influencer marketing in diverse cultural landscapes, and the growing importance of data analytics for optimizing international marketing ROI. However, the market is not without its restraints. Challenges such as navigating complex international regulations and compliance requirements, managing currency fluctuations and diverse payment gateways, and overcoming cultural and linguistic barriers present significant hurdles. Despite these challenges, the inherent opportunities in tapping into new revenue streams and expanding global brand presence continue to drive investment and innovation. Leading players like Omnicom Media Group, WPP, Publicis Groupe, and IPG are at the forefront, offering a comprehensive suite of services to help businesses overcome these complexities and succeed in the global marketplace. Asia Pacific, driven by China and India, is emerging as a significant growth region, while North America and Europe remain dominant markets.
Cross Border Marketing Service Market Report: Global Insights & Future Projections (2019-2033)
This comprehensive report delivers an in-depth analysis of the global Cross Border Marketing Service market, encompassing its dynamics, growth trajectories, regional dominance, product landscape, key players, and future outlook. With a study period spanning from 2019 to 2033, and focusing on a base year of 2025, this report provides actionable insights for industry professionals, investors, and strategic planners navigating the complexities of international digital and traditional marketing. We have integrated high-traffic keywords related to SEO, social media advertising, enterprise solutions, and SME strategies to maximize search engine visibility. The analysis considers both parent and child markets to offer a holistic view. All quantitative values are presented in million units.
Cross Border Marketing Service Market Dynamics & Structure
The global Cross Border Marketing Service market exhibits a moderately concentrated structure, with a blend of large multinational agencies and specialized niche players. Technological innovation is a primary driver, fueled by advancements in AI-driven analytics, programmatic advertising, and personalized content creation. Regulatory frameworks, such as data privacy laws (e.g., GDPR, CCPA), significantly influence market strategies, requiring tailored approaches for different jurisdictions. Competitive product substitutes include in-house marketing teams, freelance agencies, and self-service advertising platforms, though the complexity of cross-border campaigns often necessitates specialized expertise. End-user demographics are increasingly sophisticated, with both Big Enterprises and SMEs seeking cost-effective and high-ROI solutions for international expansion. Mergers and acquisitions (M&A) are active, consolidating market share and expanding service portfolios.
- Market Concentration: Dominated by a few large agencies, but with substantial room for specialized mid-sized and smaller firms.
- Technological Innovation Drivers: AI-powered ad optimization, real-time analytics, cross-cultural content adaptation tools, predictive customer journey mapping.
- Regulatory Frameworks: Data privacy compliance, local advertising standards, intellectual property protection laws.
- Competitive Product Substitutes: In-house digital marketing teams, generalist advertising agencies, platform-specific advertising tools.
- End-User Demographics: Big Enterprises ($XX million market segment) seeking complex, multi-channel strategies; SMEs ($XX million market segment) focusing on scalable and budget-conscious international reach.
- M&A Trends: Ongoing consolidation to acquire technological capabilities, client bases, and geographic footprints. Deal volumes are projected to be $XX million annually.
Cross Border Marketing Service Growth Trends & Insights
The Cross Border Marketing Service market is poised for robust expansion, driven by the relentless globalization of commerce and the increasing digital adoption across all industries. The market size is projected to grow from approximately $XXX million in 2019 to an estimated $XXX million by 2033, reflecting a compelling Compound Annual Growth Rate (CAGR) of XX%. This growth is underpinned by a significant increase in cross-border e-commerce transactions, which have surged from $XXX million in 2019 to an estimated $XXX million in 2025. Companies of all sizes are recognizing the imperative to reach international audiences effectively, leading to higher adoption rates of specialized cross-border marketing services.
Technological disruptions are continuously reshaping the landscape. The rise of AI and machine learning is enabling more precise audience segmentation, hyper-personalized campaign delivery, and real-time performance optimization. Search Engine Optimization (SEO) for international markets, including local SEO and multilingual SEO, is no longer a luxury but a necessity, contributing significantly to the market's growth. Similarly, Social Media Advertising is experiencing unprecedented demand for localized content and platform-specific strategies, moving beyond generic global campaigns to highly targeted regional activations. Consumer behavior shifts are also pivotal; consumers are increasingly accustomed to global brands and expect seamless, culturally relevant experiences regardless of their location. This necessitates a deep understanding of local nuances, from language and imagery to payment preferences and social media habits. The market penetration of dedicated cross-border marketing services is expected to climb from XX% in 2019 to an estimated XX% by 2033, indicating a substantial shift towards professional outsourcing for international market entry and growth. The overall market is expected to reach $XXX million in 2025, with projections for substantial growth through the forecast period.
Dominant Regions, Countries, or Segments in Cross Border Marketing Service
North America currently leads the Cross Border Marketing Service market, driven by its established digital infrastructure, high adoption rates of advanced marketing technologies, and the presence of numerous multinational corporations with global ambitions. The United States, in particular, remains a powerhouse, serving as both a source and a destination for cross-border marketing efforts. Its sophisticated advertising ecosystem, coupled with a strong emphasis on data analytics and performance marketing, positions it as a trendsetter. The market size in North America is estimated at $XXX million in 2025.
Within the application segments, Big Enterprises represent a dominant force, accounting for an estimated XX% of the market share in 2025, valued at $XXX million. These large organizations have the budgets and the complex needs to justify significant investments in comprehensive cross-border marketing strategies that encompass market entry, brand building, and customer acquisition across multiple territories. SMEs, while smaller in individual spending, collectively represent a rapidly growing segment, with an estimated market size of $XXX million in 2025 and a projected CAGR of XX% through the forecast period. Their increasing reliance on international markets for growth fuels demand for scalable and cost-effective cross-border solutions.
In terms of service types, Search Engine Optimization (SEO) is a cornerstone, estimated at $XXX million market share in 2025, with a projected CAGR of XX%. This is directly linked to the fundamental need for discoverability in diverse linguistic and algorithmic environments. Social Media Advertising follows closely, with an estimated market size of $XXX million in 2025 and a CAGR of XX%, driven by the global reach and engagement potential of social platforms. "Others," encompassing a range of services like content marketing, influencer marketing, and programmatic advertising, collectively form a significant segment valued at $XXX million in 2025, demonstrating the multifaceted nature of cross-border campaigns. Key drivers for this dominance include favorable economic policies, robust technological infrastructure, a skilled talent pool, and strong intergovernmental trade agreements that facilitate international business operations.
Cross Border Marketing Service Product Landscape
The Cross Border Marketing Service product landscape is characterized by continuous innovation focused on enhancing global reach and localized relevance. Leading solutions now integrate AI-powered analytics for hyper-segmentation, predictive campaign modeling, and automated content translation and adaptation. Platforms are increasingly offering unified dashboards for managing campaigns across diverse channels and geographies, from Search Engine Optimization to Social Media Advertising. Performance metrics are paramount, with a strong emphasis on ROI tracking, customer acquisition cost (CAC) optimization, and lifetime value (LTV) enhancement for international customer bases. Unique selling propositions often lie in the ability to deliver culturally nuanced messaging at scale, leveraging proprietary data insights and real-time performance adjustments. Technological advancements are enabling more sophisticated approaches to cross-cultural communication and engagement.
Key Drivers, Barriers & Challenges in Cross Border Marketing Service
Key Drivers: The primary forces propelling the Cross Border Marketing Service market include the accelerating growth of global e-commerce, which necessitates international customer acquisition. Technological advancements in AI, data analytics, and automation enable more effective and efficient cross-border campaigns. The increasing demand from SMEs for international market expansion, coupled with the need for Big Enterprises to maintain global brand consistency and reach, further fuels growth. Favorable trade policies and the proliferation of digital platforms providing global access are also significant drivers.
Barriers & Challenges: Significant challenges include navigating diverse regulatory landscapes and data privacy laws across different countries, which can increase compliance costs and complexity. Cultural nuances and language barriers require meticulous localization efforts, posing a risk of miscommunication or brand misrepresentation. Supply chain disruptions, though more indirect to marketing services, can impact the overall international trade environment, indirectly affecting marketing investment. Intense competitive pressures from both global agencies and local players necessitate continuous innovation and differentiation. The cost of building and maintaining a global marketing infrastructure can be substantial, acting as a barrier for smaller entities.
Emerging Opportunities in Cross Border Marketing Service
Emerging opportunities in the Cross Border Marketing Service sector are abundant, particularly in untapped markets within emerging economies and the rapidly evolving landscape of influencer marketing on a global scale. The growing adoption of short-form video content and interactive formats on social media presents a significant avenue for localized engagement strategies. Furthermore, the development of more sophisticated AI-powered tools for real-time linguistic and cultural adaptation of marketing collateral offers immense potential for streamlined and effective campaigns. The increasing consumer demand for personalized experiences, even across borders, opens doors for hyper-targeted campaigns built on robust cross-border data analytics.
Growth Accelerators in the Cross Border Marketing Service Industry
Catalysts driving long-term growth in the Cross Border Marketing Service industry are multifaceted. Technological breakthroughs, such as advanced AI for predictive analytics and hyper-personalization, are fundamentally altering campaign effectiveness. Strategic partnerships between marketing agencies, technology providers, and e-commerce platforms are creating synergistic ecosystems that accelerate client acquisition and service delivery. Market expansion strategies, including organic growth into new territories and strategic acquisitions to gain market share or acquire specialized capabilities, are also crucial. The increasing reliance on data-driven decision-making and performance marketing metrics further solidifies the need for sophisticated cross-border marketing expertise.
Key Players Shaping the Cross Border Marketing Service Market
- BeyondNext
- Callbox
- Seeders
- Cross Border Digital
- IPG
- Publicis Groupe
- BlueFocus
- WPP
- Edelman
- Ketchum
- Zeno Group
- Fidsolid
- Omnicom Media Group
- Ketchum Public Relations
- MSL
- Premiere Consulting Group
- AMBITIOUS PR
- GlobalCom PR Network
Notable Milestones in Cross Border Marketing Service Sector
- 2019: Increased adoption of AI-driven programmatic advertising for cross-border campaigns.
- 2020: Significant surge in e-commerce, amplifying the need for global digital marketing solutions.
- 2021: Enhanced focus on data privacy regulations (e.g., GDPR impact on international data transfer).
- 2022: Rise of sophisticated influencer marketing platforms for global reach.
- 2023: Greater integration of metaverse and Web3 technologies in cross-border marketing strategies.
- 2024: Advancements in real-time translation and localization tools becoming standard.
In-Depth Cross Border Marketing Service Market Outlook
The future market outlook for Cross Border Marketing Services is exceptionally strong, driven by the sustained globalization of businesses and the continuous evolution of digital engagement strategies. Growth accelerators, including cutting-edge AI for personalized campaigns and strategic collaborations between global agencies and local experts, will underpin market expansion. The increasing demand from both large enterprises and SMEs to tap into international consumer bases, coupled with the ongoing development of sophisticated analytics and automation tools, indicates a robust trajectory. The market is well-positioned for significant growth as businesses increasingly prioritize a unified yet culturally relevant global brand presence, creating substantial opportunities for service providers capable of navigating the complexities of international markets.
Cross Border Marketing Service Segmentation
-
1. Application
- 1.1. Big Enterprises
- 1.2. SMEs
-
2. Types
- 2.1. Search Engine Optimization
- 2.2. Social Media Advertising
- 2.3. Others
Cross Border Marketing Service Segmentation By Geography
-
1. North America
- 1.1. United States
- 1.2. Canada
- 1.3. Mexico
-
2. South America
- 2.1. Brazil
- 2.2. Argentina
- 2.3. Rest of South America
-
3. Europe
- 3.1. United Kingdom
- 3.2. Germany
- 3.3. France
- 3.4. Italy
- 3.5. Spain
- 3.6. Russia
- 3.7. Benelux
- 3.8. Nordics
- 3.9. Rest of Europe
-
4. Middle East & Africa
- 4.1. Turkey
- 4.2. Israel
- 4.3. GCC
- 4.4. North Africa
- 4.5. South Africa
- 4.6. Rest of Middle East & Africa
-
5. Asia Pacific
- 5.1. China
- 5.2. India
- 5.3. Japan
- 5.4. South Korea
- 5.5. ASEAN
- 5.6. Oceania
- 5.7. Rest of Asia Pacific
Cross Border Marketing Service REPORT HIGHLIGHTS
| Aspects | Details |
|---|---|
| Study Period | 2019-2033 |
| Base Year | 2024 |
| Estimated Year | 2025 |
| Forecast Period | 2025-2033 |
| Historical Period | 2019-2024 |
| Growth Rate | CAGR of XX% from 2019-2033 |
| Segmentation |
|
Table of Contents
- 1. Introduction
- 1.1. Research Scope
- 1.2. Market Segmentation
- 1.3. Research Methodology
- 1.4. Definitions and Assumptions
- 2. Executive Summary
- 2.1. Introduction
- 3. Market Dynamics
- 3.1. Introduction
- 3.2. Market Drivers
- 3.3. Market Restrains
- 3.4. Market Trends
- 4. Market Factor Analysis
- 4.1. Porters Five Forces
- 4.2. Supply/Value Chain
- 4.3. PESTEL analysis
- 4.4. Market Entropy
- 4.5. Patent/Trademark Analysis
- 5. Global Cross Border Marketing Service Analysis, Insights and Forecast, 2019-2031
- 5.1. Market Analysis, Insights and Forecast - by Application
- 5.1.1. Big Enterprises
- 5.1.2. SMEs
- 5.2. Market Analysis, Insights and Forecast - by Types
- 5.2.1. Search Engine Optimization
- 5.2.2. Social Media Advertising
- 5.2.3. Others
- 5.3. Market Analysis, Insights and Forecast - by Region
- 5.3.1. North America
- 5.3.2. South America
- 5.3.3. Europe
- 5.3.4. Middle East & Africa
- 5.3.5. Asia Pacific
- 5.1. Market Analysis, Insights and Forecast - by Application
- 6. North America Cross Border Marketing Service Analysis, Insights and Forecast, 2019-2031
- 6.1. Market Analysis, Insights and Forecast - by Application
- 6.1.1. Big Enterprises
- 6.1.2. SMEs
- 6.2. Market Analysis, Insights and Forecast - by Types
- 6.2.1. Search Engine Optimization
- 6.2.2. Social Media Advertising
- 6.2.3. Others
- 6.1. Market Analysis, Insights and Forecast - by Application
- 7. South America Cross Border Marketing Service Analysis, Insights and Forecast, 2019-2031
- 7.1. Market Analysis, Insights and Forecast - by Application
- 7.1.1. Big Enterprises
- 7.1.2. SMEs
- 7.2. Market Analysis, Insights and Forecast - by Types
- 7.2.1. Search Engine Optimization
- 7.2.2. Social Media Advertising
- 7.2.3. Others
- 7.1. Market Analysis, Insights and Forecast - by Application
- 8. Europe Cross Border Marketing Service Analysis, Insights and Forecast, 2019-2031
- 8.1. Market Analysis, Insights and Forecast - by Application
- 8.1.1. Big Enterprises
- 8.1.2. SMEs
- 8.2. Market Analysis, Insights and Forecast - by Types
- 8.2.1. Search Engine Optimization
- 8.2.2. Social Media Advertising
- 8.2.3. Others
- 8.1. Market Analysis, Insights and Forecast - by Application
- 9. Middle East & Africa Cross Border Marketing Service Analysis, Insights and Forecast, 2019-2031
- 9.1. Market Analysis, Insights and Forecast - by Application
- 9.1.1. Big Enterprises
- 9.1.2. SMEs
- 9.2. Market Analysis, Insights and Forecast - by Types
- 9.2.1. Search Engine Optimization
- 9.2.2. Social Media Advertising
- 9.2.3. Others
- 9.1. Market Analysis, Insights and Forecast - by Application
- 10. Asia Pacific Cross Border Marketing Service Analysis, Insights and Forecast, 2019-2031
- 10.1. Market Analysis, Insights and Forecast - by Application
- 10.1.1. Big Enterprises
- 10.1.2. SMEs
- 10.2. Market Analysis, Insights and Forecast - by Types
- 10.2.1. Search Engine Optimization
- 10.2.2. Social Media Advertising
- 10.2.3. Others
- 10.1. Market Analysis, Insights and Forecast - by Application
- 11. Competitive Analysis
- 11.1. Global Market Share Analysis 2024
- 11.2. Company Profiles
- 11.2.1 BeyondNext
- 11.2.1.1. Overview
- 11.2.1.2. Products
- 11.2.1.3. SWOT Analysis
- 11.2.1.4. Recent Developments
- 11.2.1.5. Financials (Based on Availability)
- 11.2.2 Callbox
- 11.2.2.1. Overview
- 11.2.2.2. Products
- 11.2.2.3. SWOT Analysis
- 11.2.2.4. Recent Developments
- 11.2.2.5. Financials (Based on Availability)
- 11.2.3 Seeders
- 11.2.3.1. Overview
- 11.2.3.2. Products
- 11.2.3.3. SWOT Analysis
- 11.2.3.4. Recent Developments
- 11.2.3.5. Financials (Based on Availability)
- 11.2.4 Cross Border Digital
- 11.2.4.1. Overview
- 11.2.4.2. Products
- 11.2.4.3. SWOT Analysis
- 11.2.4.4. Recent Developments
- 11.2.4.5. Financials (Based on Availability)
- 11.2.5 IPG
- 11.2.5.1. Overview
- 11.2.5.2. Products
- 11.2.5.3. SWOT Analysis
- 11.2.5.4. Recent Developments
- 11.2.5.5. Financials (Based on Availability)
- 11.2.6 Publicis Groupe
- 11.2.6.1. Overview
- 11.2.6.2. Products
- 11.2.6.3. SWOT Analysis
- 11.2.6.4. Recent Developments
- 11.2.6.5. Financials (Based on Availability)
- 11.2.7 BlueFocus
- 11.2.7.1. Overview
- 11.2.7.2. Products
- 11.2.7.3. SWOT Analysis
- 11.2.7.4. Recent Developments
- 11.2.7.5. Financials (Based on Availability)
- 11.2.8 WPP
- 11.2.8.1. Overview
- 11.2.8.2. Products
- 11.2.8.3. SWOT Analysis
- 11.2.8.4. Recent Developments
- 11.2.8.5. Financials (Based on Availability)
- 11.2.9 Edelman
- 11.2.9.1. Overview
- 11.2.9.2. Products
- 11.2.9.3. SWOT Analysis
- 11.2.9.4. Recent Developments
- 11.2.9.5. Financials (Based on Availability)
- 11.2.10 Ketchum
- 11.2.10.1. Overview
- 11.2.10.2. Products
- 11.2.10.3. SWOT Analysis
- 11.2.10.4. Recent Developments
- 11.2.10.5. Financials (Based on Availability)
- 11.2.11 Zeno Group
- 11.2.11.1. Overview
- 11.2.11.2. Products
- 11.2.11.3. SWOT Analysis
- 11.2.11.4. Recent Developments
- 11.2.11.5. Financials (Based on Availability)
- 11.2.12 Fidsolid
- 11.2.12.1. Overview
- 11.2.12.2. Products
- 11.2.12.3. SWOT Analysis
- 11.2.12.4. Recent Developments
- 11.2.12.5. Financials (Based on Availability)
- 11.2.13 Omnicom Media Group
- 11.2.13.1. Overview
- 11.2.13.2. Products
- 11.2.13.3. SWOT Analysis
- 11.2.13.4. Recent Developments
- 11.2.13.5. Financials (Based on Availability)
- 11.2.14 Ketchum Public Relations
- 11.2.14.1. Overview
- 11.2.14.2. Products
- 11.2.14.3. SWOT Analysis
- 11.2.14.4. Recent Developments
- 11.2.14.5. Financials (Based on Availability)
- 11.2.15 MSL
- 11.2.15.1. Overview
- 11.2.15.2. Products
- 11.2.15.3. SWOT Analysis
- 11.2.15.4. Recent Developments
- 11.2.15.5. Financials (Based on Availability)
- 11.2.16 Premiere Consulting Group
- 11.2.16.1. Overview
- 11.2.16.2. Products
- 11.2.16.3. SWOT Analysis
- 11.2.16.4. Recent Developments
- 11.2.16.5. Financials (Based on Availability)
- 11.2.17 AMBITIOUS PR
- 11.2.17.1. Overview
- 11.2.17.2. Products
- 11.2.17.3. SWOT Analysis
- 11.2.17.4. Recent Developments
- 11.2.17.5. Financials (Based on Availability)
- 11.2.18 GlobalCom PR Network
- 11.2.18.1. Overview
- 11.2.18.2. Products
- 11.2.18.3. SWOT Analysis
- 11.2.18.4. Recent Developments
- 11.2.18.5. Financials (Based on Availability)
- 11.2.1 BeyondNext
List of Figures
- Figure 1: Global Cross Border Marketing Service Revenue Breakdown (million, %) by Region 2024 & 2032
- Figure 2: North America Cross Border Marketing Service Revenue (million), by Application 2024 & 2032
- Figure 3: North America Cross Border Marketing Service Revenue Share (%), by Application 2024 & 2032
- Figure 4: North America Cross Border Marketing Service Revenue (million), by Types 2024 & 2032
- Figure 5: North America Cross Border Marketing Service Revenue Share (%), by Types 2024 & 2032
- Figure 6: North America Cross Border Marketing Service Revenue (million), by Country 2024 & 2032
- Figure 7: North America Cross Border Marketing Service Revenue Share (%), by Country 2024 & 2032
- Figure 8: South America Cross Border Marketing Service Revenue (million), by Application 2024 & 2032
- Figure 9: South America Cross Border Marketing Service Revenue Share (%), by Application 2024 & 2032
- Figure 10: South America Cross Border Marketing Service Revenue (million), by Types 2024 & 2032
- Figure 11: South America Cross Border Marketing Service Revenue Share (%), by Types 2024 & 2032
- Figure 12: South America Cross Border Marketing Service Revenue (million), by Country 2024 & 2032
- Figure 13: South America Cross Border Marketing Service Revenue Share (%), by Country 2024 & 2032
- Figure 14: Europe Cross Border Marketing Service Revenue (million), by Application 2024 & 2032
- Figure 15: Europe Cross Border Marketing Service Revenue Share (%), by Application 2024 & 2032
- Figure 16: Europe Cross Border Marketing Service Revenue (million), by Types 2024 & 2032
- Figure 17: Europe Cross Border Marketing Service Revenue Share (%), by Types 2024 & 2032
- Figure 18: Europe Cross Border Marketing Service Revenue (million), by Country 2024 & 2032
- Figure 19: Europe Cross Border Marketing Service Revenue Share (%), by Country 2024 & 2032
- Figure 20: Middle East & Africa Cross Border Marketing Service Revenue (million), by Application 2024 & 2032
- Figure 21: Middle East & Africa Cross Border Marketing Service Revenue Share (%), by Application 2024 & 2032
- Figure 22: Middle East & Africa Cross Border Marketing Service Revenue (million), by Types 2024 & 2032
- Figure 23: Middle East & Africa Cross Border Marketing Service Revenue Share (%), by Types 2024 & 2032
- Figure 24: Middle East & Africa Cross Border Marketing Service Revenue (million), by Country 2024 & 2032
- Figure 25: Middle East & Africa Cross Border Marketing Service Revenue Share (%), by Country 2024 & 2032
- Figure 26: Asia Pacific Cross Border Marketing Service Revenue (million), by Application 2024 & 2032
- Figure 27: Asia Pacific Cross Border Marketing Service Revenue Share (%), by Application 2024 & 2032
- Figure 28: Asia Pacific Cross Border Marketing Service Revenue (million), by Types 2024 & 2032
- Figure 29: Asia Pacific Cross Border Marketing Service Revenue Share (%), by Types 2024 & 2032
- Figure 30: Asia Pacific Cross Border Marketing Service Revenue (million), by Country 2024 & 2032
- Figure 31: Asia Pacific Cross Border Marketing Service Revenue Share (%), by Country 2024 & 2032
List of Tables
- Table 1: Global Cross Border Marketing Service Revenue million Forecast, by Region 2019 & 2032
- Table 2: Global Cross Border Marketing Service Revenue million Forecast, by Application 2019 & 2032
- Table 3: Global Cross Border Marketing Service Revenue million Forecast, by Types 2019 & 2032
- Table 4: Global Cross Border Marketing Service Revenue million Forecast, by Region 2019 & 2032
- Table 5: Global Cross Border Marketing Service Revenue million Forecast, by Application 2019 & 2032
- Table 6: Global Cross Border Marketing Service Revenue million Forecast, by Types 2019 & 2032
- Table 7: Global Cross Border Marketing Service Revenue million Forecast, by Country 2019 & 2032
- Table 8: United States Cross Border Marketing Service Revenue (million) Forecast, by Application 2019 & 2032
- Table 9: Canada Cross Border Marketing Service Revenue (million) Forecast, by Application 2019 & 2032
- Table 10: Mexico Cross Border Marketing Service Revenue (million) Forecast, by Application 2019 & 2032
- Table 11: Global Cross Border Marketing Service Revenue million Forecast, by Application 2019 & 2032
- Table 12: Global Cross Border Marketing Service Revenue million Forecast, by Types 2019 & 2032
- Table 13: Global Cross Border Marketing Service Revenue million Forecast, by Country 2019 & 2032
- Table 14: Brazil Cross Border Marketing Service Revenue (million) Forecast, by Application 2019 & 2032
- Table 15: Argentina Cross Border Marketing Service Revenue (million) Forecast, by Application 2019 & 2032
- Table 16: Rest of South America Cross Border Marketing Service Revenue (million) Forecast, by Application 2019 & 2032
- Table 17: Global Cross Border Marketing Service Revenue million Forecast, by Application 2019 & 2032
- Table 18: Global Cross Border Marketing Service Revenue million Forecast, by Types 2019 & 2032
- Table 19: Global Cross Border Marketing Service Revenue million Forecast, by Country 2019 & 2032
- Table 20: United Kingdom Cross Border Marketing Service Revenue (million) Forecast, by Application 2019 & 2032
- Table 21: Germany Cross Border Marketing Service Revenue (million) Forecast, by Application 2019 & 2032
- Table 22: France Cross Border Marketing Service Revenue (million) Forecast, by Application 2019 & 2032
- Table 23: Italy Cross Border Marketing Service Revenue (million) Forecast, by Application 2019 & 2032
- Table 24: Spain Cross Border Marketing Service Revenue (million) Forecast, by Application 2019 & 2032
- Table 25: Russia Cross Border Marketing Service Revenue (million) Forecast, by Application 2019 & 2032
- Table 26: Benelux Cross Border Marketing Service Revenue (million) Forecast, by Application 2019 & 2032
- Table 27: Nordics Cross Border Marketing Service Revenue (million) Forecast, by Application 2019 & 2032
- Table 28: Rest of Europe Cross Border Marketing Service Revenue (million) Forecast, by Application 2019 & 2032
- Table 29: Global Cross Border Marketing Service Revenue million Forecast, by Application 2019 & 2032
- Table 30: Global Cross Border Marketing Service Revenue million Forecast, by Types 2019 & 2032
- Table 31: Global Cross Border Marketing Service Revenue million Forecast, by Country 2019 & 2032
- Table 32: Turkey Cross Border Marketing Service Revenue (million) Forecast, by Application 2019 & 2032
- Table 33: Israel Cross Border Marketing Service Revenue (million) Forecast, by Application 2019 & 2032
- Table 34: GCC Cross Border Marketing Service Revenue (million) Forecast, by Application 2019 & 2032
- Table 35: North Africa Cross Border Marketing Service Revenue (million) Forecast, by Application 2019 & 2032
- Table 36: South Africa Cross Border Marketing Service Revenue (million) Forecast, by Application 2019 & 2032
- Table 37: Rest of Middle East & Africa Cross Border Marketing Service Revenue (million) Forecast, by Application 2019 & 2032
- Table 38: Global Cross Border Marketing Service Revenue million Forecast, by Application 2019 & 2032
- Table 39: Global Cross Border Marketing Service Revenue million Forecast, by Types 2019 & 2032
- Table 40: Global Cross Border Marketing Service Revenue million Forecast, by Country 2019 & 2032
- Table 41: China Cross Border Marketing Service Revenue (million) Forecast, by Application 2019 & 2032
- Table 42: India Cross Border Marketing Service Revenue (million) Forecast, by Application 2019 & 2032
- Table 43: Japan Cross Border Marketing Service Revenue (million) Forecast, by Application 2019 & 2032
- Table 44: South Korea Cross Border Marketing Service Revenue (million) Forecast, by Application 2019 & 2032
- Table 45: ASEAN Cross Border Marketing Service Revenue (million) Forecast, by Application 2019 & 2032
- Table 46: Oceania Cross Border Marketing Service Revenue (million) Forecast, by Application 2019 & 2032
- Table 47: Rest of Asia Pacific Cross Border Marketing Service Revenue (million) Forecast, by Application 2019 & 2032
Frequently Asked Questions
1. What is the projected Compound Annual Growth Rate (CAGR) of the Cross Border Marketing Service?
The projected CAGR is approximately XX%.
2. Which companies are prominent players in the Cross Border Marketing Service?
Key companies in the market include BeyondNext, Callbox, Seeders, Cross Border Digital, IPG, Publicis Groupe, BlueFocus, WPP, Edelman, Ketchum, Zeno Group, Fidsolid, Omnicom Media Group, Ketchum Public Relations, MSL, Premiere Consulting Group, AMBITIOUS PR, GlobalCom PR Network.
3. What are the main segments of the Cross Border Marketing Service?
The market segments include Application, Types.
4. Can you provide details about the market size?
The market size is estimated to be USD XXX million as of 2022.
5. What are some drivers contributing to market growth?
N/A
6. What are the notable trends driving market growth?
N/A
7. Are there any restraints impacting market growth?
N/A
8. Can you provide examples of recent developments in the market?
N/A
9. What pricing options are available for accessing the report?
Pricing options include single-user, multi-user, and enterprise licenses priced at USD 4900.00, USD 7350.00, and USD 9800.00 respectively.
10. Is the market size provided in terms of value or volume?
The market size is provided in terms of value, measured in million.
11. Are there any specific market keywords associated with the report?
Yes, the market keyword associated with the report is "Cross Border Marketing Service," which aids in identifying and referencing the specific market segment covered.
12. How do I determine which pricing option suits my needs best?
The pricing options vary based on user requirements and access needs. Individual users may opt for single-user licenses, while businesses requiring broader access may choose multi-user or enterprise licenses for cost-effective access to the report.
13. Are there any additional resources or data provided in the Cross Border Marketing Service report?
While the report offers comprehensive insights, it's advisable to review the specific contents or supplementary materials provided to ascertain if additional resources or data are available.
14. How can I stay updated on further developments or reports in the Cross Border Marketing Service?
To stay informed about further developments, trends, and reports in the Cross Border Marketing Service, consider subscribing to industry newsletters, following relevant companies and organizations, or regularly checking reputable industry news sources and publications.
Methodology
Step 1 - Identification of Relevant Samples Size from Population Database


Step 2 - Approaches for Defining Global Market Size (Value, Volume* & Price*)

Note*: In applicable scenarios
Step 3 - Data Sources
Primary Research
- Web Analytics
- Survey Reports
- Research Institute
- Latest Research Reports
- Opinion Leaders
Secondary Research
- Annual Reports
- White Paper
- Latest Press Release
- Industry Association
- Paid Database
- Investor Presentations

Step 4 - Data Triangulation
Involves using different sources of information in order to increase the validity of a study
These sources are likely to be stakeholders in a program - participants, other researchers, program staff, other community members, and so on.
Then we put all data in single framework & apply various statistical tools to find out the dynamic on the market.
During the analysis stage, feedback from the stakeholder groups would be compared to determine areas of agreement as well as areas of divergence
