

Key Insights
The global Cup Carrier Packaging market is projected for substantial growth, expected to reach 373.6 million by 2025, with a Compound Annual Growth Rate (CAGR) of 4.7 from 2025 to 2033. Key growth drivers include the rising trend of on-the-go consumption, the expanding food delivery sector, and the increasing number of coffee shops and quick-service restaurants. These businesses require reliable cup carriers to safely transport multiple beverages, improving customer convenience and preventing spills.
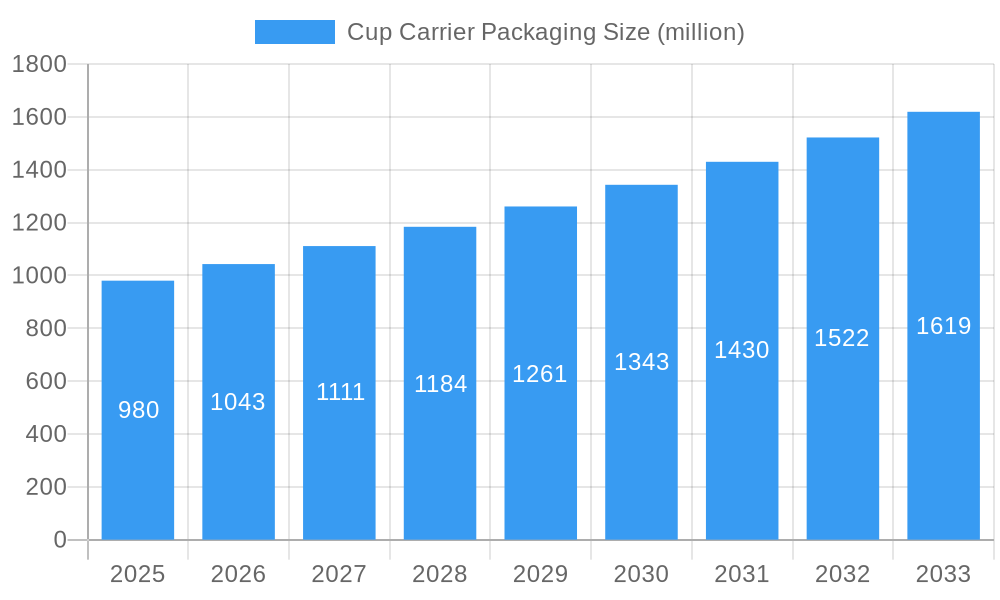
Cup Carrier Packaging Market Size (In Million)
Dominant market segments include Coffee Shops and Food Retail Outlets, driven by high beverage sales volumes. Paper & Paperboard and Molded Fiber are gaining traction due to their sustainable properties and growing consumer demand for eco-friendly packaging. While plastic carriers remain common, the market is seeing a significant shift towards biodegradable and recyclable alternatives. Potential restraints include raw material price volatility and competitive pressures. However, ongoing innovation in design, materials, and branding is poised to drive sustained market expansion and value.
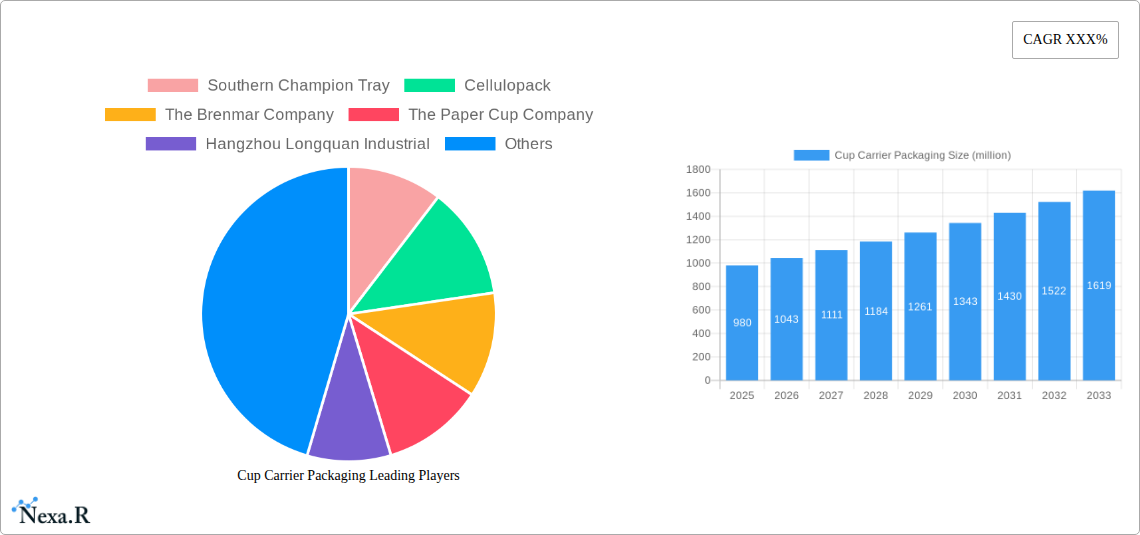
Cup Carrier Packaging Company Market Share
Comprehensive Report: Cup Carrier Packaging Market Analysis & Forecast (2019-2033)
This in-depth report provides an exhaustive analysis of the global Cup Carrier Packaging market, offering critical insights for industry stakeholders. Covering the historical period from 2019 to 2024 and forecasting growth through 2033, this study delivers granular data and expert analysis on market dynamics, growth trends, regional dominance, product landscape, and key players. With a focus on both parent and child markets, this report is your definitive guide to navigating the evolving cup carrier packaging industry.
Cup Carrier Packaging Market Dynamics & Structure
The global Cup Carrier Packaging market exhibits a moderately consolidated structure, with a few dominant players and a significant number of regional manufacturers. Technological innovation is a key driver, particularly in the development of sustainable and eco-friendly materials like molded fiber and advanced paperboard solutions. Regulatory frameworks are increasingly favoring sustainable packaging options, influencing material choices and design specifications. Competitive product substitutes include reusable cup sleeves and direct bottle/can holders, posing a challenge to traditional cup carriers. End-user demographics are shifting towards convenience and on-the-go consumption, fueling demand from coffee shops and food retail outlets. Mergers and acquisitions (M&A) trends indicate a strategic consolidation to enhance market reach and technological capabilities.
- Market Concentration: Top 5 players hold approximately 35-40% market share, with continued M&A activity expected to increase concentration in specific segments.
- Technological Innovation: Focus on biodegradable materials, improved structural integrity for multi-cup carrying, and custom branding solutions.
- Regulatory Frameworks: Growing emphasis on plastic reduction and recyclability mandates across North America and Europe.
- Competitive Substitutes: Reusable carriers and direct beverage packaging solutions are gaining traction, particularly among environmentally conscious consumers.
- End-User Demographics: Millennial and Gen Z consumers, with their mobile lifestyles and preference for convenience, are primary drivers of demand.
- M&A Trends: Notable M&A activities in the historical period (2019-2024) aimed at expanding product portfolios and market access, with an estimated XX deal volumes.
Cup Carrier Packaging Growth Trends & Insights
The global Cup Carrier Packaging market is poised for significant expansion, driven by evolving consumer lifestyles, the burgeoning food and beverage industry, and an increasing focus on sustainable packaging solutions. The market size is projected to grow from an estimated USD 1,800 million in the base year 2025, reaching USD 2,500 million by 2033, exhibiting a Compound Annual Growth Rate (CAGR) of approximately 4.2% during the forecast period. Adoption rates for innovative and eco-friendly cup carriers are accelerating, especially within urban centers and areas with a high concentration of coffee shops and quick-service restaurants. Technological disruptions are primarily centered around material science, leading to lighter, more durable, and compostable packaging options. Consumer behavior shifts, including a greater demand for convenience, single-use portioning, and personalized branding, are directly influencing the design and functionality of cup carriers. The widespread adoption of e-commerce and food delivery services further augments the need for robust and efficient beverage transportation solutions, making cup carriers an indispensable component of the takeaway and delivery ecosystem. The increasing popularity of specialty coffees and diverse beverage options also contributes to the demand for carriers capable of accommodating various cup sizes and configurations.
Dominant Regions, Countries, or Segments in Cup Carrier Packaging
The North America region is currently the dominant force in the global Cup Carrier Packaging market, driven by its mature food service industry, high per capita consumption of beverages, and strong consumer preference for convenience. The United States, in particular, leads market growth due to its extensive network of coffee shops, fast-food chains, and a deeply ingrained culture of on-the-go consumption. Within North America, Coffee Shops represent the largest application segment, accounting for an estimated 45% of the total market demand. This dominance is fueled by the sheer volume of single-serve beverages purchased daily and the constant need for reliable carriers.
- Leading Region: North America, projected to hold over 35% of the global market share in 2025.
- Key Drivers: High disposable income, extensive food service infrastructure, strong consumer demand for convenience, and widespread adoption of branded takeaway beverages.
- Dominance Factors: Proactive adoption of sustainable packaging trends and a well-established supply chain network.
- Dominant Application Segment: Coffee Shops (estimated market share of 45% in 2025).
- Key Drivers: Ubiquitous presence of major coffee chains, high daily foot traffic, and the need for efficient multi-cup carrying solutions.
- Growth Potential: Continued expansion of specialty coffee culture and increasing demand for iced and hot beverage portability.
- Dominant Type Segment: Paper & Paperboard (estimated market share of 60% in 2025).
- Key Drivers: Cost-effectiveness, recyclability, printability for branding, and a wide range of structural designs available.
- Growth Potential: Innovation in sustainable paperboard options, including recycled content and biodegradable coatings, catering to increasing environmental awareness.
Cup Carrier Packaging Product Landscape
The product landscape for cup carriers is characterized by continuous innovation aimed at enhancing functionality, sustainability, and brand visibility. Paper and paperboard carriers remain prevalent due to their versatility, recyclability, and cost-effectiveness, with advancements focusing on improved strength and leak resistance. Molded fiber carriers are gaining traction as an eco-friendly alternative, offering excellent insulation and a premium feel. Manufacturers are also exploring hybrid designs incorporating compostable bioplastics for added durability and water resistance. Unique selling propositions often revolve around ergonomic designs for comfortable carrying, customizable branding options for promotional purposes, and stackable configurations for efficient storage and transport. Technological advancements are also being made in automated packaging solutions to streamline operations for high-volume food service providers.
Key Drivers, Barriers & Challenges in Cup Carrier Packaging
Key Drivers: The Cup Carrier Packaging market is propelled by several key drivers. The burgeoning food and beverage industry, particularly the growth of coffee shops and quick-service restaurants, directly fuels demand. The increasing consumer preference for convenience and on-the-go consumption further solidifies the need for effective cup carriers. Technological advancements in material science, leading to more sustainable, durable, and cost-effective packaging solutions, also play a crucial role. Furthermore, the growing trend of personalized branding and promotional activities by businesses creates opportunities for custom-designed carriers.
Barriers & Challenges: Despite robust growth, the market faces several barriers and challenges. Fluctuations in raw material prices, particularly for paper and pulp, can impact manufacturing costs and profitability. Stringent environmental regulations and the push for plastic reduction, while a driver for sustainable alternatives, also present challenges in adapting existing production lines and sourcing compliant materials. Intense competition among manufacturers and the constant need for innovation to stay ahead of market trends can create pricing pressures. Supply chain disruptions, exacerbated by global events, can affect the availability and timely delivery of essential materials. Finally, the cost of implementing new, eco-friendly technologies can be a barrier for smaller players.
Emerging Opportunities in Cup Carrier Packaging
Emerging opportunities in the Cup Carrier Packaging market lie in the untapped potential of developing economies with rapidly growing food service sectors. The demand for innovative, customizable, and visually appealing packaging is on the rise, presenting opportunities for niche manufacturers. The integration of smart packaging technologies, such as QR codes for loyalty programs or product information, is an evolving trend. Furthermore, the increasing consumer consciousness towards environmental impact is creating a significant demand for fully compostable or biodegradable cup carriers, offering a substantial opportunity for companies investing in sustainable material research and development. The expansion of the food delivery ecosystem also necessitates the development of carriers that ensure beverage integrity during transit.
Growth Accelerators in the Cup Carrier Packaging Industry
Several catalysts are accelerating growth in the Cup Carrier Packaging industry. Technological breakthroughs in the development of lightweight yet robust biodegradable materials are a significant growth accelerator, enabling wider adoption of sustainable options. Strategic partnerships between packaging manufacturers and major food and beverage chains for exclusive supply contracts are further solidifying market positions and driving volume. Market expansion strategies targeting underserved geographical regions with a rising middle class and increasing disposable income are also contributing to growth. The continuous innovation in product design, focusing on enhanced ergonomics and multi-functional capabilities, is also a key accelerator, meeting evolving consumer needs and operational efficiencies for businesses.
Key Players Shaping the Cup Carrier Packaging Market
- Southern Champion Tray
- Cellulopack
- The Brenmar Company
- The Paper Cup Company
- Hangzhou Longquan Industrial
- The VaioPak Group
- E-Package Creation & Solution Manufacturing
- Shenzhen CyGedin Printing & Packaging
Notable Milestones in Cup Carrier Packaging Sector
- 2019: Southern Champion Tray launches a new line of PFAS-free paperboard cup carriers, addressing growing environmental concerns.
- 2020: Cellulopack introduces its patented molded fiber cup carrier, showcasing enhanced insulation properties.
- 2021: The Paper Cup Company expands its custom printing capabilities for cup carriers, catering to the increasing demand for branded packaging.
- 2022: Hangzhou Longquan Industrial invests in advanced machinery to increase production capacity for sustainable cup carriers.
- 2023: The VaioPak Group acquires a smaller competitor to expand its geographical reach and product portfolio in North America.
- 2024: E-Package Creation & Solution Manufacturing pioneers the development of a compostable bioplastic coating for paperboard cup carriers.
In-Depth Cup Carrier Packaging Market Outlook
The outlook for the Cup Carrier Packaging market is highly optimistic, driven by sustained growth in the food service sector and a global shift towards sustainable consumption. Key growth accelerators, including advancements in biodegradable materials and strategic industry collaborations, will continue to propel market expansion. The increasing focus on convenience and on-the-go lifestyles, coupled with the rise of specialized beverage offerings, ensures a consistent demand for innovative and functional cup carriers. Future market potential lies in the continuous development of customizable, eco-friendly solutions that align with evolving consumer preferences and regulatory mandates, creating significant opportunities for market leaders to innovate and capture market share.
Cup Carrier Packaging Segmentation
-
1. Application
- 1.1. Coffee Shops
- 1.2. Food Retail Outlets
- 1.3. Restaurants
- 1.4. Movie Halls
- 1.5. Sports Stadium
- 1.6. Others
-
2. Type
- 2.1. Paper & Paperboard
- 2.2. Molded Fiber
- 2.3. Metal
- 2.4. Plastic
- 2.5. Others
Cup Carrier Packaging Segmentation By Geography
-
1. North America
- 1.1. United States
- 1.2. Canada
- 1.3. Mexico
-
2. South America
- 2.1. Brazil
- 2.2. Argentina
- 2.3. Rest of South America
-
3. Europe
- 3.1. United Kingdom
- 3.2. Germany
- 3.3. France
- 3.4. Italy
- 3.5. Spain
- 3.6. Russia
- 3.7. Benelux
- 3.8. Nordics
- 3.9. Rest of Europe
-
4. Middle East & Africa
- 4.1. Turkey
- 4.2. Israel
- 4.3. GCC
- 4.4. North Africa
- 4.5. South Africa
- 4.6. Rest of Middle East & Africa
-
5. Asia Pacific
- 5.1. China
- 5.2. India
- 5.3. Japan
- 5.4. South Korea
- 5.5. ASEAN
- 5.6. Oceania
- 5.7. Rest of Asia Pacific
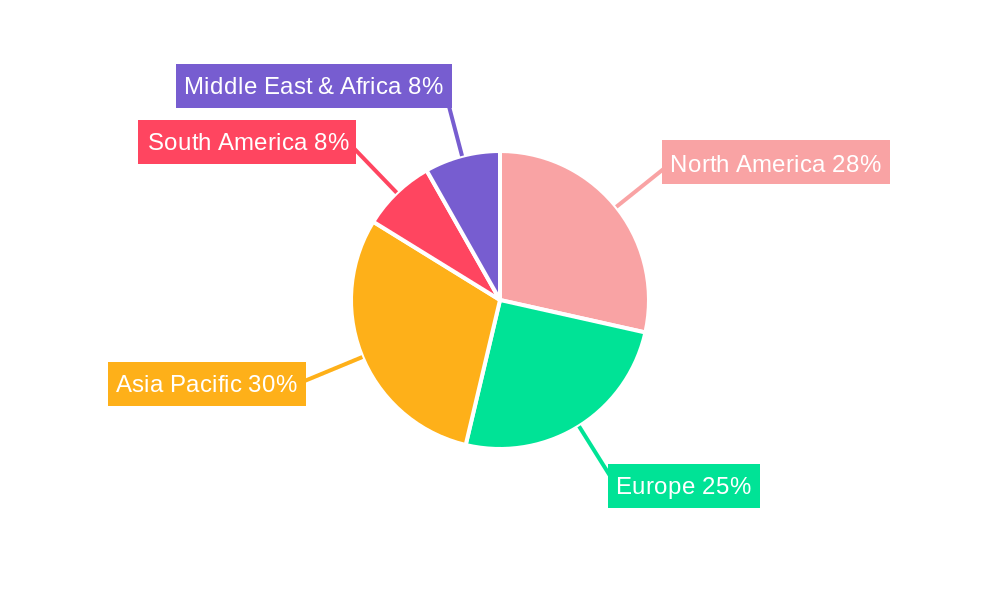
Cup Carrier Packaging Regional Market Share
Geographic Coverage of Cup Carrier Packaging
Cup Carrier Packaging REPORT HIGHLIGHTS
| Aspects | Details |
|---|---|
| Study Period | 2020-2034 |
| Base Year | 2025 |
| Estimated Year | 2026 |
| Forecast Period | 2026-2034 |
| Historical Period | 2020-2025 |
| Growth Rate | CAGR of 4.7% from 2020-2034 |
| Segmentation |
|
Table of Contents
- 1. Introduction
- 1.1. Research Scope
- 1.2. Market Segmentation
- 1.3. Research Methodology
- 1.4. Definitions and Assumptions
- 2. Executive Summary
- 2.1. Introduction
- 3. Market Dynamics
- 3.1. Introduction
- 3.2. Market Drivers
- 3.3. Market Restrains
- 3.4. Market Trends
- 4. Market Factor Analysis
- 4.1. Porters Five Forces
- 4.2. Supply/Value Chain
- 4.3. PESTEL analysis
- 4.4. Market Entropy
- 4.5. Patent/Trademark Analysis
- 5. Global Cup Carrier Packaging Analysis, Insights and Forecast, 2020-2032
- 5.1. Market Analysis, Insights and Forecast - by Application
- 5.1.1. Coffee Shops
- 5.1.2. Food Retail Outlets
- 5.1.3. Restaurants
- 5.1.4. Movie Halls
- 5.1.5. Sports Stadium
- 5.1.6. Others
- 5.2. Market Analysis, Insights and Forecast - by Type
- 5.2.1. Paper & Paperboard
- 5.2.2. Molded Fiber
- 5.2.3. Metal
- 5.2.4. Plastic
- 5.2.5. Others
- 5.3. Market Analysis, Insights and Forecast - by Region
- 5.3.1. North America
- 5.3.2. South America
- 5.3.3. Europe
- 5.3.4. Middle East & Africa
- 5.3.5. Asia Pacific
- 5.1. Market Analysis, Insights and Forecast - by Application
- 6. North America Cup Carrier Packaging Analysis, Insights and Forecast, 2020-2032
- 6.1. Market Analysis, Insights and Forecast - by Application
- 6.1.1. Coffee Shops
- 6.1.2. Food Retail Outlets
- 6.1.3. Restaurants
- 6.1.4. Movie Halls
- 6.1.5. Sports Stadium
- 6.1.6. Others
- 6.2. Market Analysis, Insights and Forecast - by Type
- 6.2.1. Paper & Paperboard
- 6.2.2. Molded Fiber
- 6.2.3. Metal
- 6.2.4. Plastic
- 6.2.5. Others
- 6.1. Market Analysis, Insights and Forecast - by Application
- 7. South America Cup Carrier Packaging Analysis, Insights and Forecast, 2020-2032
- 7.1. Market Analysis, Insights and Forecast - by Application
- 7.1.1. Coffee Shops
- 7.1.2. Food Retail Outlets
- 7.1.3. Restaurants
- 7.1.4. Movie Halls
- 7.1.5. Sports Stadium
- 7.1.6. Others
- 7.2. Market Analysis, Insights and Forecast - by Type
- 7.2.1. Paper & Paperboard
- 7.2.2. Molded Fiber
- 7.2.3. Metal
- 7.2.4. Plastic
- 7.2.5. Others
- 7.1. Market Analysis, Insights and Forecast - by Application
- 8. Europe Cup Carrier Packaging Analysis, Insights and Forecast, 2020-2032
- 8.1. Market Analysis, Insights and Forecast - by Application
- 8.1.1. Coffee Shops
- 8.1.2. Food Retail Outlets
- 8.1.3. Restaurants
- 8.1.4. Movie Halls
- 8.1.5. Sports Stadium
- 8.1.6. Others
- 8.2. Market Analysis, Insights and Forecast - by Type
- 8.2.1. Paper & Paperboard
- 8.2.2. Molded Fiber
- 8.2.3. Metal
- 8.2.4. Plastic
- 8.2.5. Others
- 8.1. Market Analysis, Insights and Forecast - by Application
- 9. Middle East & Africa Cup Carrier Packaging Analysis, Insights and Forecast, 2020-2032
- 9.1. Market Analysis, Insights and Forecast - by Application
- 9.1.1. Coffee Shops
- 9.1.2. Food Retail Outlets
- 9.1.3. Restaurants
- 9.1.4. Movie Halls
- 9.1.5. Sports Stadium
- 9.1.6. Others
- 9.2. Market Analysis, Insights and Forecast - by Type
- 9.2.1. Paper & Paperboard
- 9.2.2. Molded Fiber
- 9.2.3. Metal
- 9.2.4. Plastic
- 9.2.5. Others
- 9.1. Market Analysis, Insights and Forecast - by Application
- 10. Asia Pacific Cup Carrier Packaging Analysis, Insights and Forecast, 2020-2032
- 10.1. Market Analysis, Insights and Forecast - by Application
- 10.1.1. Coffee Shops
- 10.1.2. Food Retail Outlets
- 10.1.3. Restaurants
- 10.1.4. Movie Halls
- 10.1.5. Sports Stadium
- 10.1.6. Others
- 10.2. Market Analysis, Insights and Forecast - by Type
- 10.2.1. Paper & Paperboard
- 10.2.2. Molded Fiber
- 10.2.3. Metal
- 10.2.4. Plastic
- 10.2.5. Others
- 10.1. Market Analysis, Insights and Forecast - by Application
- 11. Competitive Analysis
- 11.1. Global Market Share Analysis 2025
- 11.2. Company Profiles
- 11.2.1 Southern Champion Tray
- 11.2.1.1. Overview
- 11.2.1.2. Products
- 11.2.1.3. SWOT Analysis
- 11.2.1.4. Recent Developments
- 11.2.1.5. Financials (Based on Availability)
- 11.2.2 Cellulopack
- 11.2.2.1. Overview
- 11.2.2.2. Products
- 11.2.2.3. SWOT Analysis
- 11.2.2.4. Recent Developments
- 11.2.2.5. Financials (Based on Availability)
- 11.2.3 The Brenmar Company
- 11.2.3.1. Overview
- 11.2.3.2. Products
- 11.2.3.3. SWOT Analysis
- 11.2.3.4. Recent Developments
- 11.2.3.5. Financials (Based on Availability)
- 11.2.4 The Paper Cup Company
- 11.2.4.1. Overview
- 11.2.4.2. Products
- 11.2.4.3. SWOT Analysis
- 11.2.4.4. Recent Developments
- 11.2.4.5. Financials (Based on Availability)
- 11.2.5 Hangzhou Longquan Industrial
- 11.2.5.1. Overview
- 11.2.5.2. Products
- 11.2.5.3. SWOT Analysis
- 11.2.5.4. Recent Developments
- 11.2.5.5. Financials (Based on Availability)
- 11.2.6 The VaioPak Group
- 11.2.6.1. Overview
- 11.2.6.2. Products
- 11.2.6.3. SWOT Analysis
- 11.2.6.4. Recent Developments
- 11.2.6.5. Financials (Based on Availability)
- 11.2.7 E-Package Creation & Solution Manufacturing
- 11.2.7.1. Overview
- 11.2.7.2. Products
- 11.2.7.3. SWOT Analysis
- 11.2.7.4. Recent Developments
- 11.2.7.5. Financials (Based on Availability)
- 11.2.8 Shenzhen CyGedin Printing & Packaging
- 11.2.8.1. Overview
- 11.2.8.2. Products
- 11.2.8.3. SWOT Analysis
- 11.2.8.4. Recent Developments
- 11.2.8.5. Financials (Based on Availability)
- 11.2.1 Southern Champion Tray
List of Figures
- Figure 1: Global Cup Carrier Packaging Revenue Breakdown (million, %) by Region 2025 & 2033
- Figure 2: North America Cup Carrier Packaging Revenue (million), by Application 2025 & 2033
- Figure 3: North America Cup Carrier Packaging Revenue Share (%), by Application 2025 & 2033
- Figure 4: North America Cup Carrier Packaging Revenue (million), by Type 2025 & 2033
- Figure 5: North America Cup Carrier Packaging Revenue Share (%), by Type 2025 & 2033
- Figure 6: North America Cup Carrier Packaging Revenue (million), by Country 2025 & 2033
- Figure 7: North America Cup Carrier Packaging Revenue Share (%), by Country 2025 & 2033
- Figure 8: South America Cup Carrier Packaging Revenue (million), by Application 2025 & 2033
- Figure 9: South America Cup Carrier Packaging Revenue Share (%), by Application 2025 & 2033
- Figure 10: South America Cup Carrier Packaging Revenue (million), by Type 2025 & 2033
- Figure 11: South America Cup Carrier Packaging Revenue Share (%), by Type 2025 & 2033
- Figure 12: South America Cup Carrier Packaging Revenue (million), by Country 2025 & 2033
- Figure 13: South America Cup Carrier Packaging Revenue Share (%), by Country 2025 & 2033
- Figure 14: Europe Cup Carrier Packaging Revenue (million), by Application 2025 & 2033
- Figure 15: Europe Cup Carrier Packaging Revenue Share (%), by Application 2025 & 2033
- Figure 16: Europe Cup Carrier Packaging Revenue (million), by Type 2025 & 2033
- Figure 17: Europe Cup Carrier Packaging Revenue Share (%), by Type 2025 & 2033
- Figure 18: Europe Cup Carrier Packaging Revenue (million), by Country 2025 & 2033
- Figure 19: Europe Cup Carrier Packaging Revenue Share (%), by Country 2025 & 2033
- Figure 20: Middle East & Africa Cup Carrier Packaging Revenue (million), by Application 2025 & 2033
- Figure 21: Middle East & Africa Cup Carrier Packaging Revenue Share (%), by Application 2025 & 2033
- Figure 22: Middle East & Africa Cup Carrier Packaging Revenue (million), by Type 2025 & 2033
- Figure 23: Middle East & Africa Cup Carrier Packaging Revenue Share (%), by Type 2025 & 2033
- Figure 24: Middle East & Africa Cup Carrier Packaging Revenue (million), by Country 2025 & 2033
- Figure 25: Middle East & Africa Cup Carrier Packaging Revenue Share (%), by Country 2025 & 2033
- Figure 26: Asia Pacific Cup Carrier Packaging Revenue (million), by Application 2025 & 2033
- Figure 27: Asia Pacific Cup Carrier Packaging Revenue Share (%), by Application 2025 & 2033
- Figure 28: Asia Pacific Cup Carrier Packaging Revenue (million), by Type 2025 & 2033
- Figure 29: Asia Pacific Cup Carrier Packaging Revenue Share (%), by Type 2025 & 2033
- Figure 30: Asia Pacific Cup Carrier Packaging Revenue (million), by Country 2025 & 2033
- Figure 31: Asia Pacific Cup Carrier Packaging Revenue Share (%), by Country 2025 & 2033
List of Tables
- Table 1: Global Cup Carrier Packaging Revenue million Forecast, by Application 2020 & 2033
- Table 2: Global Cup Carrier Packaging Revenue million Forecast, by Type 2020 & 2033
- Table 3: Global Cup Carrier Packaging Revenue million Forecast, by Region 2020 & 2033
- Table 4: Global Cup Carrier Packaging Revenue million Forecast, by Application 2020 & 2033
- Table 5: Global Cup Carrier Packaging Revenue million Forecast, by Type 2020 & 2033
- Table 6: Global Cup Carrier Packaging Revenue million Forecast, by Country 2020 & 2033
- Table 7: United States Cup Carrier Packaging Revenue (million) Forecast, by Application 2020 & 2033
- Table 8: Canada Cup Carrier Packaging Revenue (million) Forecast, by Application 2020 & 2033
- Table 9: Mexico Cup Carrier Packaging Revenue (million) Forecast, by Application 2020 & 2033
- Table 10: Global Cup Carrier Packaging Revenue million Forecast, by Application 2020 & 2033
- Table 11: Global Cup Carrier Packaging Revenue million Forecast, by Type 2020 & 2033
- Table 12: Global Cup Carrier Packaging Revenue million Forecast, by Country 2020 & 2033
- Table 13: Brazil Cup Carrier Packaging Revenue (million) Forecast, by Application 2020 & 2033
- Table 14: Argentina Cup Carrier Packaging Revenue (million) Forecast, by Application 2020 & 2033
- Table 15: Rest of South America Cup Carrier Packaging Revenue (million) Forecast, by Application 2020 & 2033
- Table 16: Global Cup Carrier Packaging Revenue million Forecast, by Application 2020 & 2033
- Table 17: Global Cup Carrier Packaging Revenue million Forecast, by Type 2020 & 2033
- Table 18: Global Cup Carrier Packaging Revenue million Forecast, by Country 2020 & 2033
- Table 19: United Kingdom Cup Carrier Packaging Revenue (million) Forecast, by Application 2020 & 2033
- Table 20: Germany Cup Carrier Packaging Revenue (million) Forecast, by Application 2020 & 2033
- Table 21: France Cup Carrier Packaging Revenue (million) Forecast, by Application 2020 & 2033
- Table 22: Italy Cup Carrier Packaging Revenue (million) Forecast, by Application 2020 & 2033
- Table 23: Spain Cup Carrier Packaging Revenue (million) Forecast, by Application 2020 & 2033
- Table 24: Russia Cup Carrier Packaging Revenue (million) Forecast, by Application 2020 & 2033
- Table 25: Benelux Cup Carrier Packaging Revenue (million) Forecast, by Application 2020 & 2033
- Table 26: Nordics Cup Carrier Packaging Revenue (million) Forecast, by Application 2020 & 2033
- Table 27: Rest of Europe Cup Carrier Packaging Revenue (million) Forecast, by Application 2020 & 2033
- Table 28: Global Cup Carrier Packaging Revenue million Forecast, by Application 2020 & 2033
- Table 29: Global Cup Carrier Packaging Revenue million Forecast, by Type 2020 & 2033
- Table 30: Global Cup Carrier Packaging Revenue million Forecast, by Country 2020 & 2033
- Table 31: Turkey Cup Carrier Packaging Revenue (million) Forecast, by Application 2020 & 2033
- Table 32: Israel Cup Carrier Packaging Revenue (million) Forecast, by Application 2020 & 2033
- Table 33: GCC Cup Carrier Packaging Revenue (million) Forecast, by Application 2020 & 2033
- Table 34: North Africa Cup Carrier Packaging Revenue (million) Forecast, by Application 2020 & 2033
- Table 35: South Africa Cup Carrier Packaging Revenue (million) Forecast, by Application 2020 & 2033
- Table 36: Rest of Middle East & Africa Cup Carrier Packaging Revenue (million) Forecast, by Application 2020 & 2033
- Table 37: Global Cup Carrier Packaging Revenue million Forecast, by Application 2020 & 2033
- Table 38: Global Cup Carrier Packaging Revenue million Forecast, by Type 2020 & 2033
- Table 39: Global Cup Carrier Packaging Revenue million Forecast, by Country 2020 & 2033
- Table 40: China Cup Carrier Packaging Revenue (million) Forecast, by Application 2020 & 2033
- Table 41: India Cup Carrier Packaging Revenue (million) Forecast, by Application 2020 & 2033
- Table 42: Japan Cup Carrier Packaging Revenue (million) Forecast, by Application 2020 & 2033
- Table 43: South Korea Cup Carrier Packaging Revenue (million) Forecast, by Application 2020 & 2033
- Table 44: ASEAN Cup Carrier Packaging Revenue (million) Forecast, by Application 2020 & 2033
- Table 45: Oceania Cup Carrier Packaging Revenue (million) Forecast, by Application 2020 & 2033
- Table 46: Rest of Asia Pacific Cup Carrier Packaging Revenue (million) Forecast, by Application 2020 & 2033
Frequently Asked Questions
1. What is the projected Compound Annual Growth Rate (CAGR) of the Cup Carrier Packaging?
The projected CAGR is approximately 4.7%.
2. Which companies are prominent players in the Cup Carrier Packaging?
Key companies in the market include Southern Champion Tray, Cellulopack, The Brenmar Company, The Paper Cup Company, Hangzhou Longquan Industrial, The VaioPak Group, E-Package Creation & Solution Manufacturing, Shenzhen CyGedin Printing & Packaging.
3. What are the main segments of the Cup Carrier Packaging?
The market segments include Application, Type.
4. Can you provide details about the market size?
The market size is estimated to be USD 373.6 million as of 2022.
5. What are some drivers contributing to market growth?
N/A
6. What are the notable trends driving market growth?
N/A
7. Are there any restraints impacting market growth?
N/A
8. Can you provide examples of recent developments in the market?
N/A
9. What pricing options are available for accessing the report?
Pricing options include single-user, multi-user, and enterprise licenses priced at USD 2900.00, USD 4350.00, and USD 5800.00 respectively.
10. Is the market size provided in terms of value or volume?
The market size is provided in terms of value, measured in million.
11. Are there any specific market keywords associated with the report?
Yes, the market keyword associated with the report is "Cup Carrier Packaging," which aids in identifying and referencing the specific market segment covered.
12. How do I determine which pricing option suits my needs best?
The pricing options vary based on user requirements and access needs. Individual users may opt for single-user licenses, while businesses requiring broader access may choose multi-user or enterprise licenses for cost-effective access to the report.
13. Are there any additional resources or data provided in the Cup Carrier Packaging report?
While the report offers comprehensive insights, it's advisable to review the specific contents or supplementary materials provided to ascertain if additional resources or data are available.
14. How can I stay updated on further developments or reports in the Cup Carrier Packaging?
To stay informed about further developments, trends, and reports in the Cup Carrier Packaging, consider subscribing to industry newsletters, following relevant companies and organizations, or regularly checking reputable industry news sources and publications.
Methodology
Step 1 - Identification of Relevant Samples Size from Population Database


Step 2 - Approaches for Defining Global Market Size (Value, Volume* & Price*)

Note*: In applicable scenarios
Step 3 - Data Sources
Primary Research
- Web Analytics
- Survey Reports
- Research Institute
- Latest Research Reports
- Opinion Leaders
Secondary Research
- Annual Reports
- White Paper
- Latest Press Release
- Industry Association
- Paid Database
- Investor Presentations

Step 4 - Data Triangulation
Involves using different sources of information in order to increase the validity of a study
These sources are likely to be stakeholders in a program - participants, other researchers, program staff, other community members, and so on.
Then we put all data in single framework & apply various statistical tools to find out the dynamic on the market.
During the analysis stage, feedback from the stakeholder groups would be compared to determine areas of agreement as well as areas of divergence