

Key Insights
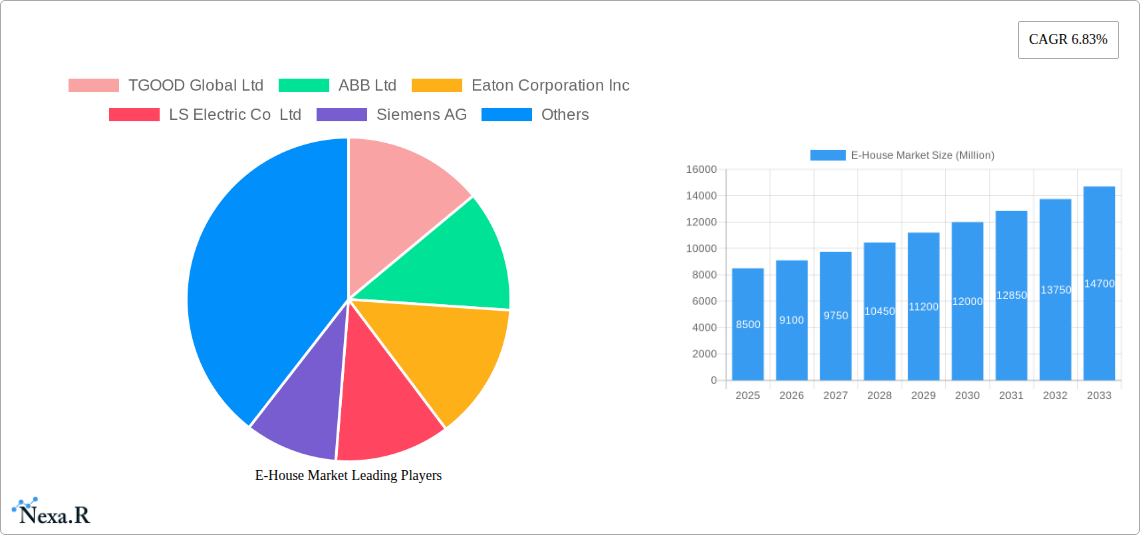
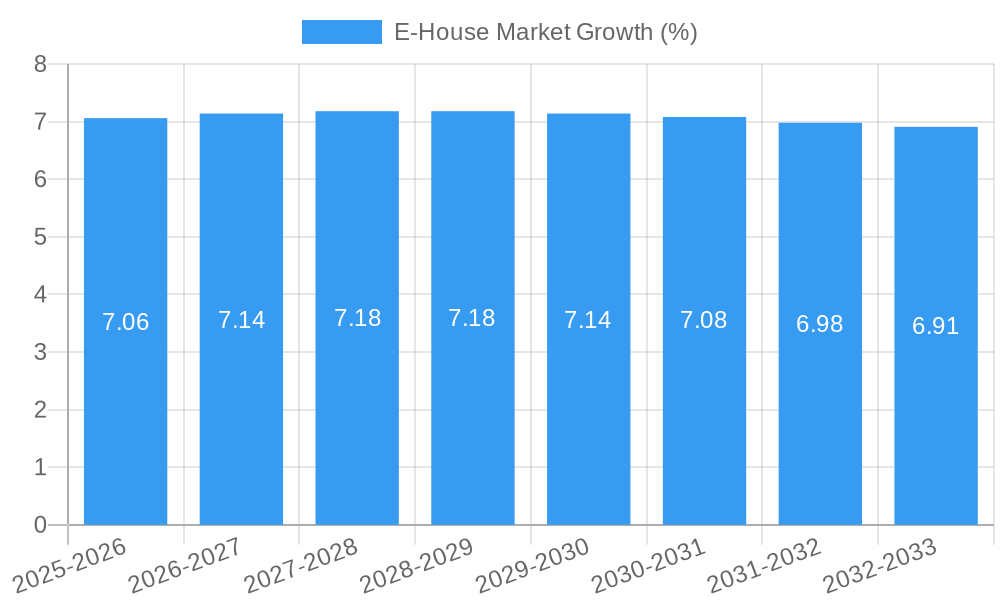
The global E-House market is poised for significant expansion, projected to reach a substantial market size by 2025, fueled by a robust Compound Annual Growth Rate (CAGR) of 6.83%. This growth trajectory is primarily driven by the increasing demand for reliable and efficient power distribution solutions across various sectors. Key drivers include the escalating need for grid modernization to accommodate renewable energy integration, the expansion of industrial infrastructure particularly in burgeoning economies, and the growing adoption of prefabricated and modular electrical substations for faster deployment and cost-effectiveness. The utilities sector remains a cornerstone of this market, emphasizing the critical role of E-houses in ensuring grid stability and expanding power access. Simultaneously, industrial applications, spanning oil & gas, mining & minerals, and chemicals, are increasingly leveraging E-houses for their robust performance, safety features, and ability to operate in challenging environments.
The market's evolution is also shaped by emerging trends such as the integration of smart technologies within E-houses, enabling remote monitoring, control, and predictive maintenance. This technological advancement enhances operational efficiency and reduces downtime. The growing emphasis on sustainability and the transition towards cleaner energy sources further bolster the demand for advanced E-house solutions capable of managing distributed generation. While the market presents immense opportunities, certain restraints, such as the initial high capital investment and the need for specialized expertise in installation and maintenance, need to be addressed. However, the inherent benefits of flexibility, scalability, and reduced on-site construction time offered by E-houses, particularly Mobile Substation and Fixed E-House types, are expected to outweigh these challenges, propelling sustained market growth throughout the forecast period. The competitive landscape is marked by the presence of established global players and regional specialists, fostering innovation and driving market competitiveness.
Comprehensive E-House Market Report: Strategic Insights & Future Outlook (2019-2033)
This in-depth E-House market report provides an indispensable resource for industry professionals seeking to understand the evolving landscape of electrical house solutions. Covering the period from 2019 to 2033, with a base year of 2025, this analysis delves into market dynamics, growth trends, regional dominance, product innovations, and key strategic considerations. We leverage high-traffic keywords such as "e-house solutions," "mobile substation," "fixed e-house," "industrial automation," and "utility infrastructure" to ensure maximum SEO visibility. The report also explores the interconnectedness of the parent and child e-house markets, offering a holistic view. All quantitative values are presented in Million Units for clarity and comparability.
E-House Market Market Dynamics & Structure
The global E-House market is characterized by a moderately consolidated structure, with key players like Siemens AG, Schneider Electric SE, ABB Ltd, and Eaton Corporation Inc holding significant market shares. Technological innovation remains a primary driver, fueled by the increasing demand for digitalization and automation in power distribution and industrial processes. Regulatory frameworks, particularly those promoting grid modernization and renewable energy integration, are crucial in shaping market expansion. Competitive product substitutes include traditional substations and distributed control systems, though e-houses offer advantages in terms of pre-fabrication, faster deployment, and enhanced safety. End-user demographics are shifting towards industries requiring flexible and resilient power solutions, including utilities and diverse industrial sectors. Mergers and acquisitions (M&A) are an ongoing trend, with companies consolidating their portfolios and expanding their geographical reach.
- Market Concentration: Moderate, with dominance by a few global conglomerates.
- Technological Innovation Drivers: Smart grid initiatives, IoT integration, modular design, energy efficiency advancements.
- Regulatory Frameworks: Favorable policies for renewable energy, grid modernization mandates, stringent safety standards.
- Competitive Product Substitutes: Traditional on-site constructed substations, containerized substations.
- End-User Demographics: Utilities (xx% market share), Industrial sectors (xx% market share).
- M&A Trends: Strategic acquisitions to enhance product offerings and market presence.
E-House Market Growth Trends & Insights
The E-House market is poised for robust growth, driven by the escalating need for decentralized power solutions and the increasing complexity of energy infrastructure. The study period from 2019 to 2033 is expected to witness a significant CAGR, propelled by advancements in digital substation technology and the growing adoption of smart grid functionalities. The base year of 2025 marks a critical juncture, with anticipated market penetration rates reflecting the widespread acceptance of e-house solutions across various applications. The forecast period (2025–2033) is projected to experience sustained expansion as industries prioritize reliability, scalability, and reduced on-site construction times. Technological disruptions, such as the integration of artificial intelligence for predictive maintenance and the development of highly customizable modular designs, will further accelerate adoption. Consumer behavior is shifting towards valuing integrated, pre-engineered solutions that minimize project risks and operational downtime. The increasing focus on renewable energy sources, with their intermittent nature, necessitates flexible and rapidly deployable power infrastructure, a niche perfectly filled by e-house solutions. The child market segments, particularly those catering to specialized industrial applications, are exhibiting remarkable growth trajectories.
Dominant Regions, Countries, or Segments in E-House Market
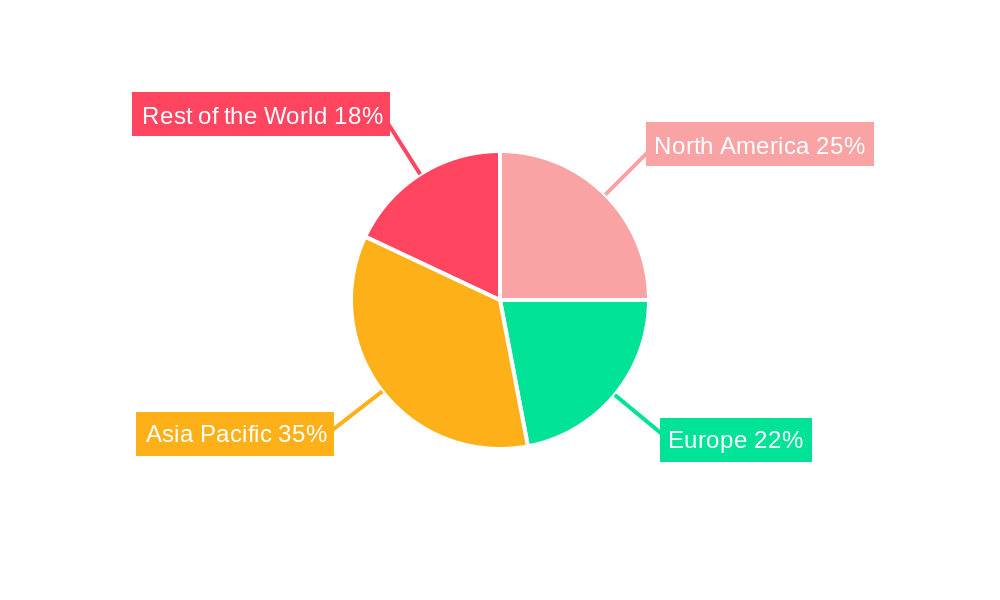
North America currently stands as a dominant region in the E-House market, driven by substantial investments in grid modernization, the expansion of renewable energy projects, and a robust industrial sector. The United States, in particular, contributes significantly due to its extensive utility infrastructure upgrades and the burgeoning demand for robust power solutions in oil & gas and mining operations. In terms of segment dominance, Fixed E-Houses represent the larger share of the market, owing to their widespread application in permanent utility substations and large-scale industrial facilities. However, Mobile Substations are witnessing impressive growth, particularly in regions prone to extreme weather events or in scenarios requiring temporary power during maintenance or disaster recovery.
Key drivers for North American dominance include:
- Economic Policies: Favorable government incentives for renewable energy deployment and grid modernization initiatives.
- Infrastructure Investment: Significant capital expenditure by utility companies on upgrading and expanding their power grids.
- Industrial Demand: High demand from the oil & gas, mining & minerals, and chemical sectors for reliable and scalable power solutions.
- Technological Adoption: Early and widespread adoption of advanced technologies like smart grids and automation.
Within the industrial application segment, the Oil & Gas sector is a major consumer of e-houses, seeking their inherent safety features and rapid deployment capabilities in remote and hazardous environments. The Chemicals industry also represents a significant market due to stringent safety regulations and the need for reliable power for continuous processing.
E-House Market Product Landscape
The E-House market product landscape is defined by continuous innovation, focusing on enhanced modularity, improved environmental resilience, and advanced digital integration. Products range from compact Mobile Substations designed for rapid deployment in remote locations or emergency situations, to robust Fixed E-Houses tailored for permanent installations in utilities and large-scale industrial complexes. Key performance metrics include enhanced safety features, plug-and-play connectivity, extended lifespan, and compliance with stringent international standards. Technological advancements are centered on integrating intelligent control systems, remote monitoring capabilities, and energy management solutions to optimize operational efficiency and predictive maintenance. Unique selling propositions revolve around reduced on-site footprint, faster installation times, and comprehensive factory testing ensuring superior quality and reliability.
Key Drivers, Barriers & Challenges in E-House Market
The E-House market is primarily propelled by the global push for renewable energy integration, the need for enhanced grid reliability and resilience, and the increasing demand for digitalization and automation in power infrastructure. Technological advancements in modular design and pre-fabrication also act as significant drivers, enabling faster deployment and cost efficiencies.
- Key Drivers:
- Renewable energy integration and grid modernization.
- Increasing demand for reliable and resilient power supply.
- Digitalization and automation trends in the energy sector.
- Need for faster project deployment and reduced on-site construction.
Key challenges facing the E-House market include the high initial capital investment, complex logistical requirements for transportation and installation of larger units, and the need for skilled labor to manage sophisticated integrated systems. Supply chain disruptions can also impact project timelines and costs.
- Key Barriers & Challenges:
- High upfront investment costs.
- Logistical complexities in transportation and site access.
- Requirement for specialized installation and maintenance expertise.
- Potential supply chain disruptions and material shortages.
- Stringent regional regulations and permitting processes.
Emerging Opportunities in E-House Market
Emerging opportunities in the E-House market lie in the development of highly specialized e-houses for emerging applications such as data centers requiring high-density power, microgrid solutions for remote communities, and electric vehicle charging infrastructure. The increasing adoption of distributed energy resources (DERs) also presents a significant opportunity for integrated e-house solutions that can manage and optimize these diverse energy sources. Furthermore, the growing emphasis on energy efficiency and sustainability is driving demand for e-houses equipped with advanced energy storage systems and smart grid technologies.
Growth Accelerators in the E-House Market Industry
The long-term growth of the E-House market is being significantly accelerated by continuous technological breakthroughs in areas like advanced power electronics, digital twin technology for simulation and optimization, and the incorporation of AI-driven predictive maintenance capabilities. Strategic partnerships between e-house manufacturers, utility companies, and technology providers are fostering innovative solutions and expanding market reach. Moreover, governments worldwide are increasingly investing in smart grid infrastructure and renewable energy projects, creating a fertile ground for e-house deployment and driving market expansion strategies through favorable policy frameworks.
Key Players Shaping the E-House Market Market
- TGOOD Global Ltd
- ABB Ltd
- Eaton Corporation Inc
- LS Electric Co Ltd
- Siemens AG
- Schneider Electric SE
- Powell Industries Inc
- Aktif Group
- Electroinnova S L
- Unit Electrical Engineering Ltd
Notable Milestones in E-House Market Sector
- 2019: Increased adoption of modular e-house designs for faster renewable energy project integration.
- 2020: Growth in demand for mobile substations due to increased natural disaster response needs.
- 2021: Siemens AG's advanced digital substation solutions gain significant traction.
- 2022: Eaton Corporation Inc. expands its e-house offerings with enhanced smart grid capabilities.
- 2023: Schneider Electric SE focuses on sustainable and energy-efficient e-house solutions.
- 2024: LS Electric Co Ltd announces innovative integration of IoT in its e-house offerings.
- 2025 (Estimated): Widespread integration of AI for predictive maintenance in new e-house deployments.
- 2026-2033 (Forecast): Expected surge in e-house demand for large-scale offshore wind and solar farms.
In-Depth E-House Market Market Outlook
The future outlook for the E-House market is exceptionally promising, driven by its inherent ability to address the evolving demands of the global energy landscape. Growth accelerators such as the ongoing digital transformation of power grids, the accelerating transition to renewable energy sources, and the increasing need for resilient and flexible power infrastructure will continue to fuel market expansion. Strategic opportunities lie in catering to the burgeoning data center sector, developing advanced microgrid solutions for remote and off-grid applications, and integrating cutting-edge energy storage technologies. The market is projected to witness sustained growth, offering significant potential for innovation and strategic investment.
E-House Market Segmentation
-
1. Type
- 1.1. Fixed E-House
- 1.2. Mobile Substation
-
2. Application
- 2.1. Utilities
-
2.2. Industrial
- 2.2.1. Oil & Gas
- 2.2.2. Mining & Minerals
- 2.2.3. Chemicals
- 2.2.4. Other Industrial Applications
E-House Market Segmentation By Geography
-
1. North America
- 1.1. United States
- 1.2. Canada
-
2. Europe
- 2.1. Germany
- 2.2. United Kingdom
- 2.3. France
- 2.4. Italy
- 2.5. Rest of Europe
-
3. Asia Pacific
- 3.1. India
- 3.2. China
- 3.3. Japan
- 3.4. Rest of Asia Pacific
-
4. Rest of the World
- 4.1. Latin America
- 4.2. Middle East and Africa
E-House Market REPORT HIGHLIGHTS
| Aspects | Details |
|---|---|
| Study Period | 2019-2033 |
| Base Year | 2024 |
| Estimated Year | 2025 |
| Forecast Period | 2025-2033 |
| Historical Period | 2019-2024 |
| Growth Rate | CAGR of 6.83% from 2019-2033 |
| Segmentation |
|
Table of Contents
- 1. Introduction
- 1.1. Research Scope
- 1.2. Market Segmentation
- 1.3. Research Methodology
- 1.4. Definitions and Assumptions
- 2. Executive Summary
- 2.1. Introduction
- 3. Market Dynamics
- 3.1. Introduction
- 3.2. Market Drivers
- 3.2.1. ; Adoption in the Replacement of SF6 to Lower Environmental Impact; Digitalization of E-House
- 3.3. Market Restrains
- 3.3.1. ; Concerns Regarding the Impact of Covid-19 Due to Industry Shutdown
- 3.4. Market Trends
- 3.4.1. Upstream Sector in Oil and Gas to Witness Significant Share
- 4. Market Factor Analysis
- 4.1. Porters Five Forces
- 4.2. Supply/Value Chain
- 4.3. PESTEL analysis
- 4.4. Market Entropy
- 4.5. Patent/Trademark Analysis
- 5. Global E-House Market Analysis, Insights and Forecast, 2019-2031
- 5.1. Market Analysis, Insights and Forecast - by Type
- 5.1.1. Fixed E-House
- 5.1.2. Mobile Substation
- 5.2. Market Analysis, Insights and Forecast - by Application
- 5.2.1. Utilities
- 5.2.2. Industrial
- 5.2.2.1. Oil & Gas
- 5.2.2.2. Mining & Minerals
- 5.2.2.3. Chemicals
- 5.2.2.4. Other Industrial Applications
- 5.3. Market Analysis, Insights and Forecast - by Region
- 5.3.1. North America
- 5.3.2. Europe
- 5.3.3. Asia Pacific
- 5.3.4. Rest of the World
- 5.1. Market Analysis, Insights and Forecast - by Type
- 6. North America E-House Market Analysis, Insights and Forecast, 2019-2031
- 6.1. Market Analysis, Insights and Forecast - by Type
- 6.1.1. Fixed E-House
- 6.1.2. Mobile Substation
- 6.2. Market Analysis, Insights and Forecast - by Application
- 6.2.1. Utilities
- 6.2.2. Industrial
- 6.2.2.1. Oil & Gas
- 6.2.2.2. Mining & Minerals
- 6.2.2.3. Chemicals
- 6.2.2.4. Other Industrial Applications
- 6.1. Market Analysis, Insights and Forecast - by Type
- 7. Europe E-House Market Analysis, Insights and Forecast, 2019-2031
- 7.1. Market Analysis, Insights and Forecast - by Type
- 7.1.1. Fixed E-House
- 7.1.2. Mobile Substation
- 7.2. Market Analysis, Insights and Forecast - by Application
- 7.2.1. Utilities
- 7.2.2. Industrial
- 7.2.2.1. Oil & Gas
- 7.2.2.2. Mining & Minerals
- 7.2.2.3. Chemicals
- 7.2.2.4. Other Industrial Applications
- 7.1. Market Analysis, Insights and Forecast - by Type
- 8. Asia Pacific E-House Market Analysis, Insights and Forecast, 2019-2031
- 8.1. Market Analysis, Insights and Forecast - by Type
- 8.1.1. Fixed E-House
- 8.1.2. Mobile Substation
- 8.2. Market Analysis, Insights and Forecast - by Application
- 8.2.1. Utilities
- 8.2.2. Industrial
- 8.2.2.1. Oil & Gas
- 8.2.2.2. Mining & Minerals
- 8.2.2.3. Chemicals
- 8.2.2.4. Other Industrial Applications
- 8.1. Market Analysis, Insights and Forecast - by Type
- 9. Rest of the World E-House Market Analysis, Insights and Forecast, 2019-2031
- 9.1. Market Analysis, Insights and Forecast - by Type
- 9.1.1. Fixed E-House
- 9.1.2. Mobile Substation
- 9.2. Market Analysis, Insights and Forecast - by Application
- 9.2.1. Utilities
- 9.2.2. Industrial
- 9.2.2.1. Oil & Gas
- 9.2.2.2. Mining & Minerals
- 9.2.2.3. Chemicals
- 9.2.2.4. Other Industrial Applications
- 9.1. Market Analysis, Insights and Forecast - by Type
- 10. North America E-House Market Analysis, Insights and Forecast, 2019-2031
- 10.1. Market Analysis, Insights and Forecast - By Country/Sub-region
- 10.1.1. undefined
- 11. Europe E-House Market Analysis, Insights and Forecast, 2019-2031
- 11.1. Market Analysis, Insights and Forecast - By Country/Sub-region
- 11.1.1. undefined
- 12. Asia Pacific E-House Market Analysis, Insights and Forecast, 2019-2031
- 12.1. Market Analysis, Insights and Forecast - By Country/Sub-region
- 12.1.1. undefined
- 13. South America E-House Market Analysis, Insights and Forecast, 2019-2031
- 13.1. Market Analysis, Insights and Forecast - By Country/Sub-region
- 13.1.1. undefined
- 14. North America E-House Market Analysis, Insights and Forecast, 2019-2031
- 14.1. Market Analysis, Insights and Forecast - By Country/Sub-region
- 14.1.1. undefined
- 15. MEA E-House Market Analysis, Insights and Forecast, 2019-2031
- 15.1. Market Analysis, Insights and Forecast - By Country/Sub-region
- 15.1.1. undefined
- 16. Competitive Analysis
- 16.1. Global Market Share Analysis 2024
- 16.2. Company Profiles
- 16.2.1 TGOOD Global Ltd
- 16.2.1.1. Overview
- 16.2.1.2. Products
- 16.2.1.3. SWOT Analysis
- 16.2.1.4. Recent Developments
- 16.2.1.5. Financials (Based on Availability)
- 16.2.2 ABB Ltd
- 16.2.2.1. Overview
- 16.2.2.2. Products
- 16.2.2.3. SWOT Analysis
- 16.2.2.4. Recent Developments
- 16.2.2.5. Financials (Based on Availability)
- 16.2.3 Eaton Corporation Inc
- 16.2.3.1. Overview
- 16.2.3.2. Products
- 16.2.3.3. SWOT Analysis
- 16.2.3.4. Recent Developments
- 16.2.3.5. Financials (Based on Availability)
- 16.2.4 LS Electric Co Ltd
- 16.2.4.1. Overview
- 16.2.4.2. Products
- 16.2.4.3. SWOT Analysis
- 16.2.4.4. Recent Developments
- 16.2.4.5. Financials (Based on Availability)
- 16.2.5 Siemens AG
- 16.2.5.1. Overview
- 16.2.5.2. Products
- 16.2.5.3. SWOT Analysis
- 16.2.5.4. Recent Developments
- 16.2.5.5. Financials (Based on Availability)
- 16.2.6 Schneider Electric SE
- 16.2.6.1. Overview
- 16.2.6.2. Products
- 16.2.6.3. SWOT Analysis
- 16.2.6.4. Recent Developments
- 16.2.6.5. Financials (Based on Availability)
- 16.2.7 Powell Industries Inc
- 16.2.7.1. Overview
- 16.2.7.2. Products
- 16.2.7.3. SWOT Analysis
- 16.2.7.4. Recent Developments
- 16.2.7.5. Financials (Based on Availability)
- 16.2.8 Aktif Group
- 16.2.8.1. Overview
- 16.2.8.2. Products
- 16.2.8.3. SWOT Analysis
- 16.2.8.4. Recent Developments
- 16.2.8.5. Financials (Based on Availability)
- 16.2.9 Electroinnova S L
- 16.2.9.1. Overview
- 16.2.9.2. Products
- 16.2.9.3. SWOT Analysis
- 16.2.9.4. Recent Developments
- 16.2.9.5. Financials (Based on Availability)
- 16.2.10 Unit Electrical Engineering Ltd
- 16.2.10.1. Overview
- 16.2.10.2. Products
- 16.2.10.3. SWOT Analysis
- 16.2.10.4. Recent Developments
- 16.2.10.5. Financials (Based on Availability)
- 16.2.1 TGOOD Global Ltd
List of Figures
- Figure 1: Global E-House Market Revenue Breakdown (Million, %) by Region 2024 & 2032
- Figure 2: Global E-House Market Volume Breakdown (K Unit, %) by Region 2024 & 2032
- Figure 3: North America E-House Market Revenue (Million), by Country 2024 & 2032
- Figure 4: North America E-House Market Volume (K Unit), by Country 2024 & 2032
- Figure 5: North America E-House Market Revenue Share (%), by Country 2024 & 2032
- Figure 6: North America E-House Market Volume Share (%), by Country 2024 & 2032
- Figure 7: Europe E-House Market Revenue (Million), by Country 2024 & 2032
- Figure 8: Europe E-House Market Volume (K Unit), by Country 2024 & 2032
- Figure 9: Europe E-House Market Revenue Share (%), by Country 2024 & 2032
- Figure 10: Europe E-House Market Volume Share (%), by Country 2024 & 2032
- Figure 11: Asia Pacific E-House Market Revenue (Million), by Country 2024 & 2032
- Figure 12: Asia Pacific E-House Market Volume (K Unit), by Country 2024 & 2032
- Figure 13: Asia Pacific E-House Market Revenue Share (%), by Country 2024 & 2032
- Figure 14: Asia Pacific E-House Market Volume Share (%), by Country 2024 & 2032
- Figure 15: South America E-House Market Revenue (Million), by Country 2024 & 2032
- Figure 16: South America E-House Market Volume (K Unit), by Country 2024 & 2032
- Figure 17: South America E-House Market Revenue Share (%), by Country 2024 & 2032
- Figure 18: South America E-House Market Volume Share (%), by Country 2024 & 2032
- Figure 19: North America E-House Market Revenue (Million), by Country 2024 & 2032
- Figure 20: North America E-House Market Volume (K Unit), by Country 2024 & 2032
- Figure 21: North America E-House Market Revenue Share (%), by Country 2024 & 2032
- Figure 22: North America E-House Market Volume Share (%), by Country 2024 & 2032
- Figure 23: MEA E-House Market Revenue (Million), by Country 2024 & 2032
- Figure 24: MEA E-House Market Volume (K Unit), by Country 2024 & 2032
- Figure 25: MEA E-House Market Revenue Share (%), by Country 2024 & 2032
- Figure 26: MEA E-House Market Volume Share (%), by Country 2024 & 2032
- Figure 27: North America E-House Market Revenue (Million), by Type 2024 & 2032
- Figure 28: North America E-House Market Volume (K Unit), by Type 2024 & 2032
- Figure 29: North America E-House Market Revenue Share (%), by Type 2024 & 2032
- Figure 30: North America E-House Market Volume Share (%), by Type 2024 & 2032
- Figure 31: North America E-House Market Revenue (Million), by Application 2024 & 2032
- Figure 32: North America E-House Market Volume (K Unit), by Application 2024 & 2032
- Figure 33: North America E-House Market Revenue Share (%), by Application 2024 & 2032
- Figure 34: North America E-House Market Volume Share (%), by Application 2024 & 2032
- Figure 35: North America E-House Market Revenue (Million), by Country 2024 & 2032
- Figure 36: North America E-House Market Volume (K Unit), by Country 2024 & 2032
- Figure 37: North America E-House Market Revenue Share (%), by Country 2024 & 2032
- Figure 38: North America E-House Market Volume Share (%), by Country 2024 & 2032
- Figure 39: Europe E-House Market Revenue (Million), by Type 2024 & 2032
- Figure 40: Europe E-House Market Volume (K Unit), by Type 2024 & 2032
- Figure 41: Europe E-House Market Revenue Share (%), by Type 2024 & 2032
- Figure 42: Europe E-House Market Volume Share (%), by Type 2024 & 2032
- Figure 43: Europe E-House Market Revenue (Million), by Application 2024 & 2032
- Figure 44: Europe E-House Market Volume (K Unit), by Application 2024 & 2032
- Figure 45: Europe E-House Market Revenue Share (%), by Application 2024 & 2032
- Figure 46: Europe E-House Market Volume Share (%), by Application 2024 & 2032
- Figure 47: Europe E-House Market Revenue (Million), by Country 2024 & 2032
- Figure 48: Europe E-House Market Volume (K Unit), by Country 2024 & 2032
- Figure 49: Europe E-House Market Revenue Share (%), by Country 2024 & 2032
- Figure 50: Europe E-House Market Volume Share (%), by Country 2024 & 2032
- Figure 51: Asia Pacific E-House Market Revenue (Million), by Type 2024 & 2032
- Figure 52: Asia Pacific E-House Market Volume (K Unit), by Type 2024 & 2032
- Figure 53: Asia Pacific E-House Market Revenue Share (%), by Type 2024 & 2032
- Figure 54: Asia Pacific E-House Market Volume Share (%), by Type 2024 & 2032
- Figure 55: Asia Pacific E-House Market Revenue (Million), by Application 2024 & 2032
- Figure 56: Asia Pacific E-House Market Volume (K Unit), by Application 2024 & 2032
- Figure 57: Asia Pacific E-House Market Revenue Share (%), by Application 2024 & 2032
- Figure 58: Asia Pacific E-House Market Volume Share (%), by Application 2024 & 2032
- Figure 59: Asia Pacific E-House Market Revenue (Million), by Country 2024 & 2032
- Figure 60: Asia Pacific E-House Market Volume (K Unit), by Country 2024 & 2032
- Figure 61: Asia Pacific E-House Market Revenue Share (%), by Country 2024 & 2032
- Figure 62: Asia Pacific E-House Market Volume Share (%), by Country 2024 & 2032
- Figure 63: Rest of the World E-House Market Revenue (Million), by Type 2024 & 2032
- Figure 64: Rest of the World E-House Market Volume (K Unit), by Type 2024 & 2032
- Figure 65: Rest of the World E-House Market Revenue Share (%), by Type 2024 & 2032
- Figure 66: Rest of the World E-House Market Volume Share (%), by Type 2024 & 2032
- Figure 67: Rest of the World E-House Market Revenue (Million), by Application 2024 & 2032
- Figure 68: Rest of the World E-House Market Volume (K Unit), by Application 2024 & 2032
- Figure 69: Rest of the World E-House Market Revenue Share (%), by Application 2024 & 2032
- Figure 70: Rest of the World E-House Market Volume Share (%), by Application 2024 & 2032
- Figure 71: Rest of the World E-House Market Revenue (Million), by Country 2024 & 2032
- Figure 72: Rest of the World E-House Market Volume (K Unit), by Country 2024 & 2032
- Figure 73: Rest of the World E-House Market Revenue Share (%), by Country 2024 & 2032
- Figure 74: Rest of the World E-House Market Volume Share (%), by Country 2024 & 2032
List of Tables
- Table 1: Global E-House Market Revenue Million Forecast, by Region 2019 & 2032
- Table 2: Global E-House Market Volume K Unit Forecast, by Region 2019 & 2032
- Table 3: Global E-House Market Revenue Million Forecast, by Type 2019 & 2032
- Table 4: Global E-House Market Volume K Unit Forecast, by Type 2019 & 2032
- Table 5: Global E-House Market Revenue Million Forecast, by Application 2019 & 2032
- Table 6: Global E-House Market Volume K Unit Forecast, by Application 2019 & 2032
- Table 7: Global E-House Market Revenue Million Forecast, by Region 2019 & 2032
- Table 8: Global E-House Market Volume K Unit Forecast, by Region 2019 & 2032
- Table 9: Global E-House Market Revenue Million Forecast, by Country 2019 & 2032
- Table 10: Global E-House Market Volume K Unit Forecast, by Country 2019 & 2032
- Table 11: Global E-House Market Revenue Million Forecast, by Country 2019 & 2032
- Table 12: Global E-House Market Volume K Unit Forecast, by Country 2019 & 2032
- Table 13: Global E-House Market Revenue Million Forecast, by Country 2019 & 2032
- Table 14: Global E-House Market Volume K Unit Forecast, by Country 2019 & 2032
- Table 15: Global E-House Market Revenue Million Forecast, by Country 2019 & 2032
- Table 16: Global E-House Market Volume K Unit Forecast, by Country 2019 & 2032
- Table 17: Global E-House Market Revenue Million Forecast, by Country 2019 & 2032
- Table 18: Global E-House Market Volume K Unit Forecast, by Country 2019 & 2032
- Table 19: Global E-House Market Revenue Million Forecast, by Country 2019 & 2032
- Table 20: Global E-House Market Volume K Unit Forecast, by Country 2019 & 2032
- Table 21: Global E-House Market Revenue Million Forecast, by Type 2019 & 2032
- Table 22: Global E-House Market Volume K Unit Forecast, by Type 2019 & 2032
- Table 23: Global E-House Market Revenue Million Forecast, by Application 2019 & 2032
- Table 24: Global E-House Market Volume K Unit Forecast, by Application 2019 & 2032
- Table 25: Global E-House Market Revenue Million Forecast, by Country 2019 & 2032
- Table 26: Global E-House Market Volume K Unit Forecast, by Country 2019 & 2032
- Table 27: United States E-House Market Revenue (Million) Forecast, by Application 2019 & 2032
- Table 28: United States E-House Market Volume (K Unit) Forecast, by Application 2019 & 2032
- Table 29: Canada E-House Market Revenue (Million) Forecast, by Application 2019 & 2032
- Table 30: Canada E-House Market Volume (K Unit) Forecast, by Application 2019 & 2032
- Table 31: Global E-House Market Revenue Million Forecast, by Type 2019 & 2032
- Table 32: Global E-House Market Volume K Unit Forecast, by Type 2019 & 2032
- Table 33: Global E-House Market Revenue Million Forecast, by Application 2019 & 2032
- Table 34: Global E-House Market Volume K Unit Forecast, by Application 2019 & 2032
- Table 35: Global E-House Market Revenue Million Forecast, by Country 2019 & 2032
- Table 36: Global E-House Market Volume K Unit Forecast, by Country 2019 & 2032
- Table 37: Germany E-House Market Revenue (Million) Forecast, by Application 2019 & 2032
- Table 38: Germany E-House Market Volume (K Unit) Forecast, by Application 2019 & 2032
- Table 39: United Kingdom E-House Market Revenue (Million) Forecast, by Application 2019 & 2032
- Table 40: United Kingdom E-House Market Volume (K Unit) Forecast, by Application 2019 & 2032
- Table 41: France E-House Market Revenue (Million) Forecast, by Application 2019 & 2032
- Table 42: France E-House Market Volume (K Unit) Forecast, by Application 2019 & 2032
- Table 43: Italy E-House Market Revenue (Million) Forecast, by Application 2019 & 2032
- Table 44: Italy E-House Market Volume (K Unit) Forecast, by Application 2019 & 2032
- Table 45: Rest of Europe E-House Market Revenue (Million) Forecast, by Application 2019 & 2032
- Table 46: Rest of Europe E-House Market Volume (K Unit) Forecast, by Application 2019 & 2032
- Table 47: Global E-House Market Revenue Million Forecast, by Type 2019 & 2032
- Table 48: Global E-House Market Volume K Unit Forecast, by Type 2019 & 2032
- Table 49: Global E-House Market Revenue Million Forecast, by Application 2019 & 2032
- Table 50: Global E-House Market Volume K Unit Forecast, by Application 2019 & 2032
- Table 51: Global E-House Market Revenue Million Forecast, by Country 2019 & 2032
- Table 52: Global E-House Market Volume K Unit Forecast, by Country 2019 & 2032
- Table 53: India E-House Market Revenue (Million) Forecast, by Application 2019 & 2032
- Table 54: India E-House Market Volume (K Unit) Forecast, by Application 2019 & 2032
- Table 55: China E-House Market Revenue (Million) Forecast, by Application 2019 & 2032
- Table 56: China E-House Market Volume (K Unit) Forecast, by Application 2019 & 2032
- Table 57: Japan E-House Market Revenue (Million) Forecast, by Application 2019 & 2032
- Table 58: Japan E-House Market Volume (K Unit) Forecast, by Application 2019 & 2032
- Table 59: Rest of Asia Pacific E-House Market Revenue (Million) Forecast, by Application 2019 & 2032
- Table 60: Rest of Asia Pacific E-House Market Volume (K Unit) Forecast, by Application 2019 & 2032
- Table 61: Global E-House Market Revenue Million Forecast, by Type 2019 & 2032
- Table 62: Global E-House Market Volume K Unit Forecast, by Type 2019 & 2032
- Table 63: Global E-House Market Revenue Million Forecast, by Application 2019 & 2032
- Table 64: Global E-House Market Volume K Unit Forecast, by Application 2019 & 2032
- Table 65: Global E-House Market Revenue Million Forecast, by Country 2019 & 2032
- Table 66: Global E-House Market Volume K Unit Forecast, by Country 2019 & 2032
- Table 67: Latin America E-House Market Revenue (Million) Forecast, by Application 2019 & 2032
- Table 68: Latin America E-House Market Volume (K Unit) Forecast, by Application 2019 & 2032
- Table 69: Middle East and Africa E-House Market Revenue (Million) Forecast, by Application 2019 & 2032
- Table 70: Middle East and Africa E-House Market Volume (K Unit) Forecast, by Application 2019 & 2032
Frequently Asked Questions
1. What is the projected Compound Annual Growth Rate (CAGR) of the E-House Market?
The projected CAGR is approximately 6.83%.
2. Which companies are prominent players in the E-House Market?
Key companies in the market include TGOOD Global Ltd, ABB Ltd, Eaton Corporation Inc, LS Electric Co Ltd, Siemens AG, Schneider Electric SE, Powell Industries Inc, Aktif Group, Electroinnova S L, Unit Electrical Engineering Ltd.
3. What are the main segments of the E-House Market?
The market segments include Type, Application.
4. Can you provide details about the market size?
The market size is estimated to be USD XX Million as of 2022.
5. What are some drivers contributing to market growth?
; Adoption in the Replacement of SF6 to Lower Environmental Impact; Digitalization of E-House.
6. What are the notable trends driving market growth?
Upstream Sector in Oil and Gas to Witness Significant Share.
7. Are there any restraints impacting market growth?
; Concerns Regarding the Impact of Covid-19 Due to Industry Shutdown.
8. Can you provide examples of recent developments in the market?
N/A
9. What pricing options are available for accessing the report?
Pricing options include single-user, multi-user, and enterprise licenses priced at USD 4750, USD 5250, and USD 8750 respectively.
10. Is the market size provided in terms of value or volume?
The market size is provided in terms of value, measured in Million and volume, measured in K Unit.
11. Are there any specific market keywords associated with the report?
Yes, the market keyword associated with the report is "E-House Market," which aids in identifying and referencing the specific market segment covered.
12. How do I determine which pricing option suits my needs best?
The pricing options vary based on user requirements and access needs. Individual users may opt for single-user licenses, while businesses requiring broader access may choose multi-user or enterprise licenses for cost-effective access to the report.
13. Are there any additional resources or data provided in the E-House Market report?
While the report offers comprehensive insights, it's advisable to review the specific contents or supplementary materials provided to ascertain if additional resources or data are available.
14. How can I stay updated on further developments or reports in the E-House Market?
To stay informed about further developments, trends, and reports in the E-House Market, consider subscribing to industry newsletters, following relevant companies and organizations, or regularly checking reputable industry news sources and publications.
Methodology
Step 1 - Identification of Relevant Samples Size from Population Database


Step 2 - Approaches for Defining Global Market Size (Value, Volume* & Price*)

Note*: In applicable scenarios
Step 3 - Data Sources
Primary Research
- Web Analytics
- Survey Reports
- Research Institute
- Latest Research Reports
- Opinion Leaders
Secondary Research
- Annual Reports
- White Paper
- Latest Press Release
- Industry Association
- Paid Database
- Investor Presentations

Step 4 - Data Triangulation
Involves using different sources of information in order to increase the validity of a study
These sources are likely to be stakeholders in a program - participants, other researchers, program staff, other community members, and so on.
Then we put all data in single framework & apply various statistical tools to find out the dynamic on the market.
During the analysis stage, feedback from the stakeholder groups would be compared to determine areas of agreement as well as areas of divergence
