

Key Insights
The global Hazardous Lighting market is projected for significant expansion, anticipated to reach a market size of $5.94 billion by 2025, with a Compound Annual Growth Rate (CAGR) of 6.6% through 2033. This growth is propelled by stringent safety regulations in high-risk sectors including oil & gas, power generation, and chemical processing, mandating specialized lighting to prevent ignition in explosive environments. The adoption of energy-efficient LED hazardous lighting is a key trend, offering extended lifespan, reduced maintenance, and superior illumination over legacy technologies. Technological advancements, such as smart lighting with remote monitoring and IoT integration, are further stimulating market penetration.
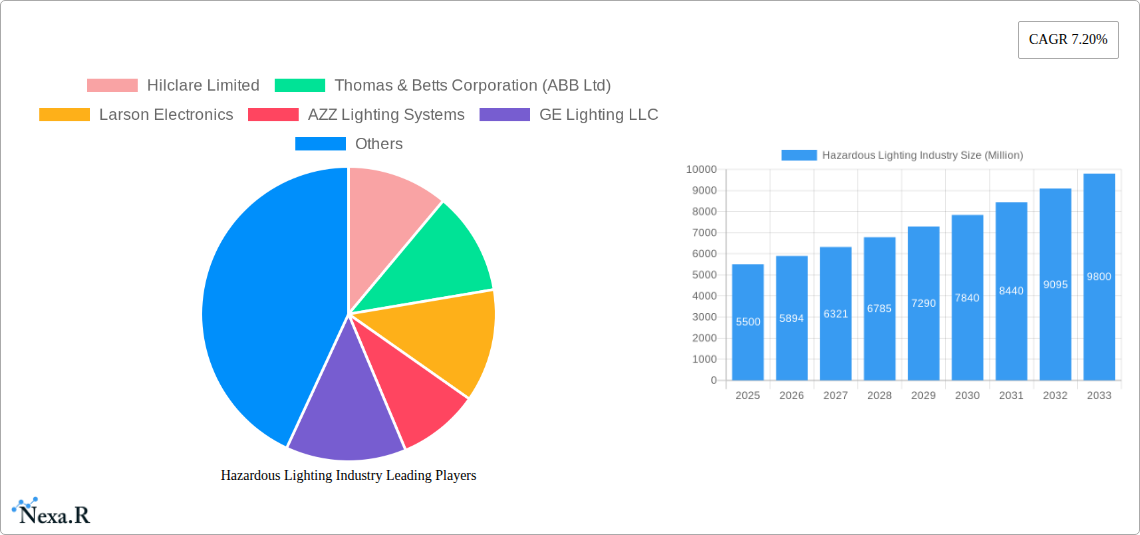
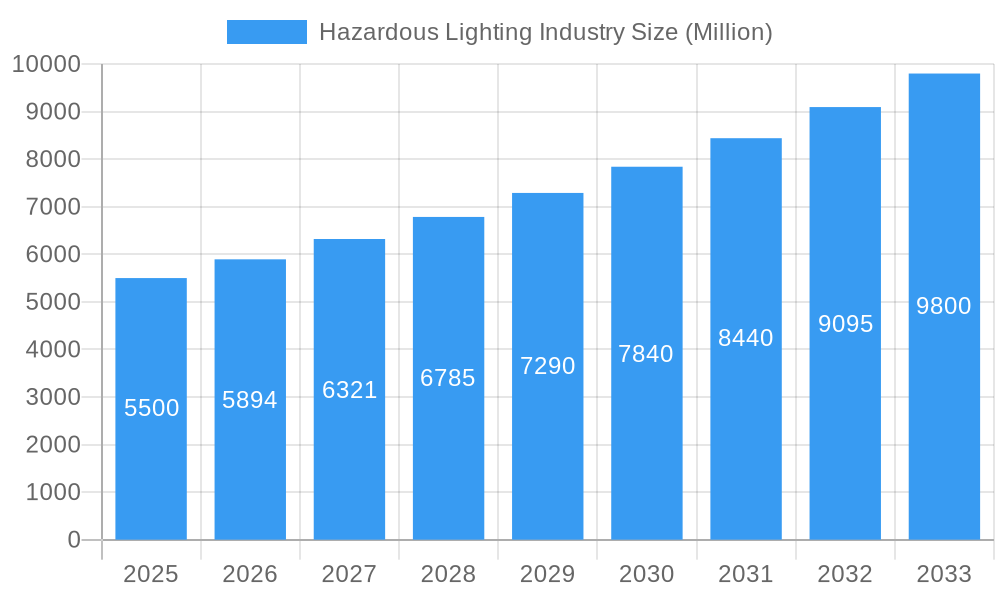
Hazardous Lighting Industry Market Size (In Billion)
The market demonstrates robust demand for LED lighting, replacing older technologies due to enhanced safety and efficiency. Class I and Class II lighting segments, addressing flammable gases/vapors and combustible dust respectively, are key growth drivers. Hazardous zones such as Zone 1 and Zone 21 will also see substantial demand. Geographically, North America and Europe currently dominate due to established industrial infrastructure and rigorous safety standards. However, the Asia Pacific region is poised for the fastest growth, fueled by rapid industrialization, infrastructure development, and increasing investments in the oil & gas and chemical sectors. High initial costs and installation complexity are being offset by long-term operational benefits and the paramount importance of safety.
Hazardous Lighting Industry Company Market Share
Hazardous Lighting Industry Report: Comprehensive Market Analysis & Future Outlook (2019-2033)
This in-depth report delivers a definitive analysis of the global Hazardous Lighting Industry, a critical sector ensuring safety and operational efficiency in environments prone to explosive atmospheres. Covering the study period from 2019 to 2033, with a base year of 2025 and a forecast period spanning 2025 to 2033, this report provides actionable insights for industry professionals. We examine the parent market's growth alongside crucial child markets, offering a holistic view of market dynamics, technological advancements, and regional dominance.
This report is designed for Oil and Gas, Power Generation, Chemical and Petrochemical, and Pharmaceutical industry stakeholders, as well as manufacturers and distributors of LED Lighting, Incandescent Lighting, HID Lighting, and Fluorescent Lighting solutions for Class I, Class II, and Class III environments across Zone 0, Zone 20, Zone 1, Zone 21, and Zone 22 hazardous areas.
Hazardous Lighting Industry Market Dynamics & Structure
The hazardous lighting industry is characterized by a moderate to high market concentration, with a few key players holding significant market shares. Technological innovation is a primary driver, particularly the rapid evolution of LED Lighting technologies, offering enhanced energy efficiency, longer lifespans, and superior performance in extreme conditions. Stringent regulatory frameworks set by bodies like ATEX and IECEx are paramount, dictating product design, testing, and certification, thereby influencing innovation pathways and market entry barriers. Competitive product substitutes, while limited in truly hazardous environments, exist in less critical zones, pushing manufacturers to constantly improve performance and cost-effectiveness. End-user demographics are shifting towards industries with increasing safety compliances and expansion in remote or challenging operational sites. Mergers and acquisition (M&A) trends are observed, driven by the desire to consolidate market presence, acquire innovative technologies, and expand geographical reach.
- Technological Innovation Drivers: Shift towards energy-efficient and durable LED solutions, smart lighting integration for remote monitoring and control.
- Regulatory Frameworks: Strict compliance with ATEX, IECEx, UL, and other regional standards is non-negotiable.
- Competitive Product Substitutes: Availability of less robust lighting in non-hazardous zones influences pricing and feature development.
- End-User Demographics: Growth in offshore oil & gas exploration, increased mining activities, and expansion of chemical processing plants worldwide.
- M&A Trends: Strategic acquisitions focused on expanding product portfolios and market access.
Hazardous Lighting Industry Growth Trends & Insights
The hazardous lighting industry is poised for substantial growth driven by escalating industrial activities in sectors demanding robust safety solutions. The market size is projected to expand significantly from approximately USD 4,500 Million in 2024 to an estimated USD 7,200 Million by 2033, exhibiting a Compound Annual Growth Rate (CAGR) of 5.3% during the forecast period. Adoption rates for advanced lighting solutions, especially LED technology, are rapidly increasing due to their inherent safety advantages and operational cost savings. Technological disruptions are primarily centered on the miniaturization of components, improved lumen output, and the integration of IoT capabilities for predictive maintenance and enhanced operational visibility. Consumer behavior shifts are evident, with a growing preference for smart, energy-efficient, and long-lasting lighting systems that reduce downtime and maintenance costs in hazardous environments. The increasing emphasis on workplace safety regulations globally further fuels demand for certified hazardous lighting.
- Market Size Evolution: Forecasted growth from approximately USD 4,500 Million (2024) to USD 7,200 Million (2033).
- Adoption Rates: High and accelerating adoption of LED technology, replacing traditional lighting.
- Technological Disruptions: Integration of IoT, advanced thermal management, and explosion-proof designs with enhanced durability.
- Consumer Behavior Shifts: Demand for integrated safety solutions, reduced total cost of ownership, and compliance assurance.
- Market Penetration: Increasing penetration of hazardous lighting in emerging economies and specialized industrial applications.
Dominant Regions, Countries, or Segments in Hazardous Lighting Industry
The Oil and Gas end-user industry segment is currently the dominant force driving growth in the global hazardous lighting market, projected to contribute approximately 35% of the total market revenue by 2025. This dominance is fueled by ongoing exploration and production activities, particularly in offshore and deep-water regions, which necessitate high-specification explosion-proof lighting solutions for Zone 1 and Zone 21 environments. North America, specifically the United States, is the leading country market, driven by its extensive oil and gas infrastructure, coupled with stringent safety regulations and significant investments in petrochemical and chemical processing.
Dominant End-User Industry: Oil and Gas
- High demand for explosion-proof and intrinsically safe lighting in exploration, extraction, and refining operations.
- Significant investments in retrofitting existing facilities and constructing new complexes with advanced safety features.
- Growth in shale gas production and offshore drilling activities further boosts demand.
Dominant Region: North America
- Largest market share driven by robust Oil & Gas, Chemical, and Power Generation sectors.
- Stringent safety standards and regulatory enforcement encourage adoption of high-quality hazardous lighting.
- Technological advancements and early adoption of LED solutions contribute to market leadership.
Dominant Hazardous Zone: Zone 1 and Zone 21
- These zones represent areas where explosive atmospheres are likely to occur during normal operation, requiring the highest levels of protection.
- Demand for reliable and robust lighting solutions to prevent ignition sources is critical.
Dominant Type: LED Lighting
- Superior energy efficiency, extended lifespan, and reduced heat generation make LEDs ideal for hazardous environments.
- Advancements in LED technology allow for greater lumen output and durability, making them a cost-effective choice for long-term operational safety.
Hazardous Lighting Industry Product Landscape
The hazardous lighting industry is witnessing a significant surge in product innovations driven by the widespread adoption of LED technology. Modern hazardous lighting solutions feature enhanced durability, superior thermal management, and improved lumen output, making them ideal for Zone 0, Zone 1, and Zone 2 applications. These products are increasingly designed for ease of installation and maintenance, with integrated features such as smart controls and remote monitoring capabilities. Applications span across the most demanding industrial environments, from offshore oil rigs and chemical plants to pharmaceutical manufacturing facilities, ensuring optimal illumination and worker safety. Key performance metrics include energy efficiency ratings (lumens per watt), ingress protection (IP) ratings, and impact resistance (IK ratings), all crucial for compliance with international safety standards.
Key Drivers, Barriers & Challenges in Hazardous Lighting Industry
Key Drivers:
- Stricter Safety Regulations: Global emphasis on workplace safety and compliance with hazardous area classifications (ATEX, IECEx) is a primary growth driver.
- Technological Advancements in LED: Energy efficiency, extended lifespan, and improved performance of LEDs are making them the preferred choice.
- Industrial Growth in Emerging Economies: Expansion of Oil & Gas, Chemical, and Mining sectors in regions like Asia-Pacific and the Middle East creates new demand.
- Retrofitting of Older Facilities: Existing industrial sites are upgrading to meet modern safety standards, driving demand for new hazardous lighting systems.
Barriers & Challenges:
- High Initial Investment Cost: Certified hazardous lighting systems often have a higher upfront cost compared to standard lighting.
- Complex Certification Process: Obtaining necessary certifications for hazardous environments can be time-consuming and expensive.
- Supply Chain Disruptions: Global supply chain volatility can impact the availability and cost of specialized components.
- Competition from Non-Certified Products: In some less critical applications, there's a risk of lower-cost, non-certified alternatives being used, posing safety risks.
- Technological Obsolescence: Rapid advancements in LED technology can lead to quicker obsolescence of older models, requiring continuous R&D investment.
Emerging Opportunities in Hazardous Lighting Industry
Emerging opportunities in the hazardous lighting industry lie in the integration of smart technologies and the expansion into underserved markets. The development of IoT-enabled hazardous lighting solutions offers enhanced predictive maintenance, real-time monitoring of environmental conditions, and remote diagnostics, leading to reduced downtime and operational costs. Furthermore, there's a growing demand for specialized lighting solutions tailored for niche applications within sectors like renewable energy (e.g., wind farms) and advanced manufacturing. The increasing focus on sustainability and energy efficiency also presents an opportunity for the development of even more energy-efficient and environmentally friendly hazardous lighting products.
Growth Accelerators in the Hazardous Lighting Industry Industry
The long-term growth of the hazardous lighting industry is being significantly accelerated by ongoing technological breakthroughs, particularly in LED efficacy and fixture design. Strategic partnerships between lighting manufacturers and end-user industries, such as collaborations for developing custom solutions for specific operational challenges in the oil and gas sector, are also key growth catalysts. Market expansion strategies, including increasing penetration in emerging economies with developing industrial infrastructure and a growing emphasis on safety compliance, are vital. Moreover, the trend towards smart city initiatives and the increasing automation in industrial processes will necessitate more sophisticated and interconnected hazardous lighting systems, further propelling market growth.
Key Players Shaping the Hazardous Lighting Industry Market
- Hilclare Limited
- Thomas & Betts Corporation (ABB Ltd)
- Larson Electronics
- AZZ Lighting Systems
- GE Lighting LLC
- Chalmit Lighting Limited
- Worksite Lighting LLC
- Emerson Industrial Automation
- Digital Lumens Inc
- Unimar Inc
Notable Milestones in Hazardous Lighting Industry Sector
- 2019: Increased adoption of ATEX-certified Zone 2 LED luminaires across the European chemical industry.
- 2020: Launch of intrinsically safe smart lighting systems with integrated sensor capabilities for hazardous environments.
- 2021: Significant growth in demand for explosion-proof lighting in the Middle East for new oil and gas infrastructure projects.
- 2022: Advancements in thermal management technology for LED hazardous lighting, improving longevity in extreme temperatures.
- 2023: Growing emphasis on modular and easily maintainable hazardous lighting designs to reduce operational costs.
- 2024: Continued shift from HID and Fluorescent lighting to LED as the predominant technology for hazardous areas due to cost-effectiveness and performance.
In-Depth Hazardous Lighting Industry Market Outlook
The outlook for the hazardous lighting industry remains exceptionally positive, driven by an unwavering commitment to safety and operational efficiency across critical industrial sectors. The continued evolution of LED technology, promising further gains in energy efficiency, durability, and smart functionality, will be a paramount growth accelerator. Strategic collaborations aimed at developing bespoke lighting solutions for increasingly complex hazardous environments, coupled with the expansion of market reach into developing economies actively investing in industrial safety, will further solidify this upward trajectory. The increasing integration of intelligent control systems and predictive maintenance capabilities within hazardous lighting fixtures presents substantial opportunities for innovation and value creation, ensuring the industry's robust and sustained growth.
Hazardous Lighting Industry Segmentation
-
1. Type
- 1.1. LED Lighting
- 1.2. Incandescent Lighting
- 1.3. HID Lighting
- 1.4. Fluorescent Lighting
- 1.5. Other Types
-
2. Class
- 2.1. Class I
- 2.2. Class II
- 2.3. Class III
-
3. Hazardous Zone
- 3.1. Zone 0
- 3.2. Zone 20
- 3.3. Zone 1
- 3.4. Zone 21
- 3.5. Zone 22
-
4. End-user Industry
- 4.1. Oil and Gas
- 4.2. Power Generation
- 4.3. Chemical and Petrochemical
- 4.4. Pharmaceutical
- 4.5. Other End-user Industries
Hazardous Lighting Industry Segmentation By Geography
- 1. North America
- 2. Europe
- 3. Asia Pacific
- 4. Latin America
- 5. Middle East
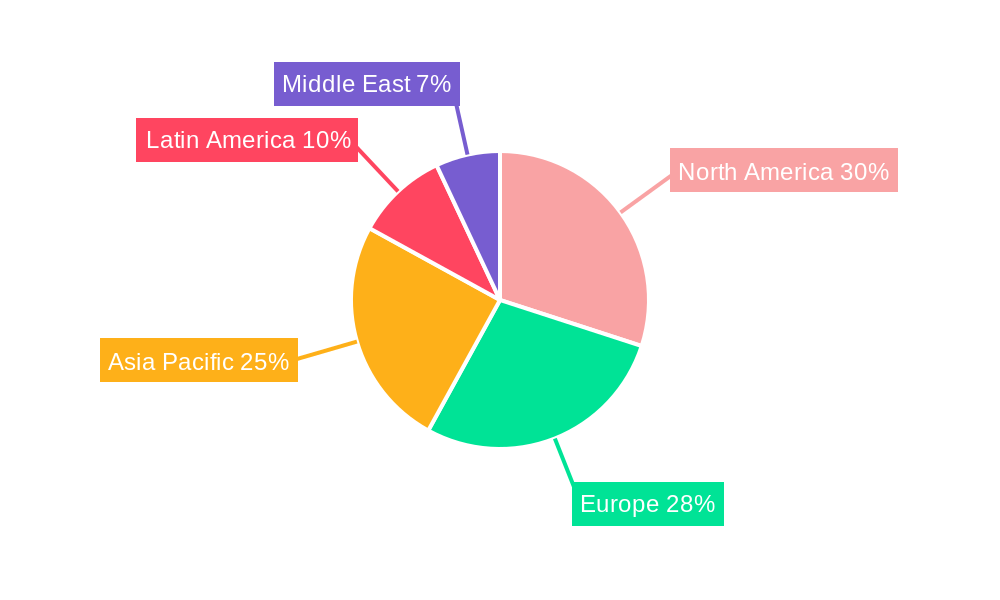
Hazardous Lighting Industry Regional Market Share
Geographic Coverage of Hazardous Lighting Industry
Hazardous Lighting Industry REPORT HIGHLIGHTS
| Aspects | Details |
|---|---|
| Study Period | 2020-2034 |
| Base Year | 2025 |
| Estimated Year | 2026 |
| Forecast Period | 2026-2034 |
| Historical Period | 2020-2025 |
| Growth Rate | CAGR of 6.6% from 2020-2034 |
| Segmentation |
|
Table of Contents
- 1. Introduction
- 1.1. Research Scope
- 1.2. Market Segmentation
- 1.3. Research Objective
- 1.4. Definitions and Assumptions
- 2. Executive Summary
- 2.1. Market Snapshot
- 3. Market Dynamics
- 3.1. Market Drivers
- 3.2. Market Restrains
- 3.3. Market Trends
- 3.4. Market Opportunities
- 4. Market Factor Analysis
- 4.1. Porters Five Forces
- 4.1.1. Bargaining Power of Suppliers
- 4.1.2. Bargaining Power of Buyers
- 4.1.3. Threat of New Entrants
- 4.1.4. Threat of Substitutes
- 4.1.5. Competitive Rivalry
- 4.2. PESTEL analysis
- 4.3. BCG Analysis
- 4.3.1. Stars (High Growth, High Market Share)
- 4.3.2. Cash Cows (Low Growth, High Market Share)
- 4.3.3. Question Mark (High Growth, Low Market Share)
- 4.3.4. Dogs (Low Growth, Low Market Share)
- 4.4. Ansoff Matrix Analysis
- 4.5. Supply Chain Analysis
- 4.6. Regulatory Landscape
- 4.7. Current Market Potential and Opportunity Assessment (TAM–SAM–SOM Framework)
- 4.8. NRP Analyst Note
- 4.1. Porters Five Forces
- 5. Market Analysis, Insights and Forecast 2021-2033
- 5.1. Market Analysis, Insights and Forecast - by Type
- 5.1.1. LED Lighting
- 5.1.2. Incandescent Lighting
- 5.1.3. HID Lighting
- 5.1.4. Fluorescent Lighting
- 5.1.5. Other Types
- 5.2. Market Analysis, Insights and Forecast - by Class
- 5.2.1. Class I
- 5.2.2. Class II
- 5.2.3. Class III
- 5.3. Market Analysis, Insights and Forecast - by Hazardous Zone
- 5.3.1. Zone 0
- 5.3.2. Zone 20
- 5.3.3. Zone 1
- 5.3.4. Zone 21
- 5.3.5. Zone 22
- 5.4. Market Analysis, Insights and Forecast - by End-user Industry
- 5.4.1. Oil and Gas
- 5.4.2. Power Generation
- 5.4.3. Chemical and Petrochemical
- 5.4.4. Pharmaceutical
- 5.4.5. Other End-user Industries
- 5.5. Market Analysis, Insights and Forecast - by Region
- 5.5.1. North America
- 5.5.2. Europe
- 5.5.3. Asia Pacific
- 5.5.4. Latin America
- 5.5.5. Middle East
- 5.1. Market Analysis, Insights and Forecast - by Type
- 6. Global Hazardous Lighting Industry Analysis, Insights and Forecast, 2021-2033
- 6.1. Market Analysis, Insights and Forecast - by Type
- 6.1.1. LED Lighting
- 6.1.2. Incandescent Lighting
- 6.1.3. HID Lighting
- 6.1.4. Fluorescent Lighting
- 6.1.5. Other Types
- 6.2. Market Analysis, Insights and Forecast - by Class
- 6.2.1. Class I
- 6.2.2. Class II
- 6.2.3. Class III
- 6.3. Market Analysis, Insights and Forecast - by Hazardous Zone
- 6.3.1. Zone 0
- 6.3.2. Zone 20
- 6.3.3. Zone 1
- 6.3.4. Zone 21
- 6.3.5. Zone 22
- 6.4. Market Analysis, Insights and Forecast - by End-user Industry
- 6.4.1. Oil and Gas
- 6.4.2. Power Generation
- 6.4.3. Chemical and Petrochemical
- 6.4.4. Pharmaceutical
- 6.4.5. Other End-user Industries
- 6.1. Market Analysis, Insights and Forecast - by Type
- 7. North America Hazardous Lighting Industry Analysis, Insights and Forecast, 2020-2032
- 7.1. Market Analysis, Insights and Forecast - by Type
- 7.1.1. LED Lighting
- 7.1.2. Incandescent Lighting
- 7.1.3. HID Lighting
- 7.1.4. Fluorescent Lighting
- 7.1.5. Other Types
- 7.2. Market Analysis, Insights and Forecast - by Class
- 7.2.1. Class I
- 7.2.2. Class II
- 7.2.3. Class III
- 7.3. Market Analysis, Insights and Forecast - by Hazardous Zone
- 7.3.1. Zone 0
- 7.3.2. Zone 20
- 7.3.3. Zone 1
- 7.3.4. Zone 21
- 7.3.5. Zone 22
- 7.4. Market Analysis, Insights and Forecast - by End-user Industry
- 7.4.1. Oil and Gas
- 7.4.2. Power Generation
- 7.4.3. Chemical and Petrochemical
- 7.4.4. Pharmaceutical
- 7.4.5. Other End-user Industries
- 7.1. Market Analysis, Insights and Forecast - by Type
- 8. Europe Hazardous Lighting Industry Analysis, Insights and Forecast, 2020-2032
- 8.1. Market Analysis, Insights and Forecast - by Type
- 8.1.1. LED Lighting
- 8.1.2. Incandescent Lighting
- 8.1.3. HID Lighting
- 8.1.4. Fluorescent Lighting
- 8.1.5. Other Types
- 8.2. Market Analysis, Insights and Forecast - by Class
- 8.2.1. Class I
- 8.2.2. Class II
- 8.2.3. Class III
- 8.3. Market Analysis, Insights and Forecast - by Hazardous Zone
- 8.3.1. Zone 0
- 8.3.2. Zone 20
- 8.3.3. Zone 1
- 8.3.4. Zone 21
- 8.3.5. Zone 22
- 8.4. Market Analysis, Insights and Forecast - by End-user Industry
- 8.4.1. Oil and Gas
- 8.4.2. Power Generation
- 8.4.3. Chemical and Petrochemical
- 8.4.4. Pharmaceutical
- 8.4.5. Other End-user Industries
- 8.1. Market Analysis, Insights and Forecast - by Type
- 9. Asia Pacific Hazardous Lighting Industry Analysis, Insights and Forecast, 2020-2032
- 9.1. Market Analysis, Insights and Forecast - by Type
- 9.1.1. LED Lighting
- 9.1.2. Incandescent Lighting
- 9.1.3. HID Lighting
- 9.1.4. Fluorescent Lighting
- 9.1.5. Other Types
- 9.2. Market Analysis, Insights and Forecast - by Class
- 9.2.1. Class I
- 9.2.2. Class II
- 9.2.3. Class III
- 9.3. Market Analysis, Insights and Forecast - by Hazardous Zone
- 9.3.1. Zone 0
- 9.3.2. Zone 20
- 9.3.3. Zone 1
- 9.3.4. Zone 21
- 9.3.5. Zone 22
- 9.4. Market Analysis, Insights and Forecast - by End-user Industry
- 9.4.1. Oil and Gas
- 9.4.2. Power Generation
- 9.4.3. Chemical and Petrochemical
- 9.4.4. Pharmaceutical
- 9.4.5. Other End-user Industries
- 9.1. Market Analysis, Insights and Forecast - by Type
- 10. Latin America Hazardous Lighting Industry Analysis, Insights and Forecast, 2020-2032
- 10.1. Market Analysis, Insights and Forecast - by Type
- 10.1.1. LED Lighting
- 10.1.2. Incandescent Lighting
- 10.1.3. HID Lighting
- 10.1.4. Fluorescent Lighting
- 10.1.5. Other Types
- 10.2. Market Analysis, Insights and Forecast - by Class
- 10.2.1. Class I
- 10.2.2. Class II
- 10.2.3. Class III
- 10.3. Market Analysis, Insights and Forecast - by Hazardous Zone
- 10.3.1. Zone 0
- 10.3.2. Zone 20
- 10.3.3. Zone 1
- 10.3.4. Zone 21
- 10.3.5. Zone 22
- 10.4. Market Analysis, Insights and Forecast - by End-user Industry
- 10.4.1. Oil and Gas
- 10.4.2. Power Generation
- 10.4.3. Chemical and Petrochemical
- 10.4.4. Pharmaceutical
- 10.4.5. Other End-user Industries
- 10.1. Market Analysis, Insights and Forecast - by Type
- 11. Middle East Hazardous Lighting Industry Analysis, Insights and Forecast, 2020-2032
- 11.1. Market Analysis, Insights and Forecast - by Type
- 11.1.1. LED Lighting
- 11.1.2. Incandescent Lighting
- 11.1.3. HID Lighting
- 11.1.4. Fluorescent Lighting
- 11.1.5. Other Types
- 11.2. Market Analysis, Insights and Forecast - by Class
- 11.2.1. Class I
- 11.2.2. Class II
- 11.2.3. Class III
- 11.3. Market Analysis, Insights and Forecast - by Hazardous Zone
- 11.3.1. Zone 0
- 11.3.2. Zone 20
- 11.3.3. Zone 1
- 11.3.4. Zone 21
- 11.3.5. Zone 22
- 11.4. Market Analysis, Insights and Forecast - by End-user Industry
- 11.4.1. Oil and Gas
- 11.4.2. Power Generation
- 11.4.3. Chemical and Petrochemical
- 11.4.4. Pharmaceutical
- 11.4.5. Other End-user Industries
- 11.1. Market Analysis, Insights and Forecast - by Type
- 12. Competitive Analysis
- 12.1. Company Profiles
- 12.1.1 Hilclare Limited
- 12.1.1.1. Company Overview
- 12.1.1.2. Products
- 12.1.1.3. Company Financials
- 12.1.1.4. SWOT Analysis
- 12.1.2 Thomas & Betts Corporation (ABB Ltd)
- 12.1.2.1. Company Overview
- 12.1.2.2. Products
- 12.1.2.3. Company Financials
- 12.1.2.4. SWOT Analysis
- 12.1.3 Larson Electronics
- 12.1.3.1. Company Overview
- 12.1.3.2. Products
- 12.1.3.3. Company Financials
- 12.1.3.4. SWOT Analysis
- 12.1.4 AZZ Lighting Systems
- 12.1.4.1. Company Overview
- 12.1.4.2. Products
- 12.1.4.3. Company Financials
- 12.1.4.4. SWOT Analysis
- 12.1.5 GE Lighting LLC
- 12.1.5.1. Company Overview
- 12.1.5.2. Products
- 12.1.5.3. Company Financials
- 12.1.5.4. SWOT Analysis
- 12.1.6 Chalmit Lighting Limited
- 12.1.6.1. Company Overview
- 12.1.6.2. Products
- 12.1.6.3. Company Financials
- 12.1.6.4. SWOT Analysis
- 12.1.7 Worksite Lighting LLC
- 12.1.7.1. Company Overview
- 12.1.7.2. Products
- 12.1.7.3. Company Financials
- 12.1.7.4. SWOT Analysis
- 12.1.8 Emerson Industrial Automation
- 12.1.8.1. Company Overview
- 12.1.8.2. Products
- 12.1.8.3. Company Financials
- 12.1.8.4. SWOT Analysis
- 12.1.9 Digital Lumens Inc
- 12.1.9.1. Company Overview
- 12.1.9.2. Products
- 12.1.9.3. Company Financials
- 12.1.9.4. SWOT Analysis
- 12.1.10 Unimar Inc
- 12.1.10.1. Company Overview
- 12.1.10.2. Products
- 12.1.10.3. Company Financials
- 12.1.10.4. SWOT Analysis
- 12.1.1 Hilclare Limited
- 12.2. Market Entropy
- 12.2.1 Company's Key Areas Served
- 12.2.2 Recent Developments
- 12.3. Company Market Share Analysis 2025
- 12.3.1 Top 5 Companies Market Share Analysis
- 12.3.2 Top 3 Companies Market Share Analysis
- 12.4. List of Potential Customers
- 13. Research Methodology
List of Figures
- Figure 1: Global Hazardous Lighting Industry Revenue Breakdown (billion, %) by Region 2025 & 2033
- Figure 2: North America Hazardous Lighting Industry Revenue (billion), by Type 2025 & 2033
- Figure 3: North America Hazardous Lighting Industry Revenue Share (%), by Type 2025 & 2033
- Figure 4: North America Hazardous Lighting Industry Revenue (billion), by Class 2025 & 2033
- Figure 5: North America Hazardous Lighting Industry Revenue Share (%), by Class 2025 & 2033
- Figure 6: North America Hazardous Lighting Industry Revenue (billion), by Hazardous Zone 2025 & 2033
- Figure 7: North America Hazardous Lighting Industry Revenue Share (%), by Hazardous Zone 2025 & 2033
- Figure 8: North America Hazardous Lighting Industry Revenue (billion), by End-user Industry 2025 & 2033
- Figure 9: North America Hazardous Lighting Industry Revenue Share (%), by End-user Industry 2025 & 2033
- Figure 10: North America Hazardous Lighting Industry Revenue (billion), by Country 2025 & 2033
- Figure 11: North America Hazardous Lighting Industry Revenue Share (%), by Country 2025 & 2033
- Figure 12: Europe Hazardous Lighting Industry Revenue (billion), by Type 2025 & 2033
- Figure 13: Europe Hazardous Lighting Industry Revenue Share (%), by Type 2025 & 2033
- Figure 14: Europe Hazardous Lighting Industry Revenue (billion), by Class 2025 & 2033
- Figure 15: Europe Hazardous Lighting Industry Revenue Share (%), by Class 2025 & 2033
- Figure 16: Europe Hazardous Lighting Industry Revenue (billion), by Hazardous Zone 2025 & 2033
- Figure 17: Europe Hazardous Lighting Industry Revenue Share (%), by Hazardous Zone 2025 & 2033
- Figure 18: Europe Hazardous Lighting Industry Revenue (billion), by End-user Industry 2025 & 2033
- Figure 19: Europe Hazardous Lighting Industry Revenue Share (%), by End-user Industry 2025 & 2033
- Figure 20: Europe Hazardous Lighting Industry Revenue (billion), by Country 2025 & 2033
- Figure 21: Europe Hazardous Lighting Industry Revenue Share (%), by Country 2025 & 2033
- Figure 22: Asia Pacific Hazardous Lighting Industry Revenue (billion), by Type 2025 & 2033
- Figure 23: Asia Pacific Hazardous Lighting Industry Revenue Share (%), by Type 2025 & 2033
- Figure 24: Asia Pacific Hazardous Lighting Industry Revenue (billion), by Class 2025 & 2033
- Figure 25: Asia Pacific Hazardous Lighting Industry Revenue Share (%), by Class 2025 & 2033
- Figure 26: Asia Pacific Hazardous Lighting Industry Revenue (billion), by Hazardous Zone 2025 & 2033
- Figure 27: Asia Pacific Hazardous Lighting Industry Revenue Share (%), by Hazardous Zone 2025 & 2033
- Figure 28: Asia Pacific Hazardous Lighting Industry Revenue (billion), by End-user Industry 2025 & 2033
- Figure 29: Asia Pacific Hazardous Lighting Industry Revenue Share (%), by End-user Industry 2025 & 2033
- Figure 30: Asia Pacific Hazardous Lighting Industry Revenue (billion), by Country 2025 & 2033
- Figure 31: Asia Pacific Hazardous Lighting Industry Revenue Share (%), by Country 2025 & 2033
- Figure 32: Latin America Hazardous Lighting Industry Revenue (billion), by Type 2025 & 2033
- Figure 33: Latin America Hazardous Lighting Industry Revenue Share (%), by Type 2025 & 2033
- Figure 34: Latin America Hazardous Lighting Industry Revenue (billion), by Class 2025 & 2033
- Figure 35: Latin America Hazardous Lighting Industry Revenue Share (%), by Class 2025 & 2033
- Figure 36: Latin America Hazardous Lighting Industry Revenue (billion), by Hazardous Zone 2025 & 2033
- Figure 37: Latin America Hazardous Lighting Industry Revenue Share (%), by Hazardous Zone 2025 & 2033
- Figure 38: Latin America Hazardous Lighting Industry Revenue (billion), by End-user Industry 2025 & 2033
- Figure 39: Latin America Hazardous Lighting Industry Revenue Share (%), by End-user Industry 2025 & 2033
- Figure 40: Latin America Hazardous Lighting Industry Revenue (billion), by Country 2025 & 2033
- Figure 41: Latin America Hazardous Lighting Industry Revenue Share (%), by Country 2025 & 2033
- Figure 42: Middle East Hazardous Lighting Industry Revenue (billion), by Type 2025 & 2033
- Figure 43: Middle East Hazardous Lighting Industry Revenue Share (%), by Type 2025 & 2033
- Figure 44: Middle East Hazardous Lighting Industry Revenue (billion), by Class 2025 & 2033
- Figure 45: Middle East Hazardous Lighting Industry Revenue Share (%), by Class 2025 & 2033
- Figure 46: Middle East Hazardous Lighting Industry Revenue (billion), by Hazardous Zone 2025 & 2033
- Figure 47: Middle East Hazardous Lighting Industry Revenue Share (%), by Hazardous Zone 2025 & 2033
- Figure 48: Middle East Hazardous Lighting Industry Revenue (billion), by End-user Industry 2025 & 2033
- Figure 49: Middle East Hazardous Lighting Industry Revenue Share (%), by End-user Industry 2025 & 2033
- Figure 50: Middle East Hazardous Lighting Industry Revenue (billion), by Country 2025 & 2033
- Figure 51: Middle East Hazardous Lighting Industry Revenue Share (%), by Country 2025 & 2033
List of Tables
- Table 1: Global Hazardous Lighting Industry Revenue billion Forecast, by Type 2020 & 2033
- Table 2: Global Hazardous Lighting Industry Revenue billion Forecast, by Class 2020 & 2033
- Table 3: Global Hazardous Lighting Industry Revenue billion Forecast, by Hazardous Zone 2020 & 2033
- Table 4: Global Hazardous Lighting Industry Revenue billion Forecast, by End-user Industry 2020 & 2033
- Table 5: Global Hazardous Lighting Industry Revenue billion Forecast, by Region 2020 & 2033
- Table 6: Global Hazardous Lighting Industry Revenue billion Forecast, by Type 2020 & 2033
- Table 7: Global Hazardous Lighting Industry Revenue billion Forecast, by Class 2020 & 2033
- Table 8: Global Hazardous Lighting Industry Revenue billion Forecast, by Hazardous Zone 2020 & 2033
- Table 9: Global Hazardous Lighting Industry Revenue billion Forecast, by End-user Industry 2020 & 2033
- Table 10: Global Hazardous Lighting Industry Revenue billion Forecast, by Country 2020 & 2033
- Table 11: Global Hazardous Lighting Industry Revenue billion Forecast, by Type 2020 & 2033
- Table 12: Global Hazardous Lighting Industry Revenue billion Forecast, by Class 2020 & 2033
- Table 13: Global Hazardous Lighting Industry Revenue billion Forecast, by Hazardous Zone 2020 & 2033
- Table 14: Global Hazardous Lighting Industry Revenue billion Forecast, by End-user Industry 2020 & 2033
- Table 15: Global Hazardous Lighting Industry Revenue billion Forecast, by Country 2020 & 2033
- Table 16: Global Hazardous Lighting Industry Revenue billion Forecast, by Type 2020 & 2033
- Table 17: Global Hazardous Lighting Industry Revenue billion Forecast, by Class 2020 & 2033
- Table 18: Global Hazardous Lighting Industry Revenue billion Forecast, by Hazardous Zone 2020 & 2033
- Table 19: Global Hazardous Lighting Industry Revenue billion Forecast, by End-user Industry 2020 & 2033
- Table 20: Global Hazardous Lighting Industry Revenue billion Forecast, by Country 2020 & 2033
- Table 21: Global Hazardous Lighting Industry Revenue billion Forecast, by Type 2020 & 2033
- Table 22: Global Hazardous Lighting Industry Revenue billion Forecast, by Class 2020 & 2033
- Table 23: Global Hazardous Lighting Industry Revenue billion Forecast, by Hazardous Zone 2020 & 2033
- Table 24: Global Hazardous Lighting Industry Revenue billion Forecast, by End-user Industry 2020 & 2033
- Table 25: Global Hazardous Lighting Industry Revenue billion Forecast, by Country 2020 & 2033
- Table 26: Global Hazardous Lighting Industry Revenue billion Forecast, by Type 2020 & 2033
- Table 27: Global Hazardous Lighting Industry Revenue billion Forecast, by Class 2020 & 2033
- Table 28: Global Hazardous Lighting Industry Revenue billion Forecast, by Hazardous Zone 2020 & 2033
- Table 29: Global Hazardous Lighting Industry Revenue billion Forecast, by End-user Industry 2020 & 2033
- Table 30: Global Hazardous Lighting Industry Revenue billion Forecast, by Country 2020 & 2033
Frequently Asked Questions
1. What is the projected Compound Annual Growth Rate (CAGR) of the Hazardous Lighting Industry?
The projected CAGR is approximately 6.6%.
2. Which companies are prominent players in the Hazardous Lighting Industry?
Key companies in the market include Hilclare Limited, Thomas & Betts Corporation (ABB Ltd), Larson Electronics, AZZ Lighting Systems, GE Lighting LLC, Chalmit Lighting Limited, Worksite Lighting LLC, Emerson Industrial Automation, Digital Lumens Inc, Unimar Inc.
3. What are the main segments of the Hazardous Lighting Industry?
The market segments include Type, Class, Hazardous Zone, End-user Industry.
4. Can you provide details about the market size?
The market size is estimated to be USD 5.94 billion as of 2022.
5. What are some drivers contributing to market growth?
Replacement of Traditional Lighting Systems with LEDs; Regulatory Standards Promoting the Use of Lighting.
6. What are the notable trends driving market growth?
LED Lighting to Account for Significant Market Share.
7. Are there any restraints impacting market growth?
Rising Environmental Concerns.
8. Can you provide examples of recent developments in the market?
N/A
9. What pricing options are available for accessing the report?
Pricing options include single-user, multi-user, and enterprise licenses priced at USD 4750, USD 5250, and USD 8750 respectively.
10. Is the market size provided in terms of value or volume?
The market size is provided in terms of value, measured in billion.
11. Are there any specific market keywords associated with the report?
Yes, the market keyword associated with the report is "Hazardous Lighting Industry," which aids in identifying and referencing the specific market segment covered.
12. How do I determine which pricing option suits my needs best?
The pricing options vary based on user requirements and access needs. Individual users may opt for single-user licenses, while businesses requiring broader access may choose multi-user or enterprise licenses for cost-effective access to the report.
13. Are there any additional resources or data provided in the Hazardous Lighting Industry report?
While the report offers comprehensive insights, it's advisable to review the specific contents or supplementary materials provided to ascertain if additional resources or data are available.
14. How can I stay updated on further developments or reports in the Hazardous Lighting Industry?
To stay informed about further developments, trends, and reports in the Hazardous Lighting Industry, consider subscribing to industry newsletters, following relevant companies and organizations, or regularly checking reputable industry news sources and publications.
Methodology
Step 1 - Identification of Relevant Samples Size from Population Database


Step 2 - Approaches for Defining Global Market Size (Value, Volume* & Price*)

Note*: In applicable scenarios
Step 3 - Data Sources
Primary Research
- Web Analytics
- Survey Reports
- Research Institute
- Latest Research Reports
- Opinion Leaders
Secondary Research
- Annual Reports
- White Paper
- Latest Press Release
- Industry Association
- Paid Database
- Investor Presentations

Step 4 - Data Triangulation
Involves using different sources of information in order to increase the validity of a study
These sources are likely to be stakeholders in a program - participants, other researchers, program staff, other community members, and so on.
Then we put all data in single framework & apply various statistical tools to find out the dynamic on the market.
During the analysis stage, feedback from the stakeholder groups would be compared to determine areas of agreement as well as areas of divergence