

Key Insights
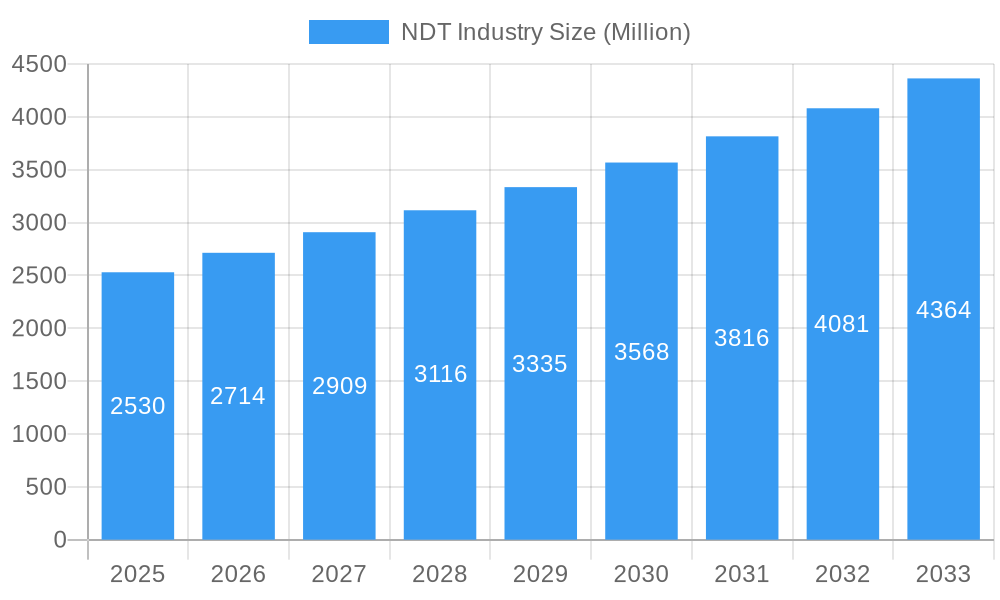
The global Non-Destructive Testing (NDT) market is poised for significant expansion, driven by an increasing emphasis on asset integrity, safety regulations, and the growing demand for quality assurance across diverse industries. Valued at an estimated \$2.53 billion in 2025, the market is projected to grow at a robust Compound Annual Growth Rate (CAGR) of 7.35% throughout the forecast period (2025-2033). This upward trajectory is largely attributed to the critical role NDT plays in preventing catastrophic failures, reducing maintenance costs, and ensuring compliance with stringent industry standards. Key drivers include the burgeoning oil and gas sector, where maintaining the integrity of pipelines and exploration equipment is paramount, and the rapidly expanding power and energy sector, which requires reliable inspection of renewable energy infrastructure and traditional power plants. The construction industry's continuous development and the automotive sector's focus on vehicle safety and efficiency further bolster market demand.
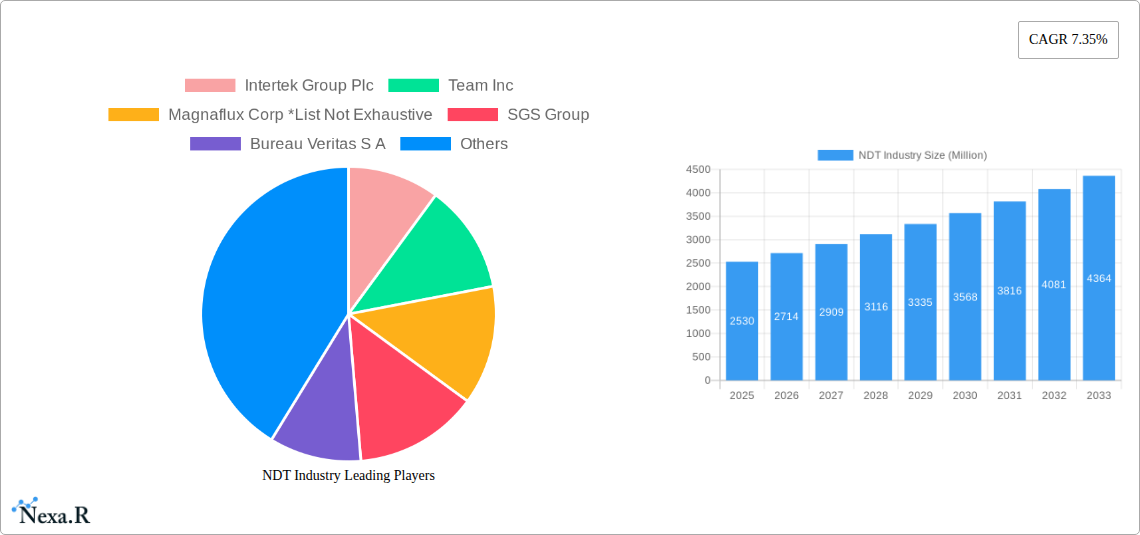
NDT Industry Market Size (In Billion)
The NDT market is characterized by a dynamic interplay of technological advancements and evolving end-user needs. Innovations in testing technologies, such as advanced radiography, ultrasonic, and eddy current testing, are enhancing accuracy, speed, and efficiency, thereby expanding their application scope. The services segment, encompassing inspection, calibration, and consulting, is expected to witness substantial growth as industries increasingly outsource NDT functions to specialized providers to leverage expertise and advanced equipment. Geographically, North America and Europe currently dominate the market, owing to established industrial bases and strict regulatory frameworks. However, the Asia Pacific region is anticipated to emerge as a significant growth engine, fueled by rapid industrialization, infrastructure development, and rising investments in manufacturing and energy projects in countries like China and India. While the market is on a strong growth path, potential restraints such as the high initial cost of advanced NDT equipment and the shortage of skilled NDT technicians could present challenges.
NDT Industry Company Market Share
NDT Industry Market Analysis: Equipment, Services, and Technologies (2019-2033)
This comprehensive report delivers an in-depth analysis of the Non-Destructive Testing (NDT) industry, providing critical insights into its market dynamics, growth trends, regional dominance, product landscape, key drivers, barriers, challenges, emerging opportunities, growth accelerators, and key players. Covering the historical period from 2019 to 2024, base year 2025, and a forecast period extending to 2033, this report is an indispensable resource for industry professionals, investors, and stakeholders seeking to understand the evolving NDT market. We meticulously analyze parent and child market segments, including specialized testing technologies like Radiography Testing, Ultrasonic Testing, Magnetic Particle Testing, Liquid Penetrant Testing, Visual Inspection Testing, and Eddy Current Testing, alongside critical end-user industries such as Oil and Gas, Power and Energy, Construction, Automotive and Transportation, Aerospace, and Defense. All market values are presented in millions of units for clarity and actionable insights.
NDT Industry Market Dynamics & Structure
The NDT industry exhibits a moderately consolidated market structure, characterized by a blend of large, established global players and numerous specialized regional providers. Technological innovation remains a primary driver, with significant investments in developing advanced NDT methods and digital solutions to enhance inspection accuracy, efficiency, and data analysis. The regulatory landscape plays a crucial role, with stringent safety standards and quality control mandates across various end-user industries compelling organizations to adopt robust NDT practices. Competitive product substitutes, while present in the form of traditional inspection methods, are increasingly being outpaced by the superior capabilities offered by modern NDT technologies. End-user demographics reveal a growing demand for NDT services driven by aging infrastructure, the need for asset integrity management, and the expansion of manufacturing and energy sectors. Mergers and Acquisitions (M&A) trends are evident as key players seek to expand their service portfolios, geographic reach, and technological capabilities.
- Market Concentration: Moderate, with a few dominant global players and a fragmented base of niche service providers.
- Technological Innovation Drivers: Demand for increased accuracy, automation, remote inspection, and AI-powered data analysis.
- Regulatory Frameworks: Stringent safety and quality regulations in Oil & Gas, Aerospace, and Power & Energy industries are major adoption catalysts.
- Competitive Product Substitutes: Traditional visual inspections and destructive testing methods are gradually being replaced by advanced NDT solutions.
- End-User Demographics: Increasing focus on asset integrity, predictive maintenance, and compliance across all major industrial sectors.
- M&A Trends: Strategic acquisitions aimed at consolidating market share, acquiring new technologies, and expanding service offerings.
NDT Industry Growth Trends & Insights
The NDT industry is poised for significant expansion, driven by an ever-increasing global emphasis on safety, asset integrity, and quality assurance across a multitude of industrial sectors. The market size is projected to witness a substantial Compound Annual Growth Rate (CAGR) throughout the forecast period, fueled by both organic growth and strategic consolidation. Adoption rates for advanced NDT equipment and services are accelerating as industries recognize the long-term cost savings and risk mitigation benefits. Technological disruptions, particularly the integration of artificial intelligence (AI), machine learning (ML), and advanced sensor technologies, are transforming inspection methodologies, enabling real-time data analysis and predictive maintenance capabilities. Consumer behavior shifts are evident, with a growing preference for integrated inspection solutions and digital platforms that offer end-to-end asset management and reporting. The demand for specialized NDT services in sectors like aerospace, automotive, and renewable energy is on an upward trajectory, propelled by the complexity of modern materials and manufacturing processes. Furthermore, the increasing stringency of regulatory compliance and the need to extend the lifespan of critical infrastructure are compelling organizations to invest more heavily in NDT solutions. The global NDT market size is estimated to reach approximately $15,000 million by 2025 and is projected to grow to $25,000 million by 2033, exhibiting a robust CAGR of approximately 6.5% during the forecast period. This growth is underpinned by an increasing market penetration of automated NDT systems, which are expected to account for over 40% of the equipment market by 2033.
Dominant Regions, Countries, or Segments in NDT Industry
The North America region currently dominates the NDT industry, driven by a mature and highly regulated industrial landscape with a strong presence in the Oil and Gas, Aerospace, and Power and Energy sectors. The United States, in particular, is a key market due to its advanced manufacturing capabilities, extensive infrastructure requiring regular inspection, and a proactive approach to safety regulations. The region's robust economy, coupled with significant investments in technological innovation, further bolsters its leadership position.
- Key Drivers in North America:
- Stringent safety and environmental regulations in Oil & Gas and Power sectors.
- High demand for asset integrity management and predictive maintenance.
- Significant presence of major aerospace and automotive manufacturing hubs.
- Early adoption and integration of advanced NDT technologies like phased array ultrasonics and digital radiography.
- Substantial infrastructure renewal projects requiring extensive inspection services.
The Services segment within the NDT industry consistently holds the largest market share, accounting for an estimated 55% of the total market value in 2025, projected to reach approximately $8,250 million. This dominance is attributed to the continuous need for skilled personnel to perform inspections, interpret data, and provide comprehensive reporting. The complexity and specialized nature of many NDT techniques necessitate expert intervention, driving sustained demand for NDT service providers. The Oil and Gas end-user industry remains a pivotal segment, contributing significantly to market revenue, estimated at $4,500 million in 2025. This is due to the critical need for pipeline integrity, offshore platform inspections, and asset maintenance in a sector with inherently high-risk operations.
- Dominance Factors in the Services Segment:
- Requirement for specialized expertise and certified technicians.
- Outsourcing trends for non-core inspection activities.
- Demand for comprehensive inspection, testing, and certification (ITC) solutions.
- Growth in remote and automated inspection services.
The Radiography Testing technology segment is a significant contributor, with an estimated market value of $2,500 million in 2025. Its widespread application in industries like manufacturing, construction, and aerospace for detecting internal flaws and defects ensures its sustained market presence. However, Ultrasonic Testing is emerging as a strong contender with a projected CAGR of over 7%, driven by its versatility, portability, and advanced capabilities such as phased array and guided wave ultrasonics.
NDT Industry Product Landscape
The NDT industry is characterized by a dynamic product landscape focused on enhancing inspection efficiency, accuracy, and data management. Innovations are centered around portable and automated equipment, integrating digital technologies for real-time analysis and cloud-based reporting. Key product developments include advanced ultrasonic phased array systems for complex geometries, digital radiography units offering improved image quality and reduced exposure times, and sophisticated liquid penetrant inspection systems with enhanced sensitivity. Eddy current testing devices are evolving for faster surface crack detection, while magnetic particle testing remains crucial for ferrous material flaw identification. Visual inspection technologies are increasingly incorporating high-resolution cameras, drones, and robotic systems for remote and hazardous environment inspections. These advancements enable precise defect detection, material characterization, and condition monitoring, directly contributing to asset integrity and operational safety across various end-user industries.
Key Drivers, Barriers & Challenges in NDT Industry
Key Drivers:
- Safety and Regulatory Compliance: Stringent mandates across industries like Oil & Gas, Aerospace, and Construction are paramount drivers, necessitating robust NDT solutions for asset integrity and public safety.
- Technological Advancements: Continuous innovation in NDT equipment and software, including AI integration and automation, enhances inspection efficiency and accuracy.
- Aging Infrastructure: The need to maintain and extend the lifespan of existing infrastructure, such as bridges, pipelines, and power plants, fuels demand for regular NDT inspections.
- Growth in Manufacturing and Emerging Industries: Expansion in sectors like renewable energy, electric vehicles, and additive manufacturing creates new applications and demand for specialized NDT techniques.
Barriers & Challenges:
- High Initial Investment: The cost of advanced NDT equipment and specialized training can be a significant barrier for smaller enterprises.
- Skilled Workforce Shortage: A persistent challenge is the availability of adequately trained and certified NDT technicians, impacting service delivery capacity.
- Standardization and Interoperability: Variations in international standards and the need for seamless data integration across different NDT systems can pose challenges.
- Economic Downturns and Geopolitical Instability: Fluctuations in global economies and supply chain disruptions can impact project timelines and investment in NDT services, estimated to cause a potential 5-10% dip in project initiation during periods of severe economic contraction.
Emerging Opportunities in NDT Industry
Emerging opportunities within the NDT industry are largely driven by the integration of digital technologies and the expansion into new application areas. The burgeoning field of additive manufacturing presents a unique opportunity for NDT to develop specialized inspection techniques for complex 3D printed components. The growth of the renewable energy sector, particularly wind and solar power, creates a substantial demand for NDT services in the construction, maintenance, and integrity assessment of turbines and solar farms. Furthermore, the increasing adoption of AI and machine learning in NDT is unlocking new possibilities for predictive maintenance, anomaly detection, and automated data analysis, enhancing the value proposition for end-users. Remote and drone-based NDT inspections are gaining traction in hazardous or inaccessible environments, offering cost efficiencies and improved safety, with an estimated market growth of 15-20% for drone-based services in the next five years. The circular economy initiatives also present opportunities for NDT in assessing the condition and recyclability of materials.
Growth Accelerators in the NDT Industry Industry
The NDT industry's long-term growth is significantly accelerated by breakthroughs in digital NDT technologies, including the widespread adoption of AI for data interpretation and predictive analytics. Strategic partnerships between equipment manufacturers, software developers, and service providers are fostering integrated solutions and expanding market reach. Market expansion strategies, particularly in developing economies with burgeoning industrial sectors, are opening up new revenue streams. The increasing demand for remote and automated inspection capabilities, driven by safety concerns and efficiency gains, is a major growth catalyst. Furthermore, the continuous evolution of materials science, leading to more complex and lighter structures, necessitates the development and application of advanced NDT methods, ensuring sustained innovation and market growth.
Key Players Shaping the NDT Industry Market
Intertek Group Plc Team Inc Magnaflux Corp SGS Group Bureau Veritas S A Nikon Metrology NV Fujifilm Corporation TÜV Rheinland AG Mistras Group Inc Yxlon International Gmbh (Comet Holding Ag) Applus Services Olympus Corporation GE Measurement & Control Solutions
Notable Milestones in NDT Industry Sector
- 2019: Introduction of advanced AI-powered data analysis platforms for ultrasonic testing, improving defect characterization accuracy by up to 20%.
- 2020: Increased adoption of phased array ultrasonic testing (PAUT) in aerospace for critical component inspection, following new regulatory approvals.
- 2021: Major NDT service providers report a surge in demand for pipeline integrity inspections due to aging infrastructure and increased energy security concerns.
- 2022: Significant investments in drone-based visual inspection technologies for wind turbines, enhancing safety and reducing inspection costs by an estimated 30%.
- 2023: Launch of new portable digital radiography systems offering faster image acquisition and improved resolution, catering to field inspection needs.
- 2024: Growing integration of cloud-based platforms for NDT data management and reporting, enabling better collaboration and traceability across projects.
- 2025 (Estimated): Expected introduction of next-generation guided wave ultrasonic systems for long-range pipeline and structural monitoring.
In-Depth NDT Industry Market Outlook
The future outlook for the NDT industry is exceptionally robust, characterized by sustained growth driven by technological innovation and increasing industry reliance on asset integrity and safety. The continued integration of digital solutions, including AI, IoT, and advanced analytics, will transform inspection methodologies, enabling more predictive and proactive maintenance strategies. Emerging markets will present significant growth opportunities as industrialization expands, requiring advanced inspection capabilities. Strategic collaborations and potential mergers will continue to shape the competitive landscape, fostering consolidation and the delivery of comprehensive, end-to-end NDT solutions. The industry is well-positioned to capitalize on global trends such as infrastructure development, renewable energy expansion, and stringent safety regulations, ensuring a dynamic and expanding market for years to come.
NDT Industry Segmentation
-
1. Type
- 1.1. Equipment
- 1.2. Services
-
2. Testing Technology
- 2.1. Radiography Testing
- 2.2. Ultrasonic Testing
- 2.3. Magnetic Particle Testing
- 2.4. Liquid Penetrant Testing
- 2.5. Visual Inspection Testing
- 2.6. Eddy Current Testing
- 2.7. Other Testing Technologies
-
3. End-user Industry
- 3.1. Oil and Gas
- 3.2. Power and Energy
- 3.3. Construction
- 3.4. Automotive and Transportation
- 3.5. Aerospace
- 3.6. Defense
- 3.7. Other End User Industries
NDT Industry Segmentation By Geography
-
1. North America
- 1.1. United States
- 1.2. Canada
-
2. Europe
- 2.1. Germany
- 2.2. United Kingdom
- 2.3. France
-
3. Asia
- 3.1. China
- 3.2. Japan
- 3.3. India
- 4. Australia and New Zealand
-
5. Latin America
- 5.1. Brazil
- 5.2. Argentina
- 5.3. Mexico
-
6. Middle East and Africa
- 6.1. United Arab Emirates
- 6.2. Saudi Arabia
- 6.3. South Africa
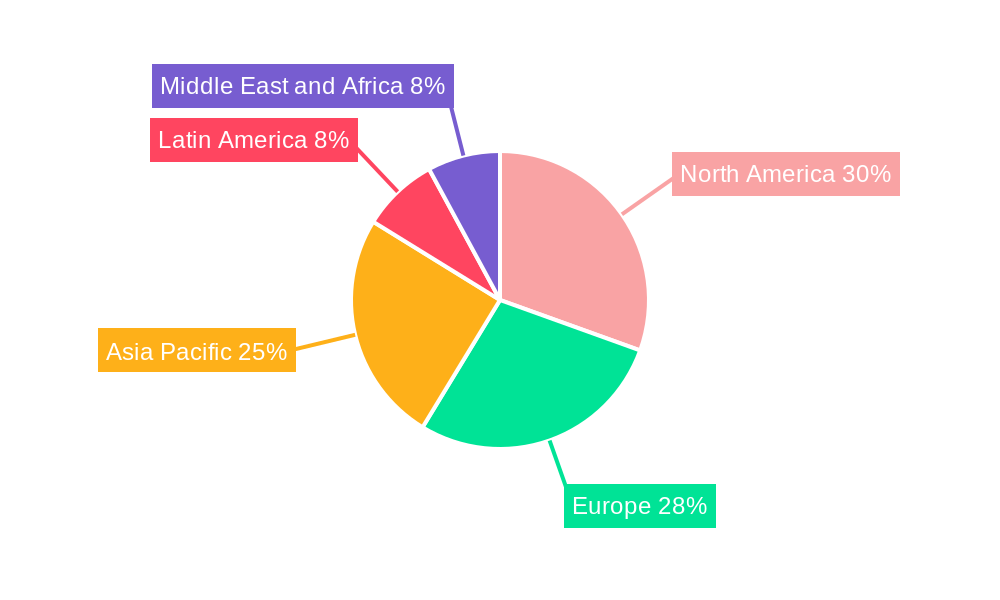
NDT Industry Regional Market Share
Geographic Coverage of NDT Industry
NDT Industry REPORT HIGHLIGHTS
| Aspects | Details |
|---|---|
| Study Period | 2020-2034 |
| Base Year | 2025 |
| Estimated Year | 2026 |
| Forecast Period | 2026-2034 |
| Historical Period | 2020-2025 |
| Growth Rate | CAGR of 7.35% from 2020-2034 |
| Segmentation |
|
Table of Contents
- 1. Introduction
- 1.1. Research Scope
- 1.2. Market Segmentation
- 1.3. Research Objective
- 1.4. Definitions and Assumptions
- 2. Executive Summary
- 2.1. Market Snapshot
- 3. Market Dynamics
- 3.1. Market Drivers
- 3.2. Market Restrains
- 3.3. Market Trends
- 3.4. Market Opportunities
- 4. Market Factor Analysis
- 4.1. Porters Five Forces
- 4.1.1. Bargaining Power of Suppliers
- 4.1.2. Bargaining Power of Buyers
- 4.1.3. Threat of New Entrants
- 4.1.4. Threat of Substitutes
- 4.1.5. Competitive Rivalry
- 4.2. PESTEL analysis
- 4.3. BCG Analysis
- 4.3.1. Stars (High Growth, High Market Share)
- 4.3.2. Cash Cows (Low Growth, High Market Share)
- 4.3.3. Question Mark (High Growth, Low Market Share)
- 4.3.4. Dogs (Low Growth, Low Market Share)
- 4.4. Ansoff Matrix Analysis
- 4.5. Supply Chain Analysis
- 4.6. Regulatory Landscape
- 4.7. Current Market Potential and Opportunity Assessment (TAM–SAM–SOM Framework)
- 4.8. NRP Analyst Note
- 4.1. Porters Five Forces
- 5. Market Analysis, Insights and Forecast 2021-2033
- 5.1. Market Analysis, Insights and Forecast - by Type
- 5.1.1. Equipment
- 5.1.2. Services
- 5.2. Market Analysis, Insights and Forecast - by Testing Technology
- 5.2.1. Radiography Testing
- 5.2.2. Ultrasonic Testing
- 5.2.3. Magnetic Particle Testing
- 5.2.4. Liquid Penetrant Testing
- 5.2.5. Visual Inspection Testing
- 5.2.6. Eddy Current Testing
- 5.2.7. Other Testing Technologies
- 5.3. Market Analysis, Insights and Forecast - by End-user Industry
- 5.3.1. Oil and Gas
- 5.3.2. Power and Energy
- 5.3.3. Construction
- 5.3.4. Automotive and Transportation
- 5.3.5. Aerospace
- 5.3.6. Defense
- 5.3.7. Other End User Industries
- 5.4. Market Analysis, Insights and Forecast - by Region
- 5.4.1. North America
- 5.4.2. Europe
- 5.4.3. Asia
- 5.4.4. Australia and New Zealand
- 5.4.5. Latin America
- 5.4.6. Middle East and Africa
- 5.1. Market Analysis, Insights and Forecast - by Type
- 6. Global NDT Industry Analysis, Insights and Forecast, 2021-2033
- 6.1. Market Analysis, Insights and Forecast - by Type
- 6.1.1. Equipment
- 6.1.2. Services
- 6.2. Market Analysis, Insights and Forecast - by Testing Technology
- 6.2.1. Radiography Testing
- 6.2.2. Ultrasonic Testing
- 6.2.3. Magnetic Particle Testing
- 6.2.4. Liquid Penetrant Testing
- 6.2.5. Visual Inspection Testing
- 6.2.6. Eddy Current Testing
- 6.2.7. Other Testing Technologies
- 6.3. Market Analysis, Insights and Forecast - by End-user Industry
- 6.3.1. Oil and Gas
- 6.3.2. Power and Energy
- 6.3.3. Construction
- 6.3.4. Automotive and Transportation
- 6.3.5. Aerospace
- 6.3.6. Defense
- 6.3.7. Other End User Industries
- 6.1. Market Analysis, Insights and Forecast - by Type
- 7. North America NDT Industry Analysis, Insights and Forecast, 2020-2032
- 7.1. Market Analysis, Insights and Forecast - by Type
- 7.1.1. Equipment
- 7.1.2. Services
- 7.2. Market Analysis, Insights and Forecast - by Testing Technology
- 7.2.1. Radiography Testing
- 7.2.2. Ultrasonic Testing
- 7.2.3. Magnetic Particle Testing
- 7.2.4. Liquid Penetrant Testing
- 7.2.5. Visual Inspection Testing
- 7.2.6. Eddy Current Testing
- 7.2.7. Other Testing Technologies
- 7.3. Market Analysis, Insights and Forecast - by End-user Industry
- 7.3.1. Oil and Gas
- 7.3.2. Power and Energy
- 7.3.3. Construction
- 7.3.4. Automotive and Transportation
- 7.3.5. Aerospace
- 7.3.6. Defense
- 7.3.7. Other End User Industries
- 7.1. Market Analysis, Insights and Forecast - by Type
- 8. Europe NDT Industry Analysis, Insights and Forecast, 2020-2032
- 8.1. Market Analysis, Insights and Forecast - by Type
- 8.1.1. Equipment
- 8.1.2. Services
- 8.2. Market Analysis, Insights and Forecast - by Testing Technology
- 8.2.1. Radiography Testing
- 8.2.2. Ultrasonic Testing
- 8.2.3. Magnetic Particle Testing
- 8.2.4. Liquid Penetrant Testing
- 8.2.5. Visual Inspection Testing
- 8.2.6. Eddy Current Testing
- 8.2.7. Other Testing Technologies
- 8.3. Market Analysis, Insights and Forecast - by End-user Industry
- 8.3.1. Oil and Gas
- 8.3.2. Power and Energy
- 8.3.3. Construction
- 8.3.4. Automotive and Transportation
- 8.3.5. Aerospace
- 8.3.6. Defense
- 8.3.7. Other End User Industries
- 8.1. Market Analysis, Insights and Forecast - by Type
- 9. Asia NDT Industry Analysis, Insights and Forecast, 2020-2032
- 9.1. Market Analysis, Insights and Forecast - by Type
- 9.1.1. Equipment
- 9.1.2. Services
- 9.2. Market Analysis, Insights and Forecast - by Testing Technology
- 9.2.1. Radiography Testing
- 9.2.2. Ultrasonic Testing
- 9.2.3. Magnetic Particle Testing
- 9.2.4. Liquid Penetrant Testing
- 9.2.5. Visual Inspection Testing
- 9.2.6. Eddy Current Testing
- 9.2.7. Other Testing Technologies
- 9.3. Market Analysis, Insights and Forecast - by End-user Industry
- 9.3.1. Oil and Gas
- 9.3.2. Power and Energy
- 9.3.3. Construction
- 9.3.4. Automotive and Transportation
- 9.3.5. Aerospace
- 9.3.6. Defense
- 9.3.7. Other End User Industries
- 9.1. Market Analysis, Insights and Forecast - by Type
- 10. Australia and New Zealand NDT Industry Analysis, Insights and Forecast, 2020-2032
- 10.1. Market Analysis, Insights and Forecast - by Type
- 10.1.1. Equipment
- 10.1.2. Services
- 10.2. Market Analysis, Insights and Forecast - by Testing Technology
- 10.2.1. Radiography Testing
- 10.2.2. Ultrasonic Testing
- 10.2.3. Magnetic Particle Testing
- 10.2.4. Liquid Penetrant Testing
- 10.2.5. Visual Inspection Testing
- 10.2.6. Eddy Current Testing
- 10.2.7. Other Testing Technologies
- 10.3. Market Analysis, Insights and Forecast - by End-user Industry
- 10.3.1. Oil and Gas
- 10.3.2. Power and Energy
- 10.3.3. Construction
- 10.3.4. Automotive and Transportation
- 10.3.5. Aerospace
- 10.3.6. Defense
- 10.3.7. Other End User Industries
- 10.1. Market Analysis, Insights and Forecast - by Type
- 11. Latin America NDT Industry Analysis, Insights and Forecast, 2020-2032
- 11.1. Market Analysis, Insights and Forecast - by Type
- 11.1.1. Equipment
- 11.1.2. Services
- 11.2. Market Analysis, Insights and Forecast - by Testing Technology
- 11.2.1. Radiography Testing
- 11.2.2. Ultrasonic Testing
- 11.2.3. Magnetic Particle Testing
- 11.2.4. Liquid Penetrant Testing
- 11.2.5. Visual Inspection Testing
- 11.2.6. Eddy Current Testing
- 11.2.7. Other Testing Technologies
- 11.3. Market Analysis, Insights and Forecast - by End-user Industry
- 11.3.1. Oil and Gas
- 11.3.2. Power and Energy
- 11.3.3. Construction
- 11.3.4. Automotive and Transportation
- 11.3.5. Aerospace
- 11.3.6. Defense
- 11.3.7. Other End User Industries
- 11.1. Market Analysis, Insights and Forecast - by Type
- 12. Middle East and Africa NDT Industry Analysis, Insights and Forecast, 2020-2032
- 12.1. Market Analysis, Insights and Forecast - by Type
- 12.1.1. Equipment
- 12.1.2. Services
- 12.2. Market Analysis, Insights and Forecast - by Testing Technology
- 12.2.1. Radiography Testing
- 12.2.2. Ultrasonic Testing
- 12.2.3. Magnetic Particle Testing
- 12.2.4. Liquid Penetrant Testing
- 12.2.5. Visual Inspection Testing
- 12.2.6. Eddy Current Testing
- 12.2.7. Other Testing Technologies
- 12.3. Market Analysis, Insights and Forecast - by End-user Industry
- 12.3.1. Oil and Gas
- 12.3.2. Power and Energy
- 12.3.3. Construction
- 12.3.4. Automotive and Transportation
- 12.3.5. Aerospace
- 12.3.6. Defense
- 12.3.7. Other End User Industries
- 12.1. Market Analysis, Insights and Forecast - by Type
- 13. Competitive Analysis
- 13.1. Company Profiles
- 13.1.1 Intertek Group Plc
- 13.1.1.1. Company Overview
- 13.1.1.2. Products
- 13.1.1.3. Company Financials
- 13.1.1.4. SWOT Analysis
- 13.1.2 Team Inc
- 13.1.2.1. Company Overview
- 13.1.2.2. Products
- 13.1.2.3. Company Financials
- 13.1.2.4. SWOT Analysis
- 13.1.3 Magnaflux Corp *List Not Exhaustive
- 13.1.3.1. Company Overview
- 13.1.3.2. Products
- 13.1.3.3. Company Financials
- 13.1.3.4. SWOT Analysis
- 13.1.4 SGS Group
- 13.1.4.1. Company Overview
- 13.1.4.2. Products
- 13.1.4.3. Company Financials
- 13.1.4.4. SWOT Analysis
- 13.1.5 Bureau Veritas S A
- 13.1.5.1. Company Overview
- 13.1.5.2. Products
- 13.1.5.3. Company Financials
- 13.1.5.4. SWOT Analysis
- 13.1.6 Nikon Metrology NV
- 13.1.6.1. Company Overview
- 13.1.6.2. Products
- 13.1.6.3. Company Financials
- 13.1.6.4. SWOT Analysis
- 13.1.7 Fujifilm Corporation
- 13.1.7.1. Company Overview
- 13.1.7.2. Products
- 13.1.7.3. Company Financials
- 13.1.7.4. SWOT Analysis
- 13.1.8 TÜV Rheinland AG
- 13.1.8.1. Company Overview
- 13.1.8.2. Products
- 13.1.8.3. Company Financials
- 13.1.8.4. SWOT Analysis
- 13.1.9 Mistras Group Inc
- 13.1.9.1. Company Overview
- 13.1.9.2. Products
- 13.1.9.3. Company Financials
- 13.1.9.4. SWOT Analysis
- 13.1.10 Yxlon International Gmbh (Comet Holding Ag)
- 13.1.10.1. Company Overview
- 13.1.10.2. Products
- 13.1.10.3. Company Financials
- 13.1.10.4. SWOT Analysis
- 13.1.11 Applus Services
- 13.1.11.1. Company Overview
- 13.1.11.2. Products
- 13.1.11.3. Company Financials
- 13.1.11.4. SWOT Analysis
- 13.1.12 Olympus Corporation
- 13.1.12.1. Company Overview
- 13.1.12.2. Products
- 13.1.12.3. Company Financials
- 13.1.12.4. SWOT Analysis
- 13.1.13 GE Measurement & Control Solutions
- 13.1.13.1. Company Overview
- 13.1.13.2. Products
- 13.1.13.3. Company Financials
- 13.1.13.4. SWOT Analysis
- 13.1.1 Intertek Group Plc
- 13.2. Market Entropy
- 13.2.1 Company's Key Areas Served
- 13.2.2 Recent Developments
- 13.3. Company Market Share Analysis 2025
- 13.3.1 Top 5 Companies Market Share Analysis
- 13.3.2 Top 3 Companies Market Share Analysis
- 13.4. List of Potential Customers
- 14. Research Methodology
List of Figures
- Figure 1: Global NDT Industry Revenue Breakdown (Million, %) by Region 2025 & 2033
- Figure 2: North America NDT Industry Revenue (Million), by Type 2025 & 2033
- Figure 3: North America NDT Industry Revenue Share (%), by Type 2025 & 2033
- Figure 4: North America NDT Industry Revenue (Million), by Testing Technology 2025 & 2033
- Figure 5: North America NDT Industry Revenue Share (%), by Testing Technology 2025 & 2033
- Figure 6: North America NDT Industry Revenue (Million), by End-user Industry 2025 & 2033
- Figure 7: North America NDT Industry Revenue Share (%), by End-user Industry 2025 & 2033
- Figure 8: North America NDT Industry Revenue (Million), by Country 2025 & 2033
- Figure 9: North America NDT Industry Revenue Share (%), by Country 2025 & 2033
- Figure 10: Europe NDT Industry Revenue (Million), by Type 2025 & 2033
- Figure 11: Europe NDT Industry Revenue Share (%), by Type 2025 & 2033
- Figure 12: Europe NDT Industry Revenue (Million), by Testing Technology 2025 & 2033
- Figure 13: Europe NDT Industry Revenue Share (%), by Testing Technology 2025 & 2033
- Figure 14: Europe NDT Industry Revenue (Million), by End-user Industry 2025 & 2033
- Figure 15: Europe NDT Industry Revenue Share (%), by End-user Industry 2025 & 2033
- Figure 16: Europe NDT Industry Revenue (Million), by Country 2025 & 2033
- Figure 17: Europe NDT Industry Revenue Share (%), by Country 2025 & 2033
- Figure 18: Asia NDT Industry Revenue (Million), by Type 2025 & 2033
- Figure 19: Asia NDT Industry Revenue Share (%), by Type 2025 & 2033
- Figure 20: Asia NDT Industry Revenue (Million), by Testing Technology 2025 & 2033
- Figure 21: Asia NDT Industry Revenue Share (%), by Testing Technology 2025 & 2033
- Figure 22: Asia NDT Industry Revenue (Million), by End-user Industry 2025 & 2033
- Figure 23: Asia NDT Industry Revenue Share (%), by End-user Industry 2025 & 2033
- Figure 24: Asia NDT Industry Revenue (Million), by Country 2025 & 2033
- Figure 25: Asia NDT Industry Revenue Share (%), by Country 2025 & 2033
- Figure 26: Australia and New Zealand NDT Industry Revenue (Million), by Type 2025 & 2033
- Figure 27: Australia and New Zealand NDT Industry Revenue Share (%), by Type 2025 & 2033
- Figure 28: Australia and New Zealand NDT Industry Revenue (Million), by Testing Technology 2025 & 2033
- Figure 29: Australia and New Zealand NDT Industry Revenue Share (%), by Testing Technology 2025 & 2033
- Figure 30: Australia and New Zealand NDT Industry Revenue (Million), by End-user Industry 2025 & 2033
- Figure 31: Australia and New Zealand NDT Industry Revenue Share (%), by End-user Industry 2025 & 2033
- Figure 32: Australia and New Zealand NDT Industry Revenue (Million), by Country 2025 & 2033
- Figure 33: Australia and New Zealand NDT Industry Revenue Share (%), by Country 2025 & 2033
- Figure 34: Latin America NDT Industry Revenue (Million), by Type 2025 & 2033
- Figure 35: Latin America NDT Industry Revenue Share (%), by Type 2025 & 2033
- Figure 36: Latin America NDT Industry Revenue (Million), by Testing Technology 2025 & 2033
- Figure 37: Latin America NDT Industry Revenue Share (%), by Testing Technology 2025 & 2033
- Figure 38: Latin America NDT Industry Revenue (Million), by End-user Industry 2025 & 2033
- Figure 39: Latin America NDT Industry Revenue Share (%), by End-user Industry 2025 & 2033
- Figure 40: Latin America NDT Industry Revenue (Million), by Country 2025 & 2033
- Figure 41: Latin America NDT Industry Revenue Share (%), by Country 2025 & 2033
- Figure 42: Middle East and Africa NDT Industry Revenue (Million), by Type 2025 & 2033
- Figure 43: Middle East and Africa NDT Industry Revenue Share (%), by Type 2025 & 2033
- Figure 44: Middle East and Africa NDT Industry Revenue (Million), by Testing Technology 2025 & 2033
- Figure 45: Middle East and Africa NDT Industry Revenue Share (%), by Testing Technology 2025 & 2033
- Figure 46: Middle East and Africa NDT Industry Revenue (Million), by End-user Industry 2025 & 2033
- Figure 47: Middle East and Africa NDT Industry Revenue Share (%), by End-user Industry 2025 & 2033
- Figure 48: Middle East and Africa NDT Industry Revenue (Million), by Country 2025 & 2033
- Figure 49: Middle East and Africa NDT Industry Revenue Share (%), by Country 2025 & 2033
List of Tables
- Table 1: Global NDT Industry Revenue Million Forecast, by Type 2020 & 2033
- Table 2: Global NDT Industry Revenue Million Forecast, by Testing Technology 2020 & 2033
- Table 3: Global NDT Industry Revenue Million Forecast, by End-user Industry 2020 & 2033
- Table 4: Global NDT Industry Revenue Million Forecast, by Region 2020 & 2033
- Table 5: Global NDT Industry Revenue Million Forecast, by Type 2020 & 2033
- Table 6: Global NDT Industry Revenue Million Forecast, by Testing Technology 2020 & 2033
- Table 7: Global NDT Industry Revenue Million Forecast, by End-user Industry 2020 & 2033
- Table 8: Global NDT Industry Revenue Million Forecast, by Country 2020 & 2033
- Table 9: United States NDT Industry Revenue (Million) Forecast, by Application 2020 & 2033
- Table 10: Canada NDT Industry Revenue (Million) Forecast, by Application 2020 & 2033
- Table 11: Global NDT Industry Revenue Million Forecast, by Type 2020 & 2033
- Table 12: Global NDT Industry Revenue Million Forecast, by Testing Technology 2020 & 2033
- Table 13: Global NDT Industry Revenue Million Forecast, by End-user Industry 2020 & 2033
- Table 14: Global NDT Industry Revenue Million Forecast, by Country 2020 & 2033
- Table 15: Germany NDT Industry Revenue (Million) Forecast, by Application 2020 & 2033
- Table 16: United Kingdom NDT Industry Revenue (Million) Forecast, by Application 2020 & 2033
- Table 17: France NDT Industry Revenue (Million) Forecast, by Application 2020 & 2033
- Table 18: Global NDT Industry Revenue Million Forecast, by Type 2020 & 2033
- Table 19: Global NDT Industry Revenue Million Forecast, by Testing Technology 2020 & 2033
- Table 20: Global NDT Industry Revenue Million Forecast, by End-user Industry 2020 & 2033
- Table 21: Global NDT Industry Revenue Million Forecast, by Country 2020 & 2033
- Table 22: China NDT Industry Revenue (Million) Forecast, by Application 2020 & 2033
- Table 23: Japan NDT Industry Revenue (Million) Forecast, by Application 2020 & 2033
- Table 24: India NDT Industry Revenue (Million) Forecast, by Application 2020 & 2033
- Table 25: Global NDT Industry Revenue Million Forecast, by Type 2020 & 2033
- Table 26: Global NDT Industry Revenue Million Forecast, by Testing Technology 2020 & 2033
- Table 27: Global NDT Industry Revenue Million Forecast, by End-user Industry 2020 & 2033
- Table 28: Global NDT Industry Revenue Million Forecast, by Country 2020 & 2033
- Table 29: Global NDT Industry Revenue Million Forecast, by Type 2020 & 2033
- Table 30: Global NDT Industry Revenue Million Forecast, by Testing Technology 2020 & 2033
- Table 31: Global NDT Industry Revenue Million Forecast, by End-user Industry 2020 & 2033
- Table 32: Global NDT Industry Revenue Million Forecast, by Country 2020 & 2033
- Table 33: Brazil NDT Industry Revenue (Million) Forecast, by Application 2020 & 2033
- Table 34: Argentina NDT Industry Revenue (Million) Forecast, by Application 2020 & 2033
- Table 35: Mexico NDT Industry Revenue (Million) Forecast, by Application 2020 & 2033
- Table 36: Global NDT Industry Revenue Million Forecast, by Type 2020 & 2033
- Table 37: Global NDT Industry Revenue Million Forecast, by Testing Technology 2020 & 2033
- Table 38: Global NDT Industry Revenue Million Forecast, by End-user Industry 2020 & 2033
- Table 39: Global NDT Industry Revenue Million Forecast, by Country 2020 & 2033
- Table 40: United Arab Emirates NDT Industry Revenue (Million) Forecast, by Application 2020 & 2033
- Table 41: Saudi Arabia NDT Industry Revenue (Million) Forecast, by Application 2020 & 2033
- Table 42: South Africa NDT Industry Revenue (Million) Forecast, by Application 2020 & 2033
Frequently Asked Questions
1. What is the projected Compound Annual Growth Rate (CAGR) of the NDT Industry?
The projected CAGR is approximately 7.35%.
2. Which companies are prominent players in the NDT Industry?
Key companies in the market include Intertek Group Plc, Team Inc, Magnaflux Corp *List Not Exhaustive, SGS Group, Bureau Veritas S A, Nikon Metrology NV, Fujifilm Corporation, TÜV Rheinland AG, Mistras Group Inc, Yxlon International Gmbh (Comet Holding Ag), Applus Services, Olympus Corporation, GE Measurement & Control Solutions.
3. What are the main segments of the NDT Industry?
The market segments include Type, Testing Technology, End-user Industry.
4. Can you provide details about the market size?
The market size is estimated to be USD 2.53 Million as of 2022.
5. What are some drivers contributing to market growth?
; Stringent Regulations Mandating Safety Standards; Increase in Demand for Flaw Detection to Reduce Repair Cost.
6. What are the notable trends driving market growth?
Power and Energy Sector Offers Potential Growth.
7. Are there any restraints impacting market growth?
; Lack of Skilled Workforce and Training Regulations.
8. Can you provide examples of recent developments in the market?
N/A
9. What pricing options are available for accessing the report?
Pricing options include single-user, multi-user, and enterprise licenses priced at USD 4750, USD 5250, and USD 8750 respectively.
10. Is the market size provided in terms of value or volume?
The market size is provided in terms of value, measured in Million.
11. Are there any specific market keywords associated with the report?
Yes, the market keyword associated with the report is "NDT Industry," which aids in identifying and referencing the specific market segment covered.
12. How do I determine which pricing option suits my needs best?
The pricing options vary based on user requirements and access needs. Individual users may opt for single-user licenses, while businesses requiring broader access may choose multi-user or enterprise licenses for cost-effective access to the report.
13. Are there any additional resources or data provided in the NDT Industry report?
While the report offers comprehensive insights, it's advisable to review the specific contents or supplementary materials provided to ascertain if additional resources or data are available.
14. How can I stay updated on further developments or reports in the NDT Industry?
To stay informed about further developments, trends, and reports in the NDT Industry, consider subscribing to industry newsletters, following relevant companies and organizations, or regularly checking reputable industry news sources and publications.
Methodology
Step 1 - Identification of Relevant Samples Size from Population Database


Step 2 - Approaches for Defining Global Market Size (Value, Volume* & Price*)

Note*: In applicable scenarios
Step 3 - Data Sources
Primary Research
- Web Analytics
- Survey Reports
- Research Institute
- Latest Research Reports
- Opinion Leaders
Secondary Research
- Annual Reports
- White Paper
- Latest Press Release
- Industry Association
- Paid Database
- Investor Presentations

Step 4 - Data Triangulation
Involves using different sources of information in order to increase the validity of a study
These sources are likely to be stakeholders in a program - participants, other researchers, program staff, other community members, and so on.
Then we put all data in single framework & apply various statistical tools to find out the dynamic on the market.
During the analysis stage, feedback from the stakeholder groups would be compared to determine areas of agreement as well as areas of divergence