

Key Insights
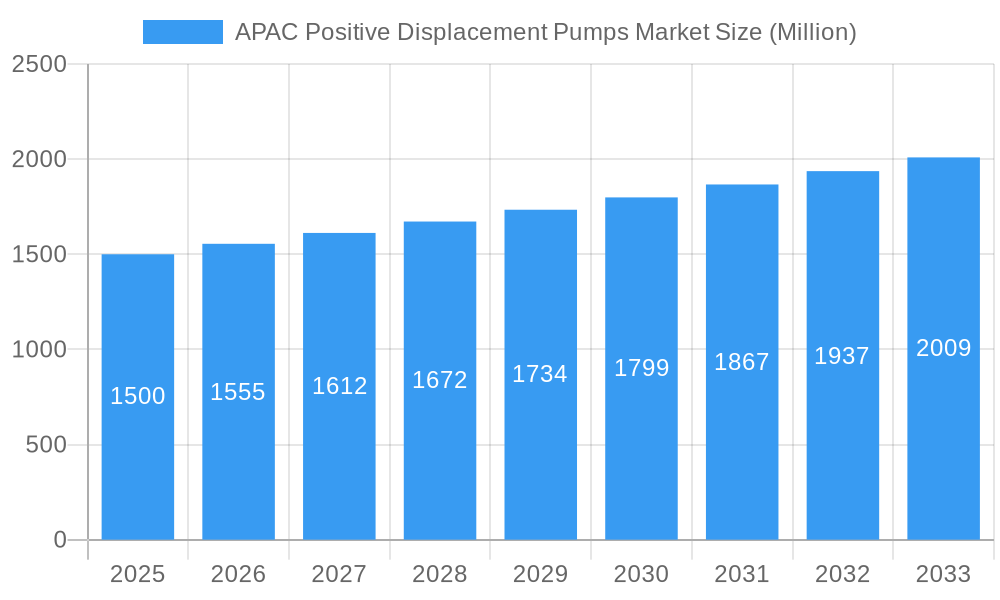
The Asia Pacific (APAC) Positive Displacement (PD) Pumps market is poised for significant expansion, driven by rapid industrialization and substantial investments across diverse end-user sectors. With an estimated market size of USD 20,721.9 million in the base year 2025, the region is projected to achieve a Compound Annual Growth Rate (CAGR) of 5.4% from 2025 to 2033. This growth is underpinned by the robust performance of the Oil & Gas industry, which relies on efficient PD pumps for exploration, extraction, and refining. The Chemicals sector also presents considerable demand for specialized pumps adept at handling corrosive and viscous materials. Furthermore, the Food & Beverage and Pharmaceutical industries are increasingly adopting advanced PD pump technologies to meet stringent hygiene, precision, and fluid transfer requirements. The Waste & Wastewater treatment sector is another key contributor, with infrastructure development and environmental mandates accelerating the adoption of these pumps for effective sludge and wastewater management.
APAC Positive Displacement Pumps Market Market Size (In Billion)
Technological advancements are a critical catalyst in the APAC PD Pumps market. The development of energy-efficient and low-maintenance pump designs, particularly in diaphragm, piston, and progressive cavity pump types, is driving widespread adoption. The integration of smart and IoT-enabled PD pumps, offering predictive maintenance and remote monitoring, is also gaining momentum, proving invaluable for critical and remote applications. While the market demonstrates strong growth potential, challenges such as fluctuating raw material costs and the initial investment for advanced PD pump systems may present hurdles. Nevertheless, these are often outweighed by the long-term operational efficiencies and the escalating demand for high-performance pumping solutions across the dynamic industrial landscape of the APAC region. Leading market players, including The Weir Group PLC, Xylem Inc, KSB SE & Co KGaA, and Sulzer AG, are actively investing in research and development and expanding their operational footprint to address the burgeoning demand.
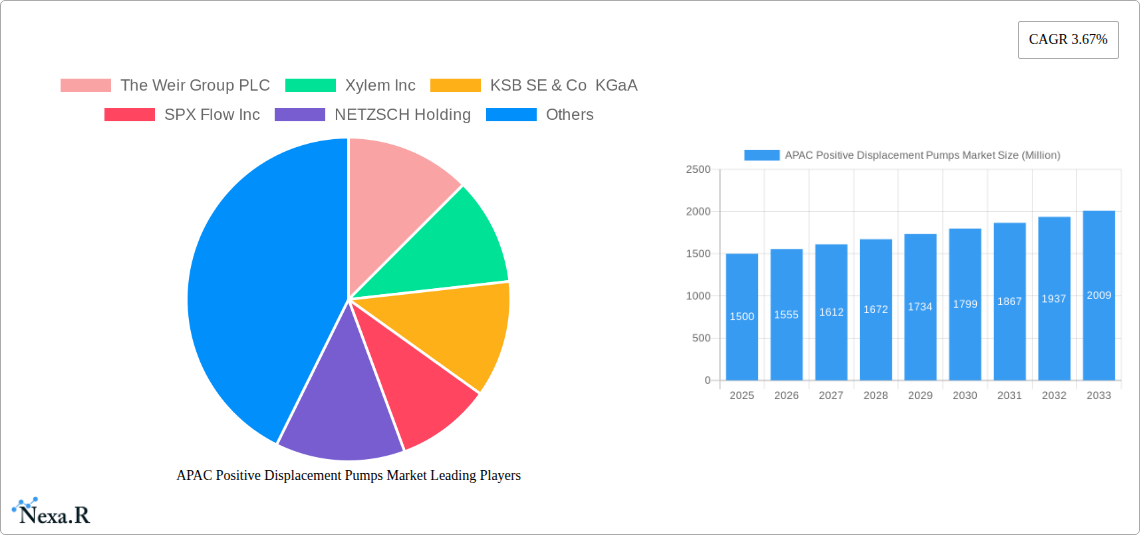
APAC Positive Displacement Pumps Market Company Market Share
This comprehensive market research report provides an in-depth analysis of the Asia Pacific Positive Displacement Pumps Market, offering critical insights into market dynamics, growth trajectories, and future potential. Covering the period from 2019 to 2033, with the base year set at 2025, this study meticulously examines market drivers, segmentation, competitive landscapes, and emerging opportunities. Gain a strategic advantage with data-driven insights into Diaphragm Pumps, Piston Pumps, Gear Pumps, Lobe Pumps, Progressive Cavity Pumps, Screw Pumps, Vane Pumps, and Peristaltic Pumps. Understand the crucial role of these pumps across vital end-user industries such as Oil & Gas, Chemicals, Food & Beverage, Waste & Wastewater, Pharmaceutical, and Power. Optimize your market strategy with detailed information on the Positive Displacement Pumps Market and its APAC Segment.
This report delivers:
- Market Size and Forecast: An estimated market size of USD 20,721.9 million in 2025, with a projected CAGR of 5.4% from 2025-2033.
- Segment Analysis: A detailed breakdown of market share by pump type and end-user industry.
- Geographical Focus: Comprehensive analysis of the Asia Pacific (APAC) region, identifying key growth opportunities and country-specific trends.
- Competitive Intelligence: Strategic insights into the market positioning and approaches of leading industry players.
- Industry Developments: An analysis of recent innovations and their market impact.
APAC Positive Displacement Pumps Market Market Dynamics & Structure
The APAC Positive Displacement Pumps Market is characterized by a moderately concentrated structure, with key players like The Weir Group PLC, Xylem Inc, KSB SE & Co KGaA, SPX Flow Inc, and NETZSCH Holding dominating significant market shares. Technological innovation is a primary driver, fueled by the increasing demand for energy-efficient, reliable, and precise fluid handling solutions across various industries. Stringent environmental regulations and a growing emphasis on industrial safety further propel the adoption of advanced positive displacement pump technologies. Competitive product substitutes, such as centrifugal pumps, present ongoing challenges, particularly in applications where precise dosing or high viscosity handling is not paramount. End-user demographics are shifting towards sophisticated industrial processes requiring specialized pump functionalities. Mergers and acquisitions (M&A) are increasingly prevalent as companies seek to expand their product portfolios, geographical reach, and technological capabilities.
- Market Concentration: Moderately concentrated, with top 5 players holding an estimated [Insert Estimated Market Share Percentage]% of the market in 2025.
- Technological Innovation: Driven by demand for efficiency, precision, and sustainability.
- Regulatory Frameworks: Increasing stringency in environmental and safety standards.
- Competitive Substitutes: Centrifugal pumps pose a challenge in certain applications.
- End-User Demographics: Shift towards advanced industrial applications.
- M&A Trends: Active consolidation for market expansion and portfolio enhancement.
APAC Positive Displacement Pumps Market Growth Trends & Insights
The APAC Positive Displacement Pumps Market is poised for robust growth, driven by rapid industrialization and burgeoning economies across the region. The Parent Market, the global Positive Displacement Pumps Market, is experiencing sustained expansion, with the APAC region emerging as a critical growth engine. The Child Market, specifically focusing on APAC, reflects this trend with increasing adoption rates of various positive displacement pump types. Technological disruptions, such as the development of smart pumps with advanced monitoring and control capabilities, are transforming operational efficiencies and predictive maintenance. Consumer behavior shifts, particularly in the Food & Beverage and Pharmaceutical sectors, are demanding higher levels of hygiene, precision, and traceability, which positive displacement pumps are well-equipped to provide. The market size evolution is characterized by a steady upward trajectory, influenced by infrastructure development and the expansion of key industries like Oil & Gas and Chemicals.
- Market Size Evolution: Significant growth anticipated, with the APAC market contributing substantially to the global positive displacement pumps market.
- Adoption Rates: Increasing across diverse industrial sectors due to specialized capabilities.
- Technological Disruptions: Smart pumps, IoT integration, and advanced materials enhancing performance.
- Consumer Behavior Shifts: Demand for precision, hygiene, and sustainability influencing pump selection.
- Market Penetration: Deeper penetration expected in developing economies within APAC.
Dominant Regions, Countries, or Segments in APAC Positive Displacement Pumps Market
China stands out as the dominant country within the APAC Positive Displacement Pumps Market, driven by its massive industrial base, extensive manufacturing capabilities, and significant investments in infrastructure development across sectors like Oil & Gas, Chemicals, and Waste & Wastewater management. The Oil & Gas industry, in particular, is a major consumer of positive displacement pumps for extraction, refining, and transportation processes, making it a key segment influencing market dominance. The Chemical industry also plays a crucial role, relying on these pumps for precise handling of corrosive, viscous, and hazardous fluids. Economic policies promoting industrial growth and environmental protection further bolster the demand for advanced pump solutions in China. Countries like India and Southeast Asian nations are emerging as significant growth pockets, supported by their expanding industrial sectors and increasing focus on water and wastewater treatment.
- Dominant Country: China, leading due to its vast industrial landscape and infrastructure projects.
- Key End-User Industry: Oil & Gas and Chemicals are major contributors to market demand.
- Growth Drivers: Industrialization, infrastructure development, and stringent environmental regulations.
- Emerging Markets: India and Southeast Asian nations showing strong growth potential.
- Segment Dominance Factors: Economic policies, urbanization, and the need for specialized fluid handling.
APAC Positive Displacement Pumps Market Product Landscape
The APAC Positive Displacement Pumps Market product landscape is characterized by continuous innovation and a broad spectrum of pump types catering to diverse applications. From robust Progressive Cavity Pumps and efficient Screw Pumps for high-viscosity fluids in the Oil & Gas and Chemical sectors, to hygienic Diaphragm Pumps and Peristaltic Pumps indispensable in Food & Beverage and Pharmaceutical industries, the market offers specialized solutions. Gear Pumps and Lobe Pumps are widely adopted for their versatility in various industrial processes. Performance metrics such as flow rate, pressure capabilities, energy efficiency, and material compatibility are key differentiators. Recent advancements include the development of pumps with enhanced sealing technologies, intelligent monitoring systems, and materials resistant to extreme temperatures and corrosive media, offering unique selling propositions to manufacturers.
Key Drivers, Barriers & Challenges in APAC Positive Displacement Pumps Market
Key Drivers: The primary forces propelling the APAC Positive Displacement Pumps Market include rapid industrialization, increasing investments in infrastructure development, and the growing demand for efficient and reliable fluid handling solutions across key sectors like Oil & Gas, Chemicals, and Waste & Wastewater. Technological advancements leading to energy-efficient and environmentally friendly pumps also act as significant drivers.
Barriers & Challenges: Supply chain disruptions, geopolitical uncertainties, and fluctuations in raw material prices pose significant challenges. Stringent regulatory frameworks regarding emissions and safety standards, while a driver for innovation, can also increase manufacturing costs. Intense competition from both domestic and international players, coupled with the availability of cost-effective substitutes in certain applications, presents ongoing competitive pressures.
Emerging Opportunities in the APAC Positive Displacement Pumps Market
Emerging opportunities within the APAC Positive Displacement Pumps Market lie in the rapidly growing sectors of renewable energy, particularly for fluid handling in solar and wind power generation, and the expanding water and wastewater treatment infrastructure across developing economies. The increasing focus on sustainable manufacturing practices and the circular economy presents opportunities for pumps designed for recycling and waste processing applications. Furthermore, the burgeoning pharmaceutical and biotechnology industries in countries like India and South Korea are creating a demand for highly precise and sterile pumping solutions, especially for critical drug manufacturing processes. The adoption of smart pump technologies with IoT capabilities for predictive maintenance and remote monitoring also represents a significant growth avenue.
Growth Accelerators in the APAC Positive Displacement Pumps Market Industry
Catalysts driving long-term growth in the APAC Positive Displacement Pumps Market include sustained economic development across the region, leading to increased capital expenditure in industrial sectors. Technological breakthroughs in areas such as advanced materials, miniaturization, and smart pump integration are creating new application possibilities and enhancing pump performance. Strategic partnerships and collaborations between pump manufacturers and end-users to develop customized solutions are also accelerating market penetration. Moreover, government initiatives promoting industrial automation, environmental sustainability, and stringent quality control standards are creating a favorable ecosystem for the adoption of high-performance positive displacement pumps.
Key Players Shaping the APAC Positive Displacement Pumps Market Market
- The Weir Group PLC
- Xylem Inc
- KSB SE & Co KGaA
- SPX Flow Inc
- NETZSCH Holding
- TSURUMI MANUFACTURING CO LTD
- Sulzer AG
- Pentair PLC
- Atlas Copco
- GRUNDFOS
Notable Milestones in APAC Positive Displacement Pumps Market Sector
- February 2022: NETZSCH Pumps and Systems announced the expansion of its product portfolio with the launch of the PERIPRO peristaltic pump. The pump model is available in chemical, industrial, and food versions. Moreover, the newly launched product complements the company's well-known technologies of NEMO progressing cavity pumps, NOTOS multi screw pumps, and TORNADO rotary lobe pumps.
In-Depth APAC Positive Displacement Pumps Market Market Outlook
The APAC Positive Displacement Pumps Market is set for a promising future, driven by ongoing industrial expansion and increasing adoption of advanced fluid handling technologies. Growth accelerators such as sustainable manufacturing trends, smart pump integration for enhanced operational efficiency, and the burgeoning demand in the pharmaceutical and wastewater treatment sectors will continue to fuel market expansion. Strategic market expansion by key players into developing economies within APAC, coupled with continuous innovation in product development to meet evolving industry needs, will solidify the region's position as a global powerhouse for positive displacement pumps. The market's trajectory indicates sustained growth, offering significant opportunities for stakeholders to capitalize on the region's dynamic industrial landscape.
APAC Positive Displacement Pumps Market Segmentation
-
1. Type
- 1.1. Diaphragm
- 1.2. Piston
- 1.3. Gear
- 1.4. Lobe
- 1.5. Progressive Cavity
- 1.6. Screw
- 1.7. Vane
- 1.8. Peristaltic
-
2. End-user Industry
- 2.1. Oil & Gas
- 2.2. Chemicals
- 2.3. Food & Beverage
- 2.4. Waste & Wastewater
- 2.5. Pharmaceutical
- 2.6. Power
- 2.7. Other End-user Industries
APAC Positive Displacement Pumps Market Segmentation By Geography
-
1. North America
- 1.1. United States
- 1.2. Canada
- 1.3. Mexico
-
2. South America
- 2.1. Brazil
- 2.2. Argentina
- 2.3. Rest of South America
-
3. Europe
- 3.1. United Kingdom
- 3.2. Germany
- 3.3. France
- 3.4. Italy
- 3.5. Spain
- 3.6. Russia
- 3.7. Benelux
- 3.8. Nordics
- 3.9. Rest of Europe
-
4. Middle East & Africa
- 4.1. Turkey
- 4.2. Israel
- 4.3. GCC
- 4.4. North Africa
- 4.5. South Africa
- 4.6. Rest of Middle East & Africa
-
5. Asia Pacific
- 5.1. China
- 5.2. India
- 5.3. Japan
- 5.4. South Korea
- 5.5. ASEAN
- 5.6. Oceania
- 5.7. Rest of Asia Pacific
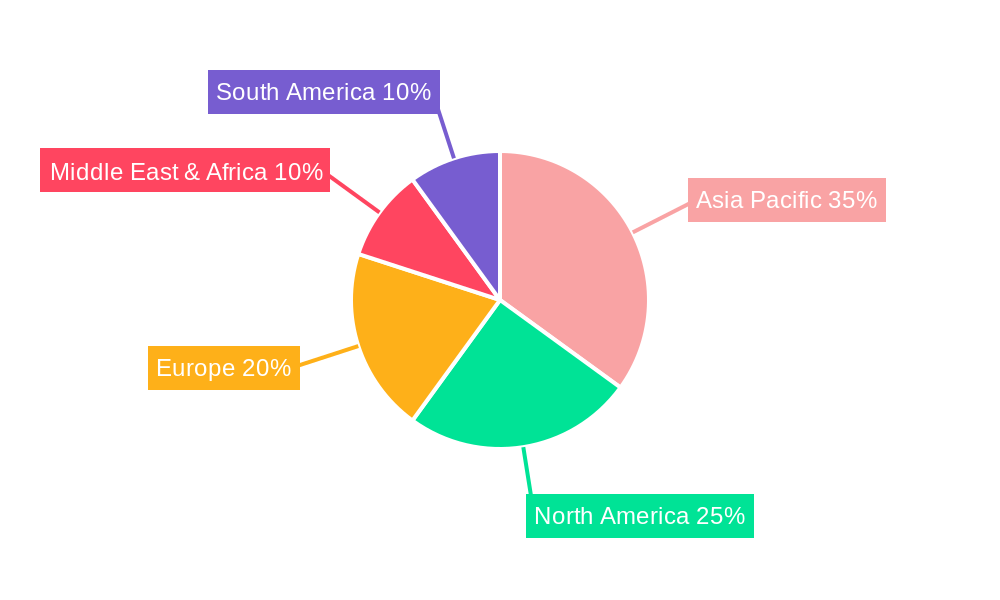
APAC Positive Displacement Pumps Market Regional Market Share
Geographic Coverage of APAC Positive Displacement Pumps Market
APAC Positive Displacement Pumps Market REPORT HIGHLIGHTS
| Aspects | Details |
|---|---|
| Study Period | 2020-2034 |
| Base Year | 2025 |
| Estimated Year | 2026 |
| Forecast Period | 2026-2034 |
| Historical Period | 2020-2025 |
| Growth Rate | CAGR of 5.4% from 2020-2034 |
| Segmentation |
|
Table of Contents
- 1. Introduction
- 1.1. Research Scope
- 1.2. Market Segmentation
- 1.3. Research Methodology
- 1.4. Definitions and Assumptions
- 2. Executive Summary
- 2.1. Introduction
- 3. Market Dynamics
- 3.1. Introduction
- 3.2. Market Drivers
- 3.2.1. Increased Focus on Wastewater Management
- 3.3. Market Restrains
- 3.3.1. Environmental and Safe Use Concerns
- 3.4. Market Trends
- 3.4.1. Waste and Wastewater Industry is Expected to Register Significant Growth
- 4. Market Factor Analysis
- 4.1. Porters Five Forces
- 4.2. Supply/Value Chain
- 4.3. PESTEL analysis
- 4.4. Market Entropy
- 4.5. Patent/Trademark Analysis
- 5. Global APAC Positive Displacement Pumps Market Analysis, Insights and Forecast, 2020-2032
- 5.1. Market Analysis, Insights and Forecast - by Type
- 5.1.1. Diaphragm
- 5.1.2. Piston
- 5.1.3. Gear
- 5.1.4. Lobe
- 5.1.5. Progressive Cavity
- 5.1.6. Screw
- 5.1.7. Vane
- 5.1.8. Peristaltic
- 5.2. Market Analysis, Insights and Forecast - by End-user Industry
- 5.2.1. Oil & Gas
- 5.2.2. Chemicals
- 5.2.3. Food & Beverage
- 5.2.4. Waste & Wastewater
- 5.2.5. Pharmaceutical
- 5.2.6. Power
- 5.2.7. Other End-user Industries
- 5.3. Market Analysis, Insights and Forecast - by Region
- 5.3.1. North America
- 5.3.2. South America
- 5.3.3. Europe
- 5.3.4. Middle East & Africa
- 5.3.5. Asia Pacific
- 5.1. Market Analysis, Insights and Forecast - by Type
- 6. North America APAC Positive Displacement Pumps Market Analysis, Insights and Forecast, 2020-2032
- 6.1. Market Analysis, Insights and Forecast - by Type
- 6.1.1. Diaphragm
- 6.1.2. Piston
- 6.1.3. Gear
- 6.1.4. Lobe
- 6.1.5. Progressive Cavity
- 6.1.6. Screw
- 6.1.7. Vane
- 6.1.8. Peristaltic
- 6.2. Market Analysis, Insights and Forecast - by End-user Industry
- 6.2.1. Oil & Gas
- 6.2.2. Chemicals
- 6.2.3. Food & Beverage
- 6.2.4. Waste & Wastewater
- 6.2.5. Pharmaceutical
- 6.2.6. Power
- 6.2.7. Other End-user Industries
- 6.1. Market Analysis, Insights and Forecast - by Type
- 7. South America APAC Positive Displacement Pumps Market Analysis, Insights and Forecast, 2020-2032
- 7.1. Market Analysis, Insights and Forecast - by Type
- 7.1.1. Diaphragm
- 7.1.2. Piston
- 7.1.3. Gear
- 7.1.4. Lobe
- 7.1.5. Progressive Cavity
- 7.1.6. Screw
- 7.1.7. Vane
- 7.1.8. Peristaltic
- 7.2. Market Analysis, Insights and Forecast - by End-user Industry
- 7.2.1. Oil & Gas
- 7.2.2. Chemicals
- 7.2.3. Food & Beverage
- 7.2.4. Waste & Wastewater
- 7.2.5. Pharmaceutical
- 7.2.6. Power
- 7.2.7. Other End-user Industries
- 7.1. Market Analysis, Insights and Forecast - by Type
- 8. Europe APAC Positive Displacement Pumps Market Analysis, Insights and Forecast, 2020-2032
- 8.1. Market Analysis, Insights and Forecast - by Type
- 8.1.1. Diaphragm
- 8.1.2. Piston
- 8.1.3. Gear
- 8.1.4. Lobe
- 8.1.5. Progressive Cavity
- 8.1.6. Screw
- 8.1.7. Vane
- 8.1.8. Peristaltic
- 8.2. Market Analysis, Insights and Forecast - by End-user Industry
- 8.2.1. Oil & Gas
- 8.2.2. Chemicals
- 8.2.3. Food & Beverage
- 8.2.4. Waste & Wastewater
- 8.2.5. Pharmaceutical
- 8.2.6. Power
- 8.2.7. Other End-user Industries
- 8.1. Market Analysis, Insights and Forecast - by Type
- 9. Middle East & Africa APAC Positive Displacement Pumps Market Analysis, Insights and Forecast, 2020-2032
- 9.1. Market Analysis, Insights and Forecast - by Type
- 9.1.1. Diaphragm
- 9.1.2. Piston
- 9.1.3. Gear
- 9.1.4. Lobe
- 9.1.5. Progressive Cavity
- 9.1.6. Screw
- 9.1.7. Vane
- 9.1.8. Peristaltic
- 9.2. Market Analysis, Insights and Forecast - by End-user Industry
- 9.2.1. Oil & Gas
- 9.2.2. Chemicals
- 9.2.3. Food & Beverage
- 9.2.4. Waste & Wastewater
- 9.2.5. Pharmaceutical
- 9.2.6. Power
- 9.2.7. Other End-user Industries
- 9.1. Market Analysis, Insights and Forecast - by Type
- 10. Asia Pacific APAC Positive Displacement Pumps Market Analysis, Insights and Forecast, 2020-2032
- 10.1. Market Analysis, Insights and Forecast - by Type
- 10.1.1. Diaphragm
- 10.1.2. Piston
- 10.1.3. Gear
- 10.1.4. Lobe
- 10.1.5. Progressive Cavity
- 10.1.6. Screw
- 10.1.7. Vane
- 10.1.8. Peristaltic
- 10.2. Market Analysis, Insights and Forecast - by End-user Industry
- 10.2.1. Oil & Gas
- 10.2.2. Chemicals
- 10.2.3. Food & Beverage
- 10.2.4. Waste & Wastewater
- 10.2.5. Pharmaceutical
- 10.2.6. Power
- 10.2.7. Other End-user Industries
- 10.1. Market Analysis, Insights and Forecast - by Type
- 11. Competitive Analysis
- 11.1. Global Market Share Analysis 2025
- 11.2. Company Profiles
- 11.2.1 The Weir Group PLC
- 11.2.1.1. Overview
- 11.2.1.2. Products
- 11.2.1.3. SWOT Analysis
- 11.2.1.4. Recent Developments
- 11.2.1.5. Financials (Based on Availability)
- 11.2.2 Xylem Inc
- 11.2.2.1. Overview
- 11.2.2.2. Products
- 11.2.2.3. SWOT Analysis
- 11.2.2.4. Recent Developments
- 11.2.2.5. Financials (Based on Availability)
- 11.2.3 KSB SE & Co KGaA
- 11.2.3.1. Overview
- 11.2.3.2. Products
- 11.2.3.3. SWOT Analysis
- 11.2.3.4. Recent Developments
- 11.2.3.5. Financials (Based on Availability)
- 11.2.4 SPX Flow Inc
- 11.2.4.1. Overview
- 11.2.4.2. Products
- 11.2.4.3. SWOT Analysis
- 11.2.4.4. Recent Developments
- 11.2.4.5. Financials (Based on Availability)
- 11.2.5 NETZSCH Holding
- 11.2.5.1. Overview
- 11.2.5.2. Products
- 11.2.5.3. SWOT Analysis
- 11.2.5.4. Recent Developments
- 11.2.5.5. Financials (Based on Availability)
- 11.2.6 TSURUMI MANUFACTURING CO LTD
- 11.2.6.1. Overview
- 11.2.6.2. Products
- 11.2.6.3. SWOT Analysis
- 11.2.6.4. Recent Developments
- 11.2.6.5. Financials (Based on Availability)
- 11.2.7 Sulzer AG
- 11.2.7.1. Overview
- 11.2.7.2. Products
- 11.2.7.3. SWOT Analysis
- 11.2.7.4. Recent Developments
- 11.2.7.5. Financials (Based on Availability)
- 11.2.8 Pentair PLC
- 11.2.8.1. Overview
- 11.2.8.2. Products
- 11.2.8.3. SWOT Analysis
- 11.2.8.4. Recent Developments
- 11.2.8.5. Financials (Based on Availability)
- 11.2.9 Atlas Copco
- 11.2.9.1. Overview
- 11.2.9.2. Products
- 11.2.9.3. SWOT Analysis
- 11.2.9.4. Recent Developments
- 11.2.9.5. Financials (Based on Availability)
- 11.2.10 GRUNDFOS
- 11.2.10.1. Overview
- 11.2.10.2. Products
- 11.2.10.3. SWOT Analysis
- 11.2.10.4. Recent Developments
- 11.2.10.5. Financials (Based on Availability)
- 11.2.1 The Weir Group PLC
List of Figures
- Figure 1: Global APAC Positive Displacement Pumps Market Revenue Breakdown (million, %) by Region 2025 & 2033
- Figure 2: Global APAC Positive Displacement Pumps Market Volume Breakdown (K Unit, %) by Region 2025 & 2033
- Figure 3: North America APAC Positive Displacement Pumps Market Revenue (million), by Type 2025 & 2033
- Figure 4: North America APAC Positive Displacement Pumps Market Volume (K Unit), by Type 2025 & 2033
- Figure 5: North America APAC Positive Displacement Pumps Market Revenue Share (%), by Type 2025 & 2033
- Figure 6: North America APAC Positive Displacement Pumps Market Volume Share (%), by Type 2025 & 2033
- Figure 7: North America APAC Positive Displacement Pumps Market Revenue (million), by End-user Industry 2025 & 2033
- Figure 8: North America APAC Positive Displacement Pumps Market Volume (K Unit), by End-user Industry 2025 & 2033
- Figure 9: North America APAC Positive Displacement Pumps Market Revenue Share (%), by End-user Industry 2025 & 2033
- Figure 10: North America APAC Positive Displacement Pumps Market Volume Share (%), by End-user Industry 2025 & 2033
- Figure 11: North America APAC Positive Displacement Pumps Market Revenue (million), by Country 2025 & 2033
- Figure 12: North America APAC Positive Displacement Pumps Market Volume (K Unit), by Country 2025 & 2033
- Figure 13: North America APAC Positive Displacement Pumps Market Revenue Share (%), by Country 2025 & 2033
- Figure 14: North America APAC Positive Displacement Pumps Market Volume Share (%), by Country 2025 & 2033
- Figure 15: South America APAC Positive Displacement Pumps Market Revenue (million), by Type 2025 & 2033
- Figure 16: South America APAC Positive Displacement Pumps Market Volume (K Unit), by Type 2025 & 2033
- Figure 17: South America APAC Positive Displacement Pumps Market Revenue Share (%), by Type 2025 & 2033
- Figure 18: South America APAC Positive Displacement Pumps Market Volume Share (%), by Type 2025 & 2033
- Figure 19: South America APAC Positive Displacement Pumps Market Revenue (million), by End-user Industry 2025 & 2033
- Figure 20: South America APAC Positive Displacement Pumps Market Volume (K Unit), by End-user Industry 2025 & 2033
- Figure 21: South America APAC Positive Displacement Pumps Market Revenue Share (%), by End-user Industry 2025 & 2033
- Figure 22: South America APAC Positive Displacement Pumps Market Volume Share (%), by End-user Industry 2025 & 2033
- Figure 23: South America APAC Positive Displacement Pumps Market Revenue (million), by Country 2025 & 2033
- Figure 24: South America APAC Positive Displacement Pumps Market Volume (K Unit), by Country 2025 & 2033
- Figure 25: South America APAC Positive Displacement Pumps Market Revenue Share (%), by Country 2025 & 2033
- Figure 26: South America APAC Positive Displacement Pumps Market Volume Share (%), by Country 2025 & 2033
- Figure 27: Europe APAC Positive Displacement Pumps Market Revenue (million), by Type 2025 & 2033
- Figure 28: Europe APAC Positive Displacement Pumps Market Volume (K Unit), by Type 2025 & 2033
- Figure 29: Europe APAC Positive Displacement Pumps Market Revenue Share (%), by Type 2025 & 2033
- Figure 30: Europe APAC Positive Displacement Pumps Market Volume Share (%), by Type 2025 & 2033
- Figure 31: Europe APAC Positive Displacement Pumps Market Revenue (million), by End-user Industry 2025 & 2033
- Figure 32: Europe APAC Positive Displacement Pumps Market Volume (K Unit), by End-user Industry 2025 & 2033
- Figure 33: Europe APAC Positive Displacement Pumps Market Revenue Share (%), by End-user Industry 2025 & 2033
- Figure 34: Europe APAC Positive Displacement Pumps Market Volume Share (%), by End-user Industry 2025 & 2033
- Figure 35: Europe APAC Positive Displacement Pumps Market Revenue (million), by Country 2025 & 2033
- Figure 36: Europe APAC Positive Displacement Pumps Market Volume (K Unit), by Country 2025 & 2033
- Figure 37: Europe APAC Positive Displacement Pumps Market Revenue Share (%), by Country 2025 & 2033
- Figure 38: Europe APAC Positive Displacement Pumps Market Volume Share (%), by Country 2025 & 2033
- Figure 39: Middle East & Africa APAC Positive Displacement Pumps Market Revenue (million), by Type 2025 & 2033
- Figure 40: Middle East & Africa APAC Positive Displacement Pumps Market Volume (K Unit), by Type 2025 & 2033
- Figure 41: Middle East & Africa APAC Positive Displacement Pumps Market Revenue Share (%), by Type 2025 & 2033
- Figure 42: Middle East & Africa APAC Positive Displacement Pumps Market Volume Share (%), by Type 2025 & 2033
- Figure 43: Middle East & Africa APAC Positive Displacement Pumps Market Revenue (million), by End-user Industry 2025 & 2033
- Figure 44: Middle East & Africa APAC Positive Displacement Pumps Market Volume (K Unit), by End-user Industry 2025 & 2033
- Figure 45: Middle East & Africa APAC Positive Displacement Pumps Market Revenue Share (%), by End-user Industry 2025 & 2033
- Figure 46: Middle East & Africa APAC Positive Displacement Pumps Market Volume Share (%), by End-user Industry 2025 & 2033
- Figure 47: Middle East & Africa APAC Positive Displacement Pumps Market Revenue (million), by Country 2025 & 2033
- Figure 48: Middle East & Africa APAC Positive Displacement Pumps Market Volume (K Unit), by Country 2025 & 2033
- Figure 49: Middle East & Africa APAC Positive Displacement Pumps Market Revenue Share (%), by Country 2025 & 2033
- Figure 50: Middle East & Africa APAC Positive Displacement Pumps Market Volume Share (%), by Country 2025 & 2033
- Figure 51: Asia Pacific APAC Positive Displacement Pumps Market Revenue (million), by Type 2025 & 2033
- Figure 52: Asia Pacific APAC Positive Displacement Pumps Market Volume (K Unit), by Type 2025 & 2033
- Figure 53: Asia Pacific APAC Positive Displacement Pumps Market Revenue Share (%), by Type 2025 & 2033
- Figure 54: Asia Pacific APAC Positive Displacement Pumps Market Volume Share (%), by Type 2025 & 2033
- Figure 55: Asia Pacific APAC Positive Displacement Pumps Market Revenue (million), by End-user Industry 2025 & 2033
- Figure 56: Asia Pacific APAC Positive Displacement Pumps Market Volume (K Unit), by End-user Industry 2025 & 2033
- Figure 57: Asia Pacific APAC Positive Displacement Pumps Market Revenue Share (%), by End-user Industry 2025 & 2033
- Figure 58: Asia Pacific APAC Positive Displacement Pumps Market Volume Share (%), by End-user Industry 2025 & 2033
- Figure 59: Asia Pacific APAC Positive Displacement Pumps Market Revenue (million), by Country 2025 & 2033
- Figure 60: Asia Pacific APAC Positive Displacement Pumps Market Volume (K Unit), by Country 2025 & 2033
- Figure 61: Asia Pacific APAC Positive Displacement Pumps Market Revenue Share (%), by Country 2025 & 2033
- Figure 62: Asia Pacific APAC Positive Displacement Pumps Market Volume Share (%), by Country 2025 & 2033
List of Tables
- Table 1: Global APAC Positive Displacement Pumps Market Revenue million Forecast, by Type 2020 & 2033
- Table 2: Global APAC Positive Displacement Pumps Market Volume K Unit Forecast, by Type 2020 & 2033
- Table 3: Global APAC Positive Displacement Pumps Market Revenue million Forecast, by End-user Industry 2020 & 2033
- Table 4: Global APAC Positive Displacement Pumps Market Volume K Unit Forecast, by End-user Industry 2020 & 2033
- Table 5: Global APAC Positive Displacement Pumps Market Revenue million Forecast, by Region 2020 & 2033
- Table 6: Global APAC Positive Displacement Pumps Market Volume K Unit Forecast, by Region 2020 & 2033
- Table 7: Global APAC Positive Displacement Pumps Market Revenue million Forecast, by Type 2020 & 2033
- Table 8: Global APAC Positive Displacement Pumps Market Volume K Unit Forecast, by Type 2020 & 2033
- Table 9: Global APAC Positive Displacement Pumps Market Revenue million Forecast, by End-user Industry 2020 & 2033
- Table 10: Global APAC Positive Displacement Pumps Market Volume K Unit Forecast, by End-user Industry 2020 & 2033
- Table 11: Global APAC Positive Displacement Pumps Market Revenue million Forecast, by Country 2020 & 2033
- Table 12: Global APAC Positive Displacement Pumps Market Volume K Unit Forecast, by Country 2020 & 2033
- Table 13: United States APAC Positive Displacement Pumps Market Revenue (million) Forecast, by Application 2020 & 2033
- Table 14: United States APAC Positive Displacement Pumps Market Volume (K Unit) Forecast, by Application 2020 & 2033
- Table 15: Canada APAC Positive Displacement Pumps Market Revenue (million) Forecast, by Application 2020 & 2033
- Table 16: Canada APAC Positive Displacement Pumps Market Volume (K Unit) Forecast, by Application 2020 & 2033
- Table 17: Mexico APAC Positive Displacement Pumps Market Revenue (million) Forecast, by Application 2020 & 2033
- Table 18: Mexico APAC Positive Displacement Pumps Market Volume (K Unit) Forecast, by Application 2020 & 2033
- Table 19: Global APAC Positive Displacement Pumps Market Revenue million Forecast, by Type 2020 & 2033
- Table 20: Global APAC Positive Displacement Pumps Market Volume K Unit Forecast, by Type 2020 & 2033
- Table 21: Global APAC Positive Displacement Pumps Market Revenue million Forecast, by End-user Industry 2020 & 2033
- Table 22: Global APAC Positive Displacement Pumps Market Volume K Unit Forecast, by End-user Industry 2020 & 2033
- Table 23: Global APAC Positive Displacement Pumps Market Revenue million Forecast, by Country 2020 & 2033
- Table 24: Global APAC Positive Displacement Pumps Market Volume K Unit Forecast, by Country 2020 & 2033
- Table 25: Brazil APAC Positive Displacement Pumps Market Revenue (million) Forecast, by Application 2020 & 2033
- Table 26: Brazil APAC Positive Displacement Pumps Market Volume (K Unit) Forecast, by Application 2020 & 2033
- Table 27: Argentina APAC Positive Displacement Pumps Market Revenue (million) Forecast, by Application 2020 & 2033
- Table 28: Argentina APAC Positive Displacement Pumps Market Volume (K Unit) Forecast, by Application 2020 & 2033
- Table 29: Rest of South America APAC Positive Displacement Pumps Market Revenue (million) Forecast, by Application 2020 & 2033
- Table 30: Rest of South America APAC Positive Displacement Pumps Market Volume (K Unit) Forecast, by Application 2020 & 2033
- Table 31: Global APAC Positive Displacement Pumps Market Revenue million Forecast, by Type 2020 & 2033
- Table 32: Global APAC Positive Displacement Pumps Market Volume K Unit Forecast, by Type 2020 & 2033
- Table 33: Global APAC Positive Displacement Pumps Market Revenue million Forecast, by End-user Industry 2020 & 2033
- Table 34: Global APAC Positive Displacement Pumps Market Volume K Unit Forecast, by End-user Industry 2020 & 2033
- Table 35: Global APAC Positive Displacement Pumps Market Revenue million Forecast, by Country 2020 & 2033
- Table 36: Global APAC Positive Displacement Pumps Market Volume K Unit Forecast, by Country 2020 & 2033
- Table 37: United Kingdom APAC Positive Displacement Pumps Market Revenue (million) Forecast, by Application 2020 & 2033
- Table 38: United Kingdom APAC Positive Displacement Pumps Market Volume (K Unit) Forecast, by Application 2020 & 2033
- Table 39: Germany APAC Positive Displacement Pumps Market Revenue (million) Forecast, by Application 2020 & 2033
- Table 40: Germany APAC Positive Displacement Pumps Market Volume (K Unit) Forecast, by Application 2020 & 2033
- Table 41: France APAC Positive Displacement Pumps Market Revenue (million) Forecast, by Application 2020 & 2033
- Table 42: France APAC Positive Displacement Pumps Market Volume (K Unit) Forecast, by Application 2020 & 2033
- Table 43: Italy APAC Positive Displacement Pumps Market Revenue (million) Forecast, by Application 2020 & 2033
- Table 44: Italy APAC Positive Displacement Pumps Market Volume (K Unit) Forecast, by Application 2020 & 2033
- Table 45: Spain APAC Positive Displacement Pumps Market Revenue (million) Forecast, by Application 2020 & 2033
- Table 46: Spain APAC Positive Displacement Pumps Market Volume (K Unit) Forecast, by Application 2020 & 2033
- Table 47: Russia APAC Positive Displacement Pumps Market Revenue (million) Forecast, by Application 2020 & 2033
- Table 48: Russia APAC Positive Displacement Pumps Market Volume (K Unit) Forecast, by Application 2020 & 2033
- Table 49: Benelux APAC Positive Displacement Pumps Market Revenue (million) Forecast, by Application 2020 & 2033
- Table 50: Benelux APAC Positive Displacement Pumps Market Volume (K Unit) Forecast, by Application 2020 & 2033
- Table 51: Nordics APAC Positive Displacement Pumps Market Revenue (million) Forecast, by Application 2020 & 2033
- Table 52: Nordics APAC Positive Displacement Pumps Market Volume (K Unit) Forecast, by Application 2020 & 2033
- Table 53: Rest of Europe APAC Positive Displacement Pumps Market Revenue (million) Forecast, by Application 2020 & 2033
- Table 54: Rest of Europe APAC Positive Displacement Pumps Market Volume (K Unit) Forecast, by Application 2020 & 2033
- Table 55: Global APAC Positive Displacement Pumps Market Revenue million Forecast, by Type 2020 & 2033
- Table 56: Global APAC Positive Displacement Pumps Market Volume K Unit Forecast, by Type 2020 & 2033
- Table 57: Global APAC Positive Displacement Pumps Market Revenue million Forecast, by End-user Industry 2020 & 2033
- Table 58: Global APAC Positive Displacement Pumps Market Volume K Unit Forecast, by End-user Industry 2020 & 2033
- Table 59: Global APAC Positive Displacement Pumps Market Revenue million Forecast, by Country 2020 & 2033
- Table 60: Global APAC Positive Displacement Pumps Market Volume K Unit Forecast, by Country 2020 & 2033
- Table 61: Turkey APAC Positive Displacement Pumps Market Revenue (million) Forecast, by Application 2020 & 2033
- Table 62: Turkey APAC Positive Displacement Pumps Market Volume (K Unit) Forecast, by Application 2020 & 2033
- Table 63: Israel APAC Positive Displacement Pumps Market Revenue (million) Forecast, by Application 2020 & 2033
- Table 64: Israel APAC Positive Displacement Pumps Market Volume (K Unit) Forecast, by Application 2020 & 2033
- Table 65: GCC APAC Positive Displacement Pumps Market Revenue (million) Forecast, by Application 2020 & 2033
- Table 66: GCC APAC Positive Displacement Pumps Market Volume (K Unit) Forecast, by Application 2020 & 2033
- Table 67: North Africa APAC Positive Displacement Pumps Market Revenue (million) Forecast, by Application 2020 & 2033
- Table 68: North Africa APAC Positive Displacement Pumps Market Volume (K Unit) Forecast, by Application 2020 & 2033
- Table 69: South Africa APAC Positive Displacement Pumps Market Revenue (million) Forecast, by Application 2020 & 2033
- Table 70: South Africa APAC Positive Displacement Pumps Market Volume (K Unit) Forecast, by Application 2020 & 2033
- Table 71: Rest of Middle East & Africa APAC Positive Displacement Pumps Market Revenue (million) Forecast, by Application 2020 & 2033
- Table 72: Rest of Middle East & Africa APAC Positive Displacement Pumps Market Volume (K Unit) Forecast, by Application 2020 & 2033
- Table 73: Global APAC Positive Displacement Pumps Market Revenue million Forecast, by Type 2020 & 2033
- Table 74: Global APAC Positive Displacement Pumps Market Volume K Unit Forecast, by Type 2020 & 2033
- Table 75: Global APAC Positive Displacement Pumps Market Revenue million Forecast, by End-user Industry 2020 & 2033
- Table 76: Global APAC Positive Displacement Pumps Market Volume K Unit Forecast, by End-user Industry 2020 & 2033
- Table 77: Global APAC Positive Displacement Pumps Market Revenue million Forecast, by Country 2020 & 2033
- Table 78: Global APAC Positive Displacement Pumps Market Volume K Unit Forecast, by Country 2020 & 2033
- Table 79: China APAC Positive Displacement Pumps Market Revenue (million) Forecast, by Application 2020 & 2033
- Table 80: China APAC Positive Displacement Pumps Market Volume (K Unit) Forecast, by Application 2020 & 2033
- Table 81: India APAC Positive Displacement Pumps Market Revenue (million) Forecast, by Application 2020 & 2033
- Table 82: India APAC Positive Displacement Pumps Market Volume (K Unit) Forecast, by Application 2020 & 2033
- Table 83: Japan APAC Positive Displacement Pumps Market Revenue (million) Forecast, by Application 2020 & 2033
- Table 84: Japan APAC Positive Displacement Pumps Market Volume (K Unit) Forecast, by Application 2020 & 2033
- Table 85: South Korea APAC Positive Displacement Pumps Market Revenue (million) Forecast, by Application 2020 & 2033
- Table 86: South Korea APAC Positive Displacement Pumps Market Volume (K Unit) Forecast, by Application 2020 & 2033
- Table 87: ASEAN APAC Positive Displacement Pumps Market Revenue (million) Forecast, by Application 2020 & 2033
- Table 88: ASEAN APAC Positive Displacement Pumps Market Volume (K Unit) Forecast, by Application 2020 & 2033
- Table 89: Oceania APAC Positive Displacement Pumps Market Revenue (million) Forecast, by Application 2020 & 2033
- Table 90: Oceania APAC Positive Displacement Pumps Market Volume (K Unit) Forecast, by Application 2020 & 2033
- Table 91: Rest of Asia Pacific APAC Positive Displacement Pumps Market Revenue (million) Forecast, by Application 2020 & 2033
- Table 92: Rest of Asia Pacific APAC Positive Displacement Pumps Market Volume (K Unit) Forecast, by Application 2020 & 2033
Frequently Asked Questions
1. What is the projected Compound Annual Growth Rate (CAGR) of the APAC Positive Displacement Pumps Market?
The projected CAGR is approximately 5.4%.
2. Which companies are prominent players in the APAC Positive Displacement Pumps Market?
Key companies in the market include The Weir Group PLC, Xylem Inc, KSB SE & Co KGaA, SPX Flow Inc, NETZSCH Holding, TSURUMI MANUFACTURING CO LTD , Sulzer AG, Pentair PLC, Atlas Copco, GRUNDFOS.
3. What are the main segments of the APAC Positive Displacement Pumps Market?
The market segments include Type, End-user Industry.
4. Can you provide details about the market size?
The market size is estimated to be USD 20721.9 million as of 2022.
5. What are some drivers contributing to market growth?
Increased Focus on Wastewater Management.
6. What are the notable trends driving market growth?
Waste and Wastewater Industry is Expected to Register Significant Growth.
7. Are there any restraints impacting market growth?
Environmental and Safe Use Concerns.
8. Can you provide examples of recent developments in the market?
February 2022 - NETZSCH Pumps and Systems announced the expansion of its product portfolio with the launch of the PERIPRO peristaltic pump. The pump model is available in chemical, industrial, and food versions. Moreover, the newly launched product complements the company's well-known technologies of NEMO progressing cavity pumps, NOTOS multi screw pumps, and TORNADO rotary lobe pumps.
9. What pricing options are available for accessing the report?
Pricing options include single-user, multi-user, and enterprise licenses priced at USD 4750, USD 4950, and USD 6800 respectively.
10. Is the market size provided in terms of value or volume?
The market size is provided in terms of value, measured in million and volume, measured in K Unit.
11. Are there any specific market keywords associated with the report?
Yes, the market keyword associated with the report is "APAC Positive Displacement Pumps Market," which aids in identifying and referencing the specific market segment covered.
12. How do I determine which pricing option suits my needs best?
The pricing options vary based on user requirements and access needs. Individual users may opt for single-user licenses, while businesses requiring broader access may choose multi-user or enterprise licenses for cost-effective access to the report.
13. Are there any additional resources or data provided in the APAC Positive Displacement Pumps Market report?
While the report offers comprehensive insights, it's advisable to review the specific contents or supplementary materials provided to ascertain if additional resources or data are available.
14. How can I stay updated on further developments or reports in the APAC Positive Displacement Pumps Market?
To stay informed about further developments, trends, and reports in the APAC Positive Displacement Pumps Market, consider subscribing to industry newsletters, following relevant companies and organizations, or regularly checking reputable industry news sources and publications.
Methodology
Step 1 - Identification of Relevant Samples Size from Population Database


Step 2 - Approaches for Defining Global Market Size (Value, Volume* & Price*)

Note*: In applicable scenarios
Step 3 - Data Sources
Primary Research
- Web Analytics
- Survey Reports
- Research Institute
- Latest Research Reports
- Opinion Leaders
Secondary Research
- Annual Reports
- White Paper
- Latest Press Release
- Industry Association
- Paid Database
- Investor Presentations

Step 4 - Data Triangulation
Involves using different sources of information in order to increase the validity of a study
These sources are likely to be stakeholders in a program - participants, other researchers, program staff, other community members, and so on.
Then we put all data in single framework & apply various statistical tools to find out the dynamic on the market.
During the analysis stage, feedback from the stakeholder groups would be compared to determine areas of agreement as well as areas of divergence