

Key Insights
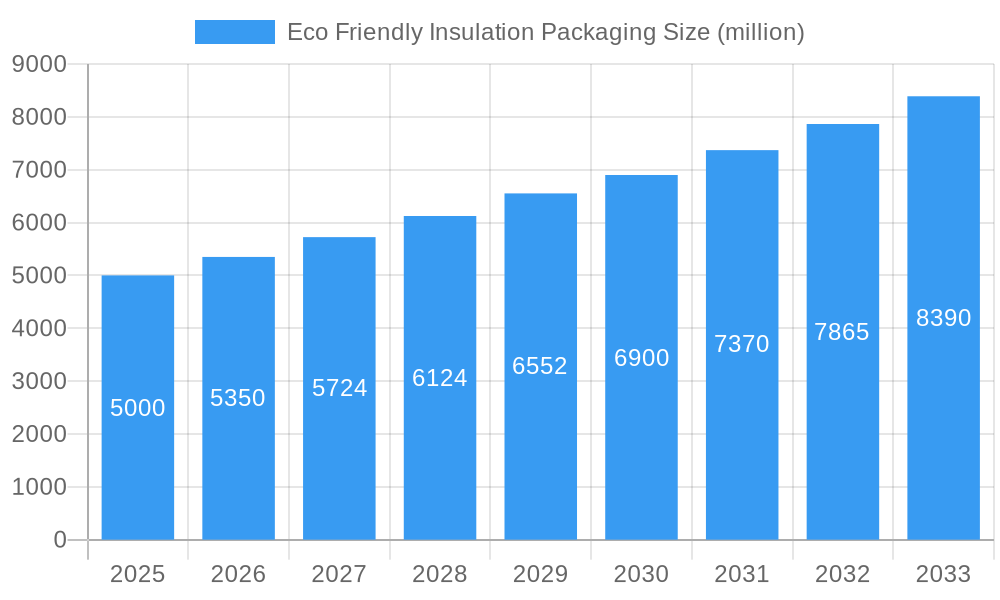
The eco-friendly insulation packaging market is experiencing robust growth, driven by increasing environmental concerns and stringent regulations regarding plastic waste. The market, estimated at $5 billion in 2025, is projected to expand at a compound annual growth rate (CAGR) of 7% from 2025 to 2033, reaching approximately $9 billion by 2033. This surge is fueled by the rising demand for sustainable packaging solutions across various industries, including food and beverage, pharmaceuticals, and e-commerce. Consumers are increasingly conscious of their environmental footprint, demanding products with minimal environmental impact, pushing manufacturers to adopt eco-friendly materials like biodegradable foams, paper-based insulation, and recycled content packaging. Government initiatives promoting sustainable practices and reducing plastic pollution further accelerate market adoption. Key trends include the development of innovative, lightweight materials that improve thermal efficiency and reduce transportation costs, along with a shift towards reusable and returnable packaging systems.
Eco Friendly Insulation Packaging Market Size (In Billion)
However, the market faces challenges. Higher initial costs associated with eco-friendly materials compared to conventional options might hinder widespread adoption, particularly among small and medium-sized enterprises. The lack of standardized testing and certification processes for eco-friendly materials can create complexities in ensuring consistent quality and performance. Furthermore, maintaining the same level of insulation efficiency as conventional packaging remains a key technical hurdle that needs to be overcome. Despite these restraints, the long-term outlook remains positive, driven by increasing consumer and regulatory pressure to adopt sustainable alternatives, and continued innovation in material science and packaging design. Leading players like Visy Industries, Insulated Products Corp, and Sealed Air are actively investing in research and development to overcome these challenges and capitalize on the growing market opportunity.
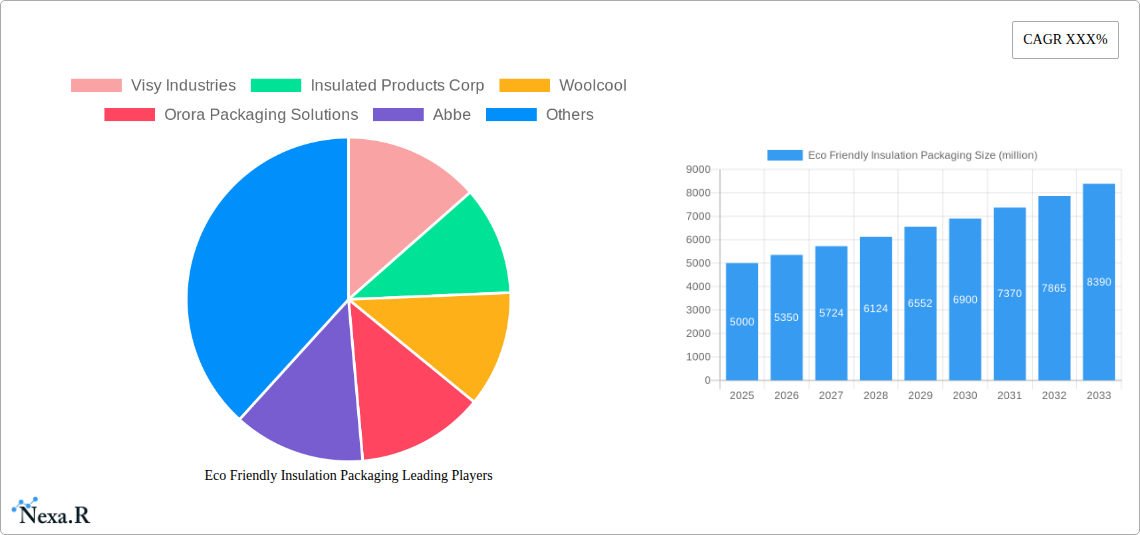
Eco Friendly Insulation Packaging Company Market Share
This comprehensive report provides a detailed analysis of the eco-friendly insulation packaging market, encompassing market dynamics, growth trends, regional analysis, product landscape, key players, and future outlook. The study period spans from 2019 to 2033, with 2025 serving as both the base and estimated year. This report is essential for industry professionals, investors, and strategic decision-makers seeking a thorough understanding of this rapidly evolving market. The report covers the parent market of packaging materials and the child market of insulation packaging, providing a holistic view.
Eco Friendly Insulation Packaging Market Dynamics & Structure
The eco-friendly insulation packaging market is characterized by increasing market concentration, driven by mergers and acquisitions (M&A) activity. Over the historical period (2019-2024), approximately xx million M&A deals were recorded, leading to a market share concentration of xx% among the top 5 players by 2025. Technological innovation, particularly in bio-based materials and improved insulation efficiency, is a key growth driver. Stringent environmental regulations are further propelling market expansion, while the availability of cost-effective substitutes and evolving end-user demographics influence market dynamics.
- Market Concentration: Top 5 players hold xx% market share (2025).
- Technological Innovation: Focus on bio-based materials, improved insulation R-values.
- Regulatory Framework: Stringent environmental regulations driving demand.
- Competitive Substitutes: Traditional polystyrene foam faces increasing pressure.
- End-User Demographics: Growth in e-commerce and temperature-sensitive goods drives demand.
- M&A Trends: xx million deals recorded (2019-2024), consolidating market leadership.
- Innovation Barriers: High R&D costs and scaling challenges for novel materials.
Eco Friendly Insulation Packaging Growth Trends & Insights
The eco-friendly insulation packaging market is experiencing robust growth, fueled by increasing consumer awareness of environmental issues and the growing demand for sustainable packaging solutions. The market size reached xx million units in 2025 and is projected to reach xx million units by 2033, exhibiting a CAGR of xx% during the forecast period (2025-2033). This growth is attributed to several factors, including the rising adoption of e-commerce, the increasing demand for temperature-sensitive products (pharmaceuticals, food), and technological advancements in bio-based and recycled materials. The market penetration rate for eco-friendly insulation packaging is estimated to be xx% in 2025, with significant potential for further expansion. Technological disruptions, such as the development of advanced insulation materials with superior thermal performance, are expected to further accelerate market growth. Consumer behavior shifts towards sustainable consumption patterns are also playing a significant role.
Dominant Regions, Countries, or Segments in Eco Friendly Insulation Packaging
North America currently dominates the eco-friendly insulation packaging market, accounting for approximately xx% of the global market share in 2025. This dominance is primarily attributed to stringent environmental regulations, high consumer awareness, and a well-established supply chain. However, regions like Asia-Pacific are experiencing rapid growth due to increasing industrialization, rising disposable incomes, and a burgeoning e-commerce sector.
- North America: High consumer awareness, stringent regulations, established supply chain.
- Europe: Strong environmental policies drive adoption.
- Asia-Pacific: Rapid industrialization and e-commerce growth fuel demand.
- Market Share: North America holds xx% (2025), Asia-Pacific at xx% (2025).
- Growth Potential: Asia-Pacific shows highest growth potential due to rapid economic development and increasing demand for temperature-sensitive products.
Eco Friendly Insulation Packaging Product Landscape
The eco-friendly insulation packaging market offers a diverse range of products, including bio-based alternatives like mushroom packaging and seaweed-based solutions, as well as recycled paperboard and other innovative materials. These products are designed to meet diverse applications, from cold chain logistics to the transport of sensitive electronic components. Key performance metrics include R-value (thermal resistance), moisture resistance, and recyclability. Unique selling propositions frequently center on superior sustainability credentials, improved performance characteristics, and cost-effectiveness compared to traditional options. Recent technological advancements focus on enhancing insulation efficiency while minimizing environmental impact.
Key Drivers, Barriers & Challenges in Eco Friendly Insulation Packaging
Key Drivers:
- Increasing consumer demand for sustainable products.
- Stringent environmental regulations and policies.
- Growth of e-commerce and demand for temperature-sensitive goods.
- Technological advancements in bio-based and recycled materials.
Key Challenges and Restraints:
- High initial investment costs for new technologies and manufacturing facilities.
- Limited availability of raw materials for some eco-friendly alternatives.
- Potential supply chain disruptions affecting material sourcing and availability.
- Competition from traditional, less sustainable packaging options. The price differential remains a barrier for some segments.
Emerging Opportunities in Eco Friendly Insulation Packaging
Significant opportunities exist in developing biodegradable and compostable insulation materials, catering to the growing demand for fully sustainable packaging solutions. Untapped markets in developing economies present substantial growth potential. Innovation in material science and packaging design can lead to lighter, more efficient insulation packaging solutions, reducing transportation costs and environmental impact. The use of recycled materials continues to expand, creating new business opportunities.
Growth Accelerators in the Eco Friendly Insulation Packaging Industry
Strategic partnerships between packaging manufacturers and technology providers can accelerate the development and adoption of innovative solutions. Market expansion strategies focused on emerging economies with high growth potential are essential for long-term growth. Technological breakthroughs in material science, leading to superior insulation performance and reduced costs, are key to fostering wider market adoption.
Key Players Shaping the Eco Friendly Insulation Packaging Market
- Visy Industries
- Insulated Products Corp
- Woolcool
- Orora Packaging Solutions
- Abbe
- Planet Protector
- Pro-pac Packaging
- Puffin Packaging
- The Illuminate Group
- Sealed Air
- Thermologistics Group
- Sancell
- Cryolux Group
- Pearl Ice
- KODIAKOOLER
Notable Milestones in Eco Friendly Insulation Packaging Sector
- 2021: Launch of a fully compostable insulation material by [Company Name].
- 2022: Partnership between [Company A] and [Company B] to develop a new bio-based insulation solution.
- 2023: Implementation of new EU regulations on single-use plastics, boosting demand for eco-friendly alternatives.
- 2024: Acquisition of [Company X] by [Company Y], increasing market concentration.
In-Depth Eco Friendly Insulation Packaging Market Outlook
The eco-friendly insulation packaging market is poised for continued growth, driven by strong environmental concerns and technological advancements. Strategic investments in R&D, sustainable sourcing, and efficient manufacturing processes will be crucial for capturing market share. Collaboration across the value chain will enhance the development and adoption of innovative, sustainable packaging solutions, contributing significantly to the circular economy. The long-term outlook remains positive, with substantial opportunities for companies to capitalize on the rising demand for eco-conscious packaging options.
Eco Friendly Insulation Packaging Segmentation
-
1. Application
- 1.1. Food
- 1.2. Pharmaceutical
- 1.3. Others
-
2. Type
- 2.1. Insulated Bag
- 2.2. Insulated Container
- 2.3. Others
Eco Friendly Insulation Packaging Segmentation By Geography
-
1. North America
- 1.1. United States
- 1.2. Canada
- 1.3. Mexico
-
2. South America
- 2.1. Brazil
- 2.2. Argentina
- 2.3. Rest of South America
-
3. Europe
- 3.1. United Kingdom
- 3.2. Germany
- 3.3. France
- 3.4. Italy
- 3.5. Spain
- 3.6. Russia
- 3.7. Benelux
- 3.8. Nordics
- 3.9. Rest of Europe
-
4. Middle East & Africa
- 4.1. Turkey
- 4.2. Israel
- 4.3. GCC
- 4.4. North Africa
- 4.5. South Africa
- 4.6. Rest of Middle East & Africa
-
5. Asia Pacific
- 5.1. China
- 5.2. India
- 5.3. Japan
- 5.4. South Korea
- 5.5. ASEAN
- 5.6. Oceania
- 5.7. Rest of Asia Pacific

Eco Friendly Insulation Packaging Regional Market Share
Geographic Coverage of Eco Friendly Insulation Packaging
Eco Friendly Insulation Packaging REPORT HIGHLIGHTS
| Aspects | Details |
|---|---|
| Study Period | 2020-2034 |
| Base Year | 2025 |
| Estimated Year | 2026 |
| Forecast Period | 2026-2034 |
| Historical Period | 2020-2025 |
| Growth Rate | CAGR of XXX% from 2020-2034 |
| Segmentation |
|
Table of Contents
- 1. Introduction
- 1.1. Research Scope
- 1.2. Market Segmentation
- 1.3. Research Methodology
- 1.4. Definitions and Assumptions
- 2. Executive Summary
- 2.1. Introduction
- 3. Market Dynamics
- 3.1. Introduction
- 3.2. Market Drivers
- 3.3. Market Restrains
- 3.4. Market Trends
- 4. Market Factor Analysis
- 4.1. Porters Five Forces
- 4.2. Supply/Value Chain
- 4.3. PESTEL analysis
- 4.4. Market Entropy
- 4.5. Patent/Trademark Analysis
- 5. Global Eco Friendly Insulation Packaging Analysis, Insights and Forecast, 2020-2032
- 5.1. Market Analysis, Insights and Forecast - by Application
- 5.1.1. Food
- 5.1.2. Pharmaceutical
- 5.1.3. Others
- 5.2. Market Analysis, Insights and Forecast - by Type
- 5.2.1. Insulated Bag
- 5.2.2. Insulated Container
- 5.2.3. Others
- 5.3. Market Analysis, Insights and Forecast - by Region
- 5.3.1. North America
- 5.3.2. South America
- 5.3.3. Europe
- 5.3.4. Middle East & Africa
- 5.3.5. Asia Pacific
- 5.1. Market Analysis, Insights and Forecast - by Application
- 6. North America Eco Friendly Insulation Packaging Analysis, Insights and Forecast, 2020-2032
- 6.1. Market Analysis, Insights and Forecast - by Application
- 6.1.1. Food
- 6.1.2. Pharmaceutical
- 6.1.3. Others
- 6.2. Market Analysis, Insights and Forecast - by Type
- 6.2.1. Insulated Bag
- 6.2.2. Insulated Container
- 6.2.3. Others
- 6.1. Market Analysis, Insights and Forecast - by Application
- 7. South America Eco Friendly Insulation Packaging Analysis, Insights and Forecast, 2020-2032
- 7.1. Market Analysis, Insights and Forecast - by Application
- 7.1.1. Food
- 7.1.2. Pharmaceutical
- 7.1.3. Others
- 7.2. Market Analysis, Insights and Forecast - by Type
- 7.2.1. Insulated Bag
- 7.2.2. Insulated Container
- 7.2.3. Others
- 7.1. Market Analysis, Insights and Forecast - by Application
- 8. Europe Eco Friendly Insulation Packaging Analysis, Insights and Forecast, 2020-2032
- 8.1. Market Analysis, Insights and Forecast - by Application
- 8.1.1. Food
- 8.1.2. Pharmaceutical
- 8.1.3. Others
- 8.2. Market Analysis, Insights and Forecast - by Type
- 8.2.1. Insulated Bag
- 8.2.2. Insulated Container
- 8.2.3. Others
- 8.1. Market Analysis, Insights and Forecast - by Application
- 9. Middle East & Africa Eco Friendly Insulation Packaging Analysis, Insights and Forecast, 2020-2032
- 9.1. Market Analysis, Insights and Forecast - by Application
- 9.1.1. Food
- 9.1.2. Pharmaceutical
- 9.1.3. Others
- 9.2. Market Analysis, Insights and Forecast - by Type
- 9.2.1. Insulated Bag
- 9.2.2. Insulated Container
- 9.2.3. Others
- 9.1. Market Analysis, Insights and Forecast - by Application
- 10. Asia Pacific Eco Friendly Insulation Packaging Analysis, Insights and Forecast, 2020-2032
- 10.1. Market Analysis, Insights and Forecast - by Application
- 10.1.1. Food
- 10.1.2. Pharmaceutical
- 10.1.3. Others
- 10.2. Market Analysis, Insights and Forecast - by Type
- 10.2.1. Insulated Bag
- 10.2.2. Insulated Container
- 10.2.3. Others
- 10.1. Market Analysis, Insights and Forecast - by Application
- 11. Competitive Analysis
- 11.1. Global Market Share Analysis 2025
- 11.2. Company Profiles
- 11.2.1 Visy Industries
- 11.2.1.1. Overview
- 11.2.1.2. Products
- 11.2.1.3. SWOT Analysis
- 11.2.1.4. Recent Developments
- 11.2.1.5. Financials (Based on Availability)
- 11.2.2 Insulated Products Corp
- 11.2.2.1. Overview
- 11.2.2.2. Products
- 11.2.2.3. SWOT Analysis
- 11.2.2.4. Recent Developments
- 11.2.2.5. Financials (Based on Availability)
- 11.2.3 Woolcool
- 11.2.3.1. Overview
- 11.2.3.2. Products
- 11.2.3.3. SWOT Analysis
- 11.2.3.4. Recent Developments
- 11.2.3.5. Financials (Based on Availability)
- 11.2.4 Orora Packaging Solutions
- 11.2.4.1. Overview
- 11.2.4.2. Products
- 11.2.4.3. SWOT Analysis
- 11.2.4.4. Recent Developments
- 11.2.4.5. Financials (Based on Availability)
- 11.2.5 Abbe
- 11.2.5.1. Overview
- 11.2.5.2. Products
- 11.2.5.3. SWOT Analysis
- 11.2.5.4. Recent Developments
- 11.2.5.5. Financials (Based on Availability)
- 11.2.6 Planet Protector
- 11.2.6.1. Overview
- 11.2.6.2. Products
- 11.2.6.3. SWOT Analysis
- 11.2.6.4. Recent Developments
- 11.2.6.5. Financials (Based on Availability)
- 11.2.7 Pro-pac Packaging
- 11.2.7.1. Overview
- 11.2.7.2. Products
- 11.2.7.3. SWOT Analysis
- 11.2.7.4. Recent Developments
- 11.2.7.5. Financials (Based on Availability)
- 11.2.8 Puffin Packaging
- 11.2.8.1. Overview
- 11.2.8.2. Products
- 11.2.8.3. SWOT Analysis
- 11.2.8.4. Recent Developments
- 11.2.8.5. Financials (Based on Availability)
- 11.2.9 The Illuminate Group
- 11.2.9.1. Overview
- 11.2.9.2. Products
- 11.2.9.3. SWOT Analysis
- 11.2.9.4. Recent Developments
- 11.2.9.5. Financials (Based on Availability)
- 11.2.10 Sealed Air
- 11.2.10.1. Overview
- 11.2.10.2. Products
- 11.2.10.3. SWOT Analysis
- 11.2.10.4. Recent Developments
- 11.2.10.5. Financials (Based on Availability)
- 11.2.11 Thermologistics Group
- 11.2.11.1. Overview
- 11.2.11.2. Products
- 11.2.11.3. SWOT Analysis
- 11.2.11.4. Recent Developments
- 11.2.11.5. Financials (Based on Availability)
- 11.2.12 Sancell
- 11.2.12.1. Overview
- 11.2.12.2. Products
- 11.2.12.3. SWOT Analysis
- 11.2.12.4. Recent Developments
- 11.2.12.5. Financials (Based on Availability)
- 11.2.13 Cryolux Group
- 11.2.13.1. Overview
- 11.2.13.2. Products
- 11.2.13.3. SWOT Analysis
- 11.2.13.4. Recent Developments
- 11.2.13.5. Financials (Based on Availability)
- 11.2.14 Pearl IcePearl Ice
- 11.2.14.1. Overview
- 11.2.14.2. Products
- 11.2.14.3. SWOT Analysis
- 11.2.14.4. Recent Developments
- 11.2.14.5. Financials (Based on Availability)
- 11.2.15 KODIAKOOLER
- 11.2.15.1. Overview
- 11.2.15.2. Products
- 11.2.15.3. SWOT Analysis
- 11.2.15.4. Recent Developments
- 11.2.15.5. Financials (Based on Availability)
- 11.2.1 Visy Industries
List of Figures
- Figure 1: Global Eco Friendly Insulation Packaging Revenue Breakdown (million, %) by Region 2025 & 2033
- Figure 2: North America Eco Friendly Insulation Packaging Revenue (million), by Application 2025 & 2033
- Figure 3: North America Eco Friendly Insulation Packaging Revenue Share (%), by Application 2025 & 2033
- Figure 4: North America Eco Friendly Insulation Packaging Revenue (million), by Type 2025 & 2033
- Figure 5: North America Eco Friendly Insulation Packaging Revenue Share (%), by Type 2025 & 2033
- Figure 6: North America Eco Friendly Insulation Packaging Revenue (million), by Country 2025 & 2033
- Figure 7: North America Eco Friendly Insulation Packaging Revenue Share (%), by Country 2025 & 2033
- Figure 8: South America Eco Friendly Insulation Packaging Revenue (million), by Application 2025 & 2033
- Figure 9: South America Eco Friendly Insulation Packaging Revenue Share (%), by Application 2025 & 2033
- Figure 10: South America Eco Friendly Insulation Packaging Revenue (million), by Type 2025 & 2033
- Figure 11: South America Eco Friendly Insulation Packaging Revenue Share (%), by Type 2025 & 2033
- Figure 12: South America Eco Friendly Insulation Packaging Revenue (million), by Country 2025 & 2033
- Figure 13: South America Eco Friendly Insulation Packaging Revenue Share (%), by Country 2025 & 2033
- Figure 14: Europe Eco Friendly Insulation Packaging Revenue (million), by Application 2025 & 2033
- Figure 15: Europe Eco Friendly Insulation Packaging Revenue Share (%), by Application 2025 & 2033
- Figure 16: Europe Eco Friendly Insulation Packaging Revenue (million), by Type 2025 & 2033
- Figure 17: Europe Eco Friendly Insulation Packaging Revenue Share (%), by Type 2025 & 2033
- Figure 18: Europe Eco Friendly Insulation Packaging Revenue (million), by Country 2025 & 2033
- Figure 19: Europe Eco Friendly Insulation Packaging Revenue Share (%), by Country 2025 & 2033
- Figure 20: Middle East & Africa Eco Friendly Insulation Packaging Revenue (million), by Application 2025 & 2033
- Figure 21: Middle East & Africa Eco Friendly Insulation Packaging Revenue Share (%), by Application 2025 & 2033
- Figure 22: Middle East & Africa Eco Friendly Insulation Packaging Revenue (million), by Type 2025 & 2033
- Figure 23: Middle East & Africa Eco Friendly Insulation Packaging Revenue Share (%), by Type 2025 & 2033
- Figure 24: Middle East & Africa Eco Friendly Insulation Packaging Revenue (million), by Country 2025 & 2033
- Figure 25: Middle East & Africa Eco Friendly Insulation Packaging Revenue Share (%), by Country 2025 & 2033
- Figure 26: Asia Pacific Eco Friendly Insulation Packaging Revenue (million), by Application 2025 & 2033
- Figure 27: Asia Pacific Eco Friendly Insulation Packaging Revenue Share (%), by Application 2025 & 2033
- Figure 28: Asia Pacific Eco Friendly Insulation Packaging Revenue (million), by Type 2025 & 2033
- Figure 29: Asia Pacific Eco Friendly Insulation Packaging Revenue Share (%), by Type 2025 & 2033
- Figure 30: Asia Pacific Eco Friendly Insulation Packaging Revenue (million), by Country 2025 & 2033
- Figure 31: Asia Pacific Eco Friendly Insulation Packaging Revenue Share (%), by Country 2025 & 2033
List of Tables
- Table 1: Global Eco Friendly Insulation Packaging Revenue million Forecast, by Application 2020 & 2033
- Table 2: Global Eco Friendly Insulation Packaging Revenue million Forecast, by Type 2020 & 2033
- Table 3: Global Eco Friendly Insulation Packaging Revenue million Forecast, by Region 2020 & 2033
- Table 4: Global Eco Friendly Insulation Packaging Revenue million Forecast, by Application 2020 & 2033
- Table 5: Global Eco Friendly Insulation Packaging Revenue million Forecast, by Type 2020 & 2033
- Table 6: Global Eco Friendly Insulation Packaging Revenue million Forecast, by Country 2020 & 2033
- Table 7: United States Eco Friendly Insulation Packaging Revenue (million) Forecast, by Application 2020 & 2033
- Table 8: Canada Eco Friendly Insulation Packaging Revenue (million) Forecast, by Application 2020 & 2033
- Table 9: Mexico Eco Friendly Insulation Packaging Revenue (million) Forecast, by Application 2020 & 2033
- Table 10: Global Eco Friendly Insulation Packaging Revenue million Forecast, by Application 2020 & 2033
- Table 11: Global Eco Friendly Insulation Packaging Revenue million Forecast, by Type 2020 & 2033
- Table 12: Global Eco Friendly Insulation Packaging Revenue million Forecast, by Country 2020 & 2033
- Table 13: Brazil Eco Friendly Insulation Packaging Revenue (million) Forecast, by Application 2020 & 2033
- Table 14: Argentina Eco Friendly Insulation Packaging Revenue (million) Forecast, by Application 2020 & 2033
- Table 15: Rest of South America Eco Friendly Insulation Packaging Revenue (million) Forecast, by Application 2020 & 2033
- Table 16: Global Eco Friendly Insulation Packaging Revenue million Forecast, by Application 2020 & 2033
- Table 17: Global Eco Friendly Insulation Packaging Revenue million Forecast, by Type 2020 & 2033
- Table 18: Global Eco Friendly Insulation Packaging Revenue million Forecast, by Country 2020 & 2033
- Table 19: United Kingdom Eco Friendly Insulation Packaging Revenue (million) Forecast, by Application 2020 & 2033
- Table 20: Germany Eco Friendly Insulation Packaging Revenue (million) Forecast, by Application 2020 & 2033
- Table 21: France Eco Friendly Insulation Packaging Revenue (million) Forecast, by Application 2020 & 2033
- Table 22: Italy Eco Friendly Insulation Packaging Revenue (million) Forecast, by Application 2020 & 2033
- Table 23: Spain Eco Friendly Insulation Packaging Revenue (million) Forecast, by Application 2020 & 2033
- Table 24: Russia Eco Friendly Insulation Packaging Revenue (million) Forecast, by Application 2020 & 2033
- Table 25: Benelux Eco Friendly Insulation Packaging Revenue (million) Forecast, by Application 2020 & 2033
- Table 26: Nordics Eco Friendly Insulation Packaging Revenue (million) Forecast, by Application 2020 & 2033
- Table 27: Rest of Europe Eco Friendly Insulation Packaging Revenue (million) Forecast, by Application 2020 & 2033
- Table 28: Global Eco Friendly Insulation Packaging Revenue million Forecast, by Application 2020 & 2033
- Table 29: Global Eco Friendly Insulation Packaging Revenue million Forecast, by Type 2020 & 2033
- Table 30: Global Eco Friendly Insulation Packaging Revenue million Forecast, by Country 2020 & 2033
- Table 31: Turkey Eco Friendly Insulation Packaging Revenue (million) Forecast, by Application 2020 & 2033
- Table 32: Israel Eco Friendly Insulation Packaging Revenue (million) Forecast, by Application 2020 & 2033
- Table 33: GCC Eco Friendly Insulation Packaging Revenue (million) Forecast, by Application 2020 & 2033
- Table 34: North Africa Eco Friendly Insulation Packaging Revenue (million) Forecast, by Application 2020 & 2033
- Table 35: South Africa Eco Friendly Insulation Packaging Revenue (million) Forecast, by Application 2020 & 2033
- Table 36: Rest of Middle East & Africa Eco Friendly Insulation Packaging Revenue (million) Forecast, by Application 2020 & 2033
- Table 37: Global Eco Friendly Insulation Packaging Revenue million Forecast, by Application 2020 & 2033
- Table 38: Global Eco Friendly Insulation Packaging Revenue million Forecast, by Type 2020 & 2033
- Table 39: Global Eco Friendly Insulation Packaging Revenue million Forecast, by Country 2020 & 2033
- Table 40: China Eco Friendly Insulation Packaging Revenue (million) Forecast, by Application 2020 & 2033
- Table 41: India Eco Friendly Insulation Packaging Revenue (million) Forecast, by Application 2020 & 2033
- Table 42: Japan Eco Friendly Insulation Packaging Revenue (million) Forecast, by Application 2020 & 2033
- Table 43: South Korea Eco Friendly Insulation Packaging Revenue (million) Forecast, by Application 2020 & 2033
- Table 44: ASEAN Eco Friendly Insulation Packaging Revenue (million) Forecast, by Application 2020 & 2033
- Table 45: Oceania Eco Friendly Insulation Packaging Revenue (million) Forecast, by Application 2020 & 2033
- Table 46: Rest of Asia Pacific Eco Friendly Insulation Packaging Revenue (million) Forecast, by Application 2020 & 2033
Frequently Asked Questions
1. What is the projected Compound Annual Growth Rate (CAGR) of the Eco Friendly Insulation Packaging?
The projected CAGR is approximately XXX%.
2. Which companies are prominent players in the Eco Friendly Insulation Packaging?
Key companies in the market include Visy Industries, Insulated Products Corp, Woolcool, Orora Packaging Solutions, Abbe, Planet Protector, Pro-pac Packaging, Puffin Packaging, The Illuminate Group, Sealed Air, Thermologistics Group, Sancell, Cryolux Group, Pearl IcePearl Ice, KODIAKOOLER.
3. What are the main segments of the Eco Friendly Insulation Packaging?
The market segments include Application, Type.
4. Can you provide details about the market size?
The market size is estimated to be USD XXX million as of 2022.
5. What are some drivers contributing to market growth?
N/A
6. What are the notable trends driving market growth?
N/A
7. Are there any restraints impacting market growth?
N/A
8. Can you provide examples of recent developments in the market?
N/A
9. What pricing options are available for accessing the report?
Pricing options include single-user, multi-user, and enterprise licenses priced at USD 2900.00, USD 4350.00, and USD 5800.00 respectively.
10. Is the market size provided in terms of value or volume?
The market size is provided in terms of value, measured in million.
11. Are there any specific market keywords associated with the report?
Yes, the market keyword associated with the report is "Eco Friendly Insulation Packaging," which aids in identifying and referencing the specific market segment covered.
12. How do I determine which pricing option suits my needs best?
The pricing options vary based on user requirements and access needs. Individual users may opt for single-user licenses, while businesses requiring broader access may choose multi-user or enterprise licenses for cost-effective access to the report.
13. Are there any additional resources or data provided in the Eco Friendly Insulation Packaging report?
While the report offers comprehensive insights, it's advisable to review the specific contents or supplementary materials provided to ascertain if additional resources or data are available.
14. How can I stay updated on further developments or reports in the Eco Friendly Insulation Packaging?
To stay informed about further developments, trends, and reports in the Eco Friendly Insulation Packaging, consider subscribing to industry newsletters, following relevant companies and organizations, or regularly checking reputable industry news sources and publications.
Methodology
Step 1 - Identification of Relevant Samples Size from Population Database


Step 2 - Approaches for Defining Global Market Size (Value, Volume* & Price*)

Note*: In applicable scenarios
Step 3 - Data Sources
Primary Research
- Web Analytics
- Survey Reports
- Research Institute
- Latest Research Reports
- Opinion Leaders
Secondary Research
- Annual Reports
- White Paper
- Latest Press Release
- Industry Association
- Paid Database
- Investor Presentations

Step 4 - Data Triangulation
Involves using different sources of information in order to increase the validity of a study
These sources are likely to be stakeholders in a program - participants, other researchers, program staff, other community members, and so on.
Then we put all data in single framework & apply various statistical tools to find out the dynamic on the market.
During the analysis stage, feedback from the stakeholder groups would be compared to determine areas of agreement as well as areas of divergence