

Key Insights
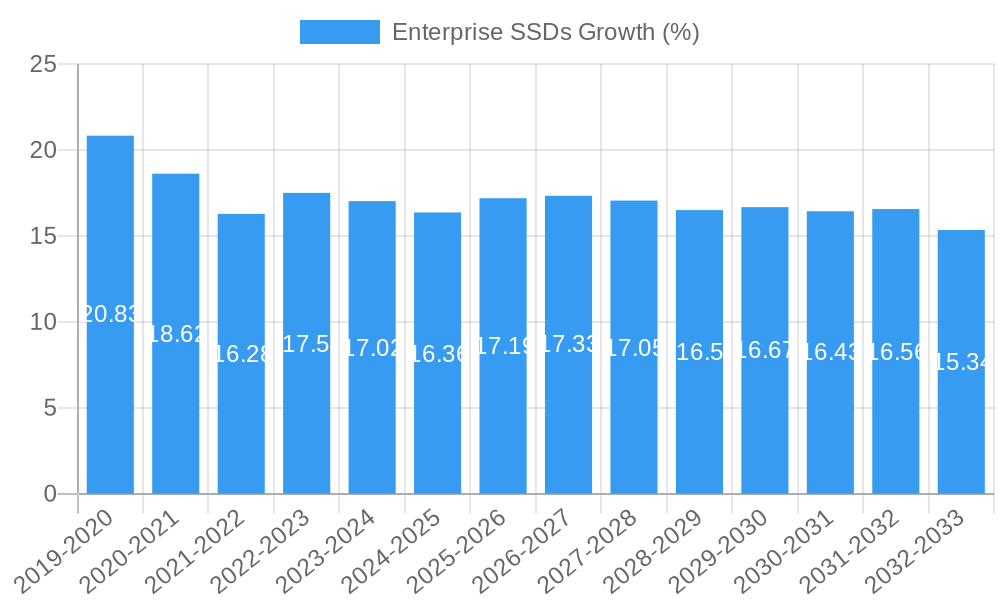
The Enterprise SSD market is poised for significant expansion, projected to reach an estimated $35,000 million by 2025 and grow at a compound annual growth rate (CAGR) of 18.5% through 2033. This robust growth is primarily fueled by the escalating demand for high-performance storage solutions within data centers, driven by the exponential increase in data generation from big data analytics, cloud computing, and AI workloads. The shift from traditional hard disk drives (HDDs) to Solid State Drives (SSDs) in enterprise environments is a pivotal trend, offering superior speed, lower latency, and improved power efficiency, essential for mission-critical applications and hyper-scale data centers. The adoption of NVMe interfaces further amplifies performance, enabling faster data access and processing, thereby unlocking new levels of efficiency for businesses.
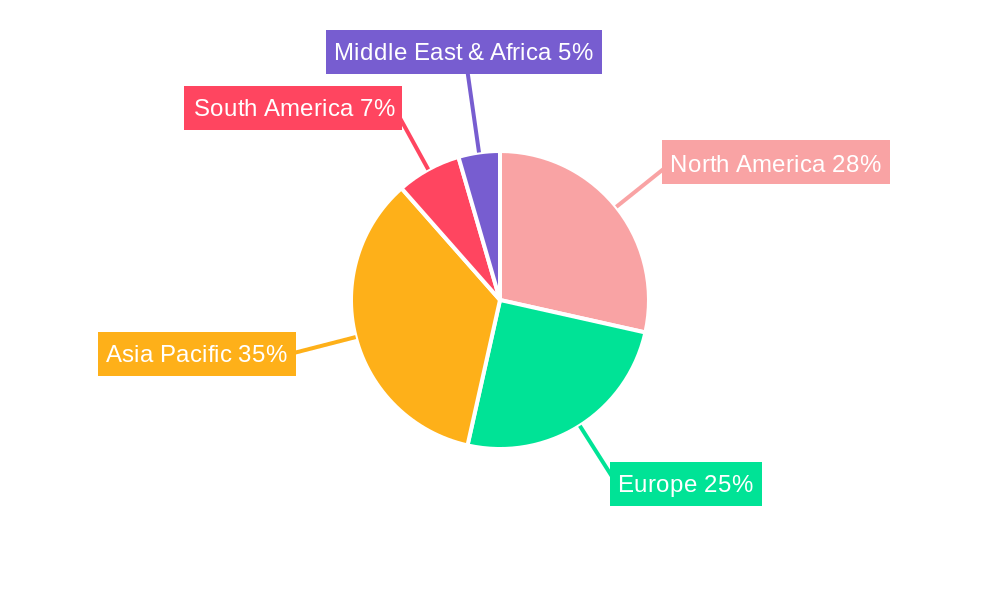
Key market drivers include the relentless pursuit of digital transformation, the burgeoning IoT landscape, and the increasing complexity of enterprise IT infrastructure. Emerging trends such as the adoption of QLC (Quad-Level Cell) NAND flash technology for cost-effective enterprise solutions, alongside the continued innovation in endurance and reliability of SLC (Single-Level Cell) and MLC (Multi-Level Cell) SSDs, are shaping the market. However, the market also faces restraints, including the relatively higher upfront cost of enterprise-grade SSDs compared to HDDs, and the evolving supply chain dynamics for NAND flash memory. Geographically, Asia Pacific is expected to dominate the market share due to the rapid digitalization and the presence of major technology manufacturing hubs, followed closely by North America and Europe, which are seeing substantial investments in data center infrastructure.
Enterprise SSDs Market Dynamics & Structure
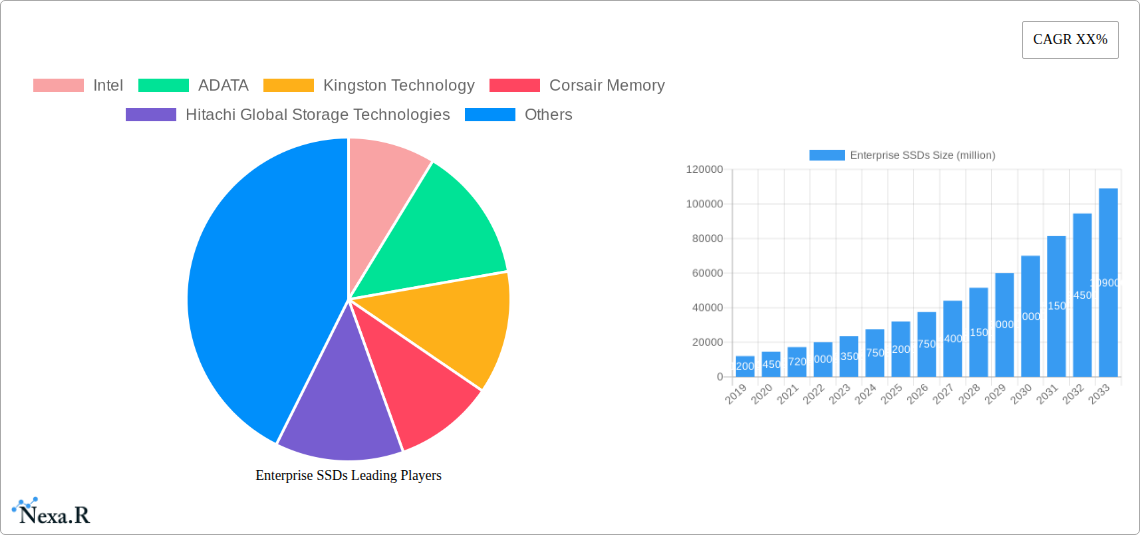
The enterprise Solid State Drive (SSD) market is characterized by moderate to high concentration, with a few dominant players, including Samsung, Micron Technology, Western Digital Corporation, and Intel, holding significant market shares. Technological innovation remains the primary driver, fueled by the relentless demand for faster data access, increased storage density, and enhanced power efficiency in data-intensive applications. Key innovations revolve around NAND flash advancements, controller technology, and PCIe interface evolution. Regulatory frameworks, particularly those concerning data security and privacy (e.g., GDPR, CCPA), indirectly influence SSD design and feature sets, driving the adoption of robust encryption and data integrity solutions. Competitive product substitutes, such as traditional Hard Disk Drives (HDDs), are steadily losing ground in performance-critical enterprise workloads, though they still hold a niche in archival storage due to cost per terabyte. End-user demographics are increasingly skewed towards hyperscale data centers, cloud service providers, and large enterprises with demanding IT infrastructures. Merger and acquisition (M&A) trends are likely to continue as larger players seek to consolidate market power and acquire specialized technologies. For instance, the acquisition of SanDisk by Western Digital Corporation in 2016 significantly reshaped the competitive landscape.
- Market Concentration: Dominated by a few key players, with a strong presence of global semiconductor manufacturers.
- Technological Innovation: Driven by NAND advancements, controller technology, and interface speeds (e.g., NVMe).
- Regulatory Influence: Focus on data security, encryption, and compliance standards.
- Competitive Landscape: Shift away from HDDs for performance workloads, but continued relevance for cost-sensitive archival storage.
- End-User Focus: Hyperscale data centers, cloud providers, and large enterprises.
- M&A Activity: Potential for further consolidation to gain market share and technological expertise.
Enterprise SSDs Growth Trends & Insights
The enterprise SSD market is poised for robust growth, driven by an insatiable demand for superior performance and efficiency across a multitude of business-critical applications. Market size evolution is expected to witness a significant upward trajectory, moving from approximately $30,000 million units in the historical period (2019–2024) to an estimated $50,000 million units in the base year 2025 and projecting a Compound Annual Growth Rate (CAGR) of 15% during the forecast period of 2025–2033. Adoption rates for enterprise SSDs, particularly in data centers, continue to surge as organizations recognize the tangible benefits of reduced latency, accelerated application performance, and improved operational efficiency. These adoption rates are climbing from around 60% in 2023 for primary storage in new deployments to an anticipated 85% by 2030 for mission-critical workloads. Technological disruptions are a constant feature, with advancements in NAND flash technology (e.g., QLC and PLC enabling higher densities at potentially lower costs), the widespread adoption of NVMe and NVMe-oF protocols, and the emergence of new form factors playing crucial roles. Consumer behavior shifts, or rather, enterprise IT decision-maker behavior, are characterized by a greater emphasis on Total Cost of Ownership (TCO) rather than just initial purchase price, with performance gains and energy savings factoring heavily into investment decisions. The penetration of enterprise SSDs into secondary and even tertiary storage tiers is also increasing as prices become more competitive.
The market penetration of enterprise SSDs for primary storage in data centers has steadily increased, moving from approximately 65% in 2020 to an estimated 80% by 2025. This trend is projected to continue, with SSDs becoming the de facto standard for all performance-sensitive workloads. In notebooks and tablets, enterprise-grade SSDs offer enhanced reliability and speed, contributing to a growing segment driven by mobile productivity needs. The market is also witnessing a shift towards higher capacity drives, with petabyte-scale SSDs becoming increasingly common in high-performance computing environments.
Technological disruptions, such as the ongoing development of new memory technologies beyond NAND flash, could further reshape the market in the long term, although NAND is expected to remain dominant through the forecast period. The proliferation of AI and machine learning workloads is a significant demand driver, requiring the rapid data ingest and processing capabilities that only SSDs can provide. Furthermore, the ongoing digital transformation initiatives across industries are necessitating more robust and performant storage solutions, directly benefiting the enterprise SSD market. The increasing adoption of hybrid cloud strategies also fuels demand, as organizations seek to balance cost and performance across on-premises and cloud environments.
Dominant Regions, Countries, or Segments in Enterprise SSDs
North America currently dominates the global enterprise SSD market, driven by its established technological infrastructure, significant investments in data centers, and a strong presence of leading cloud service providers. The United States, in particular, accounts for a substantial share of this regional dominance, estimated at 45% of the global market. Key drivers include aggressive spending on digital transformation initiatives, the rapid expansion of hyperscale data centers by tech giants like Google, Amazon, and Microsoft, and a supportive regulatory environment that encourages innovation and investment in advanced computing. The region's early adoption of cutting-edge technologies like NVMe and AI/ML workloads further solidifies its leading position.
In terms of application segments, Data Centers represent the most dominant force, accounting for an estimated 70% of the total enterprise SSD market revenue. This segment's growth is propelled by the exponential increase in data generation, the need for high-speed data access for analytics and AI, and the ongoing consolidation of IT infrastructure into cloud and on-premises data centers. The demand for enterprise SSDs in data centers is further amplified by the increasing adoption of virtualized environments and containerization technologies, which require rapid storage provisioning and high I/O performance.
The Types segment showcases a clear preference for TLC (Triple-Level Cell) NAND flash technology due to its balanced performance, endurance, and cost-effectiveness for most enterprise applications. While SLC (Single-Level Cell) remains critical for highly specialized, extremely demanding workloads, and MLC (Multi-Level Cell) is gradually being phased out in favor of TLC and QLC, TLC currently holds an estimated 60% market share within the enterprise SSD landscape. The continuous refinement of TLC technology, leading to improved endurance and performance, has made it the workhorse for a vast array of enterprise use cases.
- Dominant Region: North America (specifically the United States)
- Key Drivers:
- Extensive data center infrastructure and hyperscale cloud deployments.
- High investment in AI, machine learning, and big data analytics.
- Proactive adoption of new storage technologies.
- Supportive government policies and R&D funding.
- Key Drivers:
- Dominant Application Segment: Data Centers
- Key Drivers:
- Explosive data growth and the need for rapid data processing.
- Virtualization and cloud computing adoption.
- Performance demands of modern enterprise applications.
- Reduced latency for mission-critical operations.
- Key Drivers:
- Dominant SSD Type: TLC NAND Flash
- Key Drivers:
- Optimal balance of performance, endurance, and cost.
- Versatility for a wide range of enterprise workloads.
- Continuous technological improvements in density and reliability.
- Key Drivers:
Enterprise SSDs Product Landscape
The enterprise SSD product landscape is defined by relentless innovation aimed at delivering unparalleled performance, endurance, and efficiency. Products are engineered for high-volume, mission-critical workloads, featuring advanced controllers, robust error correction code (ECC) mechanisms, and sophisticated wear-leveling algorithms. NVMe interfaces, offering significantly lower latency and higher throughput compared to SATA, are now standard for most enterprise SSDs, especially those targeting data centers and high-performance computing. Notable advancements include the integration of QLC (Quad-Level Cell) NAND for increased storage density and cost-effectiveness in less demanding enterprise roles, alongside continued development in enterprise-grade TLC and even advanced SLC for ultra-high endurance applications. Performance metrics such as sequential read/write speeds exceeding 7,000 MB/s and random read/write IOPS reaching hundreds of thousands are common. Unique selling propositions often revolve around enhanced data integrity, power loss protection, and extended warranty periods, catering to the stringent reliability requirements of enterprise environments.
Key Drivers, Barriers & Challenges in Enterprise SSDs
The enterprise SSD market is propelled by several key drivers. The escalating demand for faster data processing in AI, machine learning, and big data analytics is a primary catalyst, necessitating the low latency and high throughput that SSDs offer. Digital transformation initiatives across industries, requiring modernized IT infrastructure, also fuel adoption. Furthermore, the increasing adoption of cloud computing and the expansion of hyperscale data centers are creating a massive market for high-performance storage solutions. Cost reductions in NAND flash manufacturing and the development of higher-density NAND technologies are making SSDs more economically viable for a wider range of enterprise applications.
Conversely, several barriers and challenges temper market growth. The higher initial purchase price of enterprise SSDs compared to traditional HDDs, especially for very large capacities, remains a significant hurdle for some organizations, particularly in cost-sensitive sectors or for archival purposes. Supply chain disruptions, exacerbated by geopolitical events and semiconductor shortages, can impact availability and pricing, creating uncertainty for procurement. Intense competition among manufacturers leads to pricing pressures, potentially affecting profit margins. Furthermore, the perceived complexity of integrating and managing NVMe SSDs in existing enterprise infrastructures can pose a challenge for some IT departments.
Emerging Opportunities in Enterprise SSDs
Emerging opportunities in the enterprise SSD market are diverse and promising. The continued growth of edge computing presents a significant avenue, as edge devices require robust, high-performance storage solutions capable of handling local data processing and analytics in demanding environments. The burgeoning Internet of Things (IoT) ecosystem, generating vast amounts of data, will necessitate high-capacity, high-speed storage for data aggregation and analysis at the edge and in central data centers. The increasing adoption of AI-powered applications across various industries, from healthcare to manufacturing, will drive demand for SSDs that can rapidly ingest and process massive datasets for training and inference. Furthermore, the development of new storage architectures, such as computational storage, which integrates processing capabilities directly into SSDs, offers a transformative opportunity to reduce data movement and improve overall system efficiency.
Growth Accelerators in the Enterprise SSDs Industry
Several factors are acting as growth accelerators for the enterprise SSD industry. The relentless advancement in NAND flash technology, enabling higher densities and improved endurance at decreasing costs, is a fundamental accelerator. The widespread standardization and adoption of the NVMe protocol, along with the development of NVMe-oF (NVMe over Fabrics), are significantly enhancing performance and scalability, making SSDs the preferred choice for data-intensive workloads. Strategic partnerships between SSD manufacturers, server vendors, and software developers are crucial for optimizing performance and fostering broader adoption. The increasing focus on sustainability within IT operations, where SSDs offer better power efficiency compared to HDDs, is also becoming a significant growth driver as organizations aim to reduce their carbon footprint.
Key Players Shaping the Enterprise SSDs Market
- Intel
- ADATA
- Kingston Technology
- Corsair Memory
- Hitachi Global Storage Technologies
- Seagate
- Micron Technology
- Samsung
- Toshiba Corp
- SanDisk
- Lenovo
- Netac
- Teclast
- Hewlett Packard
- Western Digital Corporation
Notable Milestones in Enterprise SSDs Sector
- 2019: Launch of PCIe 4.0 SSDs, significantly increasing bandwidth and performance for enterprise applications.
- 2020: Widespread adoption of NVMe protocol becomes standard in enterprise data centers, driving performance gains.
- 2021: Introduction of enterprise-grade QLC NAND flash, offering higher capacities at potentially lower costs for less demanding workloads.
- 2022: Increased investment in research and development of next-generation NAND technologies, such as PLC (Penta-Level Cell), promising further density improvements.
- 2023: Growing focus on computational storage solutions, integrating processing capabilities directly into SSDs to optimize data handling.
- 2024: Continued advancements in NVMe-oF (NVMe over Fabrics) enabling disaggregated storage and enhanced scalability in data centers.
In-Depth Enterprise SSDs Market Outlook
The enterprise SSD market is set for sustained high growth, propelled by the accelerating digital transformation across all sectors and the insatiable demand for faster data access. The continued evolution of AI, machine learning, and big data analytics will remain a primary demand driver, necessitating the low-latency, high-throughput capabilities offered by SSDs. Investments in hyperscale data centers and edge computing infrastructure will further solidify the market's expansion. Technological breakthroughs in NAND flash density and endurance, coupled with the ongoing optimization of NVMe and emerging protocols, will continue to enhance performance and cost-effectiveness. Strategic collaborations and market consolidation are expected to shape the competitive landscape, driving innovation and broader adoption of advanced SSD solutions. The outlook is exceptionally positive, with enterprise SSDs poised to become the ubiquitous storage solution for performance-critical workloads.
Enterprise SSDs Segmentation
-
1. Application
- 1.1. Data Centers
- 1.2. Desktop PCs
- 1.3. Notebooks/Tablets
-
2. Types
- 2.1. SLC
- 2.2. MLC
- 2.3. TLC
Enterprise SSDs Segmentation By Geography
-
1. North America
- 1.1. United States
- 1.2. Canada
- 1.3. Mexico
-
2. South America
- 2.1. Brazil
- 2.2. Argentina
- 2.3. Rest of South America
-
3. Europe
- 3.1. United Kingdom
- 3.2. Germany
- 3.3. France
- 3.4. Italy
- 3.5. Spain
- 3.6. Russia
- 3.7. Benelux
- 3.8. Nordics
- 3.9. Rest of Europe
-
4. Middle East & Africa
- 4.1. Turkey
- 4.2. Israel
- 4.3. GCC
- 4.4. North Africa
- 4.5. South Africa
- 4.6. Rest of Middle East & Africa
-
5. Asia Pacific
- 5.1. China
- 5.2. India
- 5.3. Japan
- 5.4. South Korea
- 5.5. ASEAN
- 5.6. Oceania
- 5.7. Rest of Asia Pacific
Enterprise SSDs REPORT HIGHLIGHTS
| Aspects | Details |
|---|---|
| Study Period | 2019-2033 |
| Base Year | 2024 |
| Estimated Year | 2025 |
| Forecast Period | 2025-2033 |
| Historical Period | 2019-2024 |
| Growth Rate | CAGR of XX% from 2019-2033 |
| Segmentation |
|
Table of Contents
- 1. Introduction
- 1.1. Research Scope
- 1.2. Market Segmentation
- 1.3. Research Methodology
- 1.4. Definitions and Assumptions
- 2. Executive Summary
- 2.1. Introduction
- 3. Market Dynamics
- 3.1. Introduction
- 3.2. Market Drivers
- 3.3. Market Restrains
- 3.4. Market Trends
- 4. Market Factor Analysis
- 4.1. Porters Five Forces
- 4.2. Supply/Value Chain
- 4.3. PESTEL analysis
- 4.4. Market Entropy
- 4.5. Patent/Trademark Analysis
- 5. Global Enterprise SSDs Analysis, Insights and Forecast, 2019-2031
- 5.1. Market Analysis, Insights and Forecast - by Application
- 5.1.1. Data Centers
- 5.1.2. Desktop PCs
- 5.1.3. Notebooks/Tablets
- 5.2. Market Analysis, Insights and Forecast - by Types
- 5.2.1. SLC
- 5.2.2. MLC
- 5.2.3. TLC
- 5.3. Market Analysis, Insights and Forecast - by Region
- 5.3.1. North America
- 5.3.2. South America
- 5.3.3. Europe
- 5.3.4. Middle East & Africa
- 5.3.5. Asia Pacific
- 5.1. Market Analysis, Insights and Forecast - by Application
- 6. North America Enterprise SSDs Analysis, Insights and Forecast, 2019-2031
- 6.1. Market Analysis, Insights and Forecast - by Application
- 6.1.1. Data Centers
- 6.1.2. Desktop PCs
- 6.1.3. Notebooks/Tablets
- 6.2. Market Analysis, Insights and Forecast - by Types
- 6.2.1. SLC
- 6.2.2. MLC
- 6.2.3. TLC
- 6.1. Market Analysis, Insights and Forecast - by Application
- 7. South America Enterprise SSDs Analysis, Insights and Forecast, 2019-2031
- 7.1. Market Analysis, Insights and Forecast - by Application
- 7.1.1. Data Centers
- 7.1.2. Desktop PCs
- 7.1.3. Notebooks/Tablets
- 7.2. Market Analysis, Insights and Forecast - by Types
- 7.2.1. SLC
- 7.2.2. MLC
- 7.2.3. TLC
- 7.1. Market Analysis, Insights and Forecast - by Application
- 8. Europe Enterprise SSDs Analysis, Insights and Forecast, 2019-2031
- 8.1. Market Analysis, Insights and Forecast - by Application
- 8.1.1. Data Centers
- 8.1.2. Desktop PCs
- 8.1.3. Notebooks/Tablets
- 8.2. Market Analysis, Insights and Forecast - by Types
- 8.2.1. SLC
- 8.2.2. MLC
- 8.2.3. TLC
- 8.1. Market Analysis, Insights and Forecast - by Application
- 9. Middle East & Africa Enterprise SSDs Analysis, Insights and Forecast, 2019-2031
- 9.1. Market Analysis, Insights and Forecast - by Application
- 9.1.1. Data Centers
- 9.1.2. Desktop PCs
- 9.1.3. Notebooks/Tablets
- 9.2. Market Analysis, Insights and Forecast - by Types
- 9.2.1. SLC
- 9.2.2. MLC
- 9.2.3. TLC
- 9.1. Market Analysis, Insights and Forecast - by Application
- 10. Asia Pacific Enterprise SSDs Analysis, Insights and Forecast, 2019-2031
- 10.1. Market Analysis, Insights and Forecast - by Application
- 10.1.1. Data Centers
- 10.1.2. Desktop PCs
- 10.1.3. Notebooks/Tablets
- 10.2. Market Analysis, Insights and Forecast - by Types
- 10.2.1. SLC
- 10.2.2. MLC
- 10.2.3. TLC
- 10.1. Market Analysis, Insights and Forecast - by Application
- 11. Competitive Analysis
- 11.1. Global Market Share Analysis 2024
- 11.2. Company Profiles
- 11.2.1 Intel
- 11.2.1.1. Overview
- 11.2.1.2. Products
- 11.2.1.3. SWOT Analysis
- 11.2.1.4. Recent Developments
- 11.2.1.5. Financials (Based on Availability)
- 11.2.2 ADATA
- 11.2.2.1. Overview
- 11.2.2.2. Products
- 11.2.2.3. SWOT Analysis
- 11.2.2.4. Recent Developments
- 11.2.2.5. Financials (Based on Availability)
- 11.2.3 Kingston Technology
- 11.2.3.1. Overview
- 11.2.3.2. Products
- 11.2.3.3. SWOT Analysis
- 11.2.3.4. Recent Developments
- 11.2.3.5. Financials (Based on Availability)
- 11.2.4 Corsair Memory
- 11.2.4.1. Overview
- 11.2.4.2. Products
- 11.2.4.3. SWOT Analysis
- 11.2.4.4. Recent Developments
- 11.2.4.5. Financials (Based on Availability)
- 11.2.5 Hitachi Global Storage Technologies
- 11.2.5.1. Overview
- 11.2.5.2. Products
- 11.2.5.3. SWOT Analysis
- 11.2.5.4. Recent Developments
- 11.2.5.5. Financials (Based on Availability)
- 11.2.6 Seagate
- 11.2.6.1. Overview
- 11.2.6.2. Products
- 11.2.6.3. SWOT Analysis
- 11.2.6.4. Recent Developments
- 11.2.6.5. Financials (Based on Availability)
- 11.2.7 Micron Technology
- 11.2.7.1. Overview
- 11.2.7.2. Products
- 11.2.7.3. SWOT Analysis
- 11.2.7.4. Recent Developments
- 11.2.7.5. Financials (Based on Availability)
- 11.2.8 Samsung
- 11.2.8.1. Overview
- 11.2.8.2. Products
- 11.2.8.3. SWOT Analysis
- 11.2.8.4. Recent Developments
- 11.2.8.5. Financials (Based on Availability)
- 11.2.9 Toshiba Corp
- 11.2.9.1. Overview
- 11.2.9.2. Products
- 11.2.9.3. SWOT Analysis
- 11.2.9.4. Recent Developments
- 11.2.9.5. Financials (Based on Availability)
- 11.2.10 SanDisk
- 11.2.10.1. Overview
- 11.2.10.2. Products
- 11.2.10.3. SWOT Analysis
- 11.2.10.4. Recent Developments
- 11.2.10.5. Financials (Based on Availability)
- 11.2.11 Lenovo
- 11.2.11.1. Overview
- 11.2.11.2. Products
- 11.2.11.3. SWOT Analysis
- 11.2.11.4. Recent Developments
- 11.2.11.5. Financials (Based on Availability)
- 11.2.12 Netac
- 11.2.12.1. Overview
- 11.2.12.2. Products
- 11.2.12.3. SWOT Analysis
- 11.2.12.4. Recent Developments
- 11.2.12.5. Financials (Based on Availability)
- 11.2.13 Teclast
- 11.2.13.1. Overview
- 11.2.13.2. Products
- 11.2.13.3. SWOT Analysis
- 11.2.13.4. Recent Developments
- 11.2.13.5. Financials (Based on Availability)
- 11.2.14 Hewlett Packard
- 11.2.14.1. Overview
- 11.2.14.2. Products
- 11.2.14.3. SWOT Analysis
- 11.2.14.4. Recent Developments
- 11.2.14.5. Financials (Based on Availability)
- 11.2.15 Western Digital Corporation
- 11.2.15.1. Overview
- 11.2.15.2. Products
- 11.2.15.3. SWOT Analysis
- 11.2.15.4. Recent Developments
- 11.2.15.5. Financials (Based on Availability)
- 11.2.1 Intel
List of Figures
- Figure 1: Global Enterprise SSDs Revenue Breakdown (million, %) by Region 2024 & 2032
- Figure 2: North America Enterprise SSDs Revenue (million), by Application 2024 & 2032
- Figure 3: North America Enterprise SSDs Revenue Share (%), by Application 2024 & 2032
- Figure 4: North America Enterprise SSDs Revenue (million), by Types 2024 & 2032
- Figure 5: North America Enterprise SSDs Revenue Share (%), by Types 2024 & 2032
- Figure 6: North America Enterprise SSDs Revenue (million), by Country 2024 & 2032
- Figure 7: North America Enterprise SSDs Revenue Share (%), by Country 2024 & 2032
- Figure 8: South America Enterprise SSDs Revenue (million), by Application 2024 & 2032
- Figure 9: South America Enterprise SSDs Revenue Share (%), by Application 2024 & 2032
- Figure 10: South America Enterprise SSDs Revenue (million), by Types 2024 & 2032
- Figure 11: South America Enterprise SSDs Revenue Share (%), by Types 2024 & 2032
- Figure 12: South America Enterprise SSDs Revenue (million), by Country 2024 & 2032
- Figure 13: South America Enterprise SSDs Revenue Share (%), by Country 2024 & 2032
- Figure 14: Europe Enterprise SSDs Revenue (million), by Application 2024 & 2032
- Figure 15: Europe Enterprise SSDs Revenue Share (%), by Application 2024 & 2032
- Figure 16: Europe Enterprise SSDs Revenue (million), by Types 2024 & 2032
- Figure 17: Europe Enterprise SSDs Revenue Share (%), by Types 2024 & 2032
- Figure 18: Europe Enterprise SSDs Revenue (million), by Country 2024 & 2032
- Figure 19: Europe Enterprise SSDs Revenue Share (%), by Country 2024 & 2032
- Figure 20: Middle East & Africa Enterprise SSDs Revenue (million), by Application 2024 & 2032
- Figure 21: Middle East & Africa Enterprise SSDs Revenue Share (%), by Application 2024 & 2032
- Figure 22: Middle East & Africa Enterprise SSDs Revenue (million), by Types 2024 & 2032
- Figure 23: Middle East & Africa Enterprise SSDs Revenue Share (%), by Types 2024 & 2032
- Figure 24: Middle East & Africa Enterprise SSDs Revenue (million), by Country 2024 & 2032
- Figure 25: Middle East & Africa Enterprise SSDs Revenue Share (%), by Country 2024 & 2032
- Figure 26: Asia Pacific Enterprise SSDs Revenue (million), by Application 2024 & 2032
- Figure 27: Asia Pacific Enterprise SSDs Revenue Share (%), by Application 2024 & 2032
- Figure 28: Asia Pacific Enterprise SSDs Revenue (million), by Types 2024 & 2032
- Figure 29: Asia Pacific Enterprise SSDs Revenue Share (%), by Types 2024 & 2032
- Figure 30: Asia Pacific Enterprise SSDs Revenue (million), by Country 2024 & 2032
- Figure 31: Asia Pacific Enterprise SSDs Revenue Share (%), by Country 2024 & 2032
List of Tables
- Table 1: Global Enterprise SSDs Revenue million Forecast, by Region 2019 & 2032
- Table 2: Global Enterprise SSDs Revenue million Forecast, by Application 2019 & 2032
- Table 3: Global Enterprise SSDs Revenue million Forecast, by Types 2019 & 2032
- Table 4: Global Enterprise SSDs Revenue million Forecast, by Region 2019 & 2032
- Table 5: Global Enterprise SSDs Revenue million Forecast, by Application 2019 & 2032
- Table 6: Global Enterprise SSDs Revenue million Forecast, by Types 2019 & 2032
- Table 7: Global Enterprise SSDs Revenue million Forecast, by Country 2019 & 2032
- Table 8: United States Enterprise SSDs Revenue (million) Forecast, by Application 2019 & 2032
- Table 9: Canada Enterprise SSDs Revenue (million) Forecast, by Application 2019 & 2032
- Table 10: Mexico Enterprise SSDs Revenue (million) Forecast, by Application 2019 & 2032
- Table 11: Global Enterprise SSDs Revenue million Forecast, by Application 2019 & 2032
- Table 12: Global Enterprise SSDs Revenue million Forecast, by Types 2019 & 2032
- Table 13: Global Enterprise SSDs Revenue million Forecast, by Country 2019 & 2032
- Table 14: Brazil Enterprise SSDs Revenue (million) Forecast, by Application 2019 & 2032
- Table 15: Argentina Enterprise SSDs Revenue (million) Forecast, by Application 2019 & 2032
- Table 16: Rest of South America Enterprise SSDs Revenue (million) Forecast, by Application 2019 & 2032
- Table 17: Global Enterprise SSDs Revenue million Forecast, by Application 2019 & 2032
- Table 18: Global Enterprise SSDs Revenue million Forecast, by Types 2019 & 2032
- Table 19: Global Enterprise SSDs Revenue million Forecast, by Country 2019 & 2032
- Table 20: United Kingdom Enterprise SSDs Revenue (million) Forecast, by Application 2019 & 2032
- Table 21: Germany Enterprise SSDs Revenue (million) Forecast, by Application 2019 & 2032
- Table 22: France Enterprise SSDs Revenue (million) Forecast, by Application 2019 & 2032
- Table 23: Italy Enterprise SSDs Revenue (million) Forecast, by Application 2019 & 2032
- Table 24: Spain Enterprise SSDs Revenue (million) Forecast, by Application 2019 & 2032
- Table 25: Russia Enterprise SSDs Revenue (million) Forecast, by Application 2019 & 2032
- Table 26: Benelux Enterprise SSDs Revenue (million) Forecast, by Application 2019 & 2032
- Table 27: Nordics Enterprise SSDs Revenue (million) Forecast, by Application 2019 & 2032
- Table 28: Rest of Europe Enterprise SSDs Revenue (million) Forecast, by Application 2019 & 2032
- Table 29: Global Enterprise SSDs Revenue million Forecast, by Application 2019 & 2032
- Table 30: Global Enterprise SSDs Revenue million Forecast, by Types 2019 & 2032
- Table 31: Global Enterprise SSDs Revenue million Forecast, by Country 2019 & 2032
- Table 32: Turkey Enterprise SSDs Revenue (million) Forecast, by Application 2019 & 2032
- Table 33: Israel Enterprise SSDs Revenue (million) Forecast, by Application 2019 & 2032
- Table 34: GCC Enterprise SSDs Revenue (million) Forecast, by Application 2019 & 2032
- Table 35: North Africa Enterprise SSDs Revenue (million) Forecast, by Application 2019 & 2032
- Table 36: South Africa Enterprise SSDs Revenue (million) Forecast, by Application 2019 & 2032
- Table 37: Rest of Middle East & Africa Enterprise SSDs Revenue (million) Forecast, by Application 2019 & 2032
- Table 38: Global Enterprise SSDs Revenue million Forecast, by Application 2019 & 2032
- Table 39: Global Enterprise SSDs Revenue million Forecast, by Types 2019 & 2032
- Table 40: Global Enterprise SSDs Revenue million Forecast, by Country 2019 & 2032
- Table 41: China Enterprise SSDs Revenue (million) Forecast, by Application 2019 & 2032
- Table 42: India Enterprise SSDs Revenue (million) Forecast, by Application 2019 & 2032
- Table 43: Japan Enterprise SSDs Revenue (million) Forecast, by Application 2019 & 2032
- Table 44: South Korea Enterprise SSDs Revenue (million) Forecast, by Application 2019 & 2032
- Table 45: ASEAN Enterprise SSDs Revenue (million) Forecast, by Application 2019 & 2032
- Table 46: Oceania Enterprise SSDs Revenue (million) Forecast, by Application 2019 & 2032
- Table 47: Rest of Asia Pacific Enterprise SSDs Revenue (million) Forecast, by Application 2019 & 2032
Frequently Asked Questions
1. What is the projected Compound Annual Growth Rate (CAGR) of the Enterprise SSDs?
The projected CAGR is approximately XX%.
2. Which companies are prominent players in the Enterprise SSDs?
Key companies in the market include Intel, ADATA, Kingston Technology, Corsair Memory, Hitachi Global Storage Technologies, Seagate, Micron Technology, Samsung, Toshiba Corp, SanDisk, Lenovo, Netac, Teclast, Hewlett Packard, Western Digital Corporation.
3. What are the main segments of the Enterprise SSDs?
The market segments include Application, Types.
4. Can you provide details about the market size?
The market size is estimated to be USD XXX million as of 2022.
5. What are some drivers contributing to market growth?
N/A
6. What are the notable trends driving market growth?
N/A
7. Are there any restraints impacting market growth?
N/A
8. Can you provide examples of recent developments in the market?
N/A
9. What pricing options are available for accessing the report?
Pricing options include single-user, multi-user, and enterprise licenses priced at USD 4900.00, USD 7350.00, and USD 9800.00 respectively.
10. Is the market size provided in terms of value or volume?
The market size is provided in terms of value, measured in million.
11. Are there any specific market keywords associated with the report?
Yes, the market keyword associated with the report is "Enterprise SSDs," which aids in identifying and referencing the specific market segment covered.
12. How do I determine which pricing option suits my needs best?
The pricing options vary based on user requirements and access needs. Individual users may opt for single-user licenses, while businesses requiring broader access may choose multi-user or enterprise licenses for cost-effective access to the report.
13. Are there any additional resources or data provided in the Enterprise SSDs report?
While the report offers comprehensive insights, it's advisable to review the specific contents or supplementary materials provided to ascertain if additional resources or data are available.
14. How can I stay updated on further developments or reports in the Enterprise SSDs?
To stay informed about further developments, trends, and reports in the Enterprise SSDs, consider subscribing to industry newsletters, following relevant companies and organizations, or regularly checking reputable industry news sources and publications.
Methodology
Step 1 - Identification of Relevant Samples Size from Population Database


Step 2 - Approaches for Defining Global Market Size (Value, Volume* & Price*)

Note*: In applicable scenarios
Step 3 - Data Sources
Primary Research
- Web Analytics
- Survey Reports
- Research Institute
- Latest Research Reports
- Opinion Leaders
Secondary Research
- Annual Reports
- White Paper
- Latest Press Release
- Industry Association
- Paid Database
- Investor Presentations

Step 4 - Data Triangulation
Involves using different sources of information in order to increase the validity of a study
These sources are likely to be stakeholders in a program - participants, other researchers, program staff, other community members, and so on.
Then we put all data in single framework & apply various statistical tools to find out the dynamic on the market.
During the analysis stage, feedback from the stakeholder groups would be compared to determine areas of agreement as well as areas of divergence
