

Key Insights
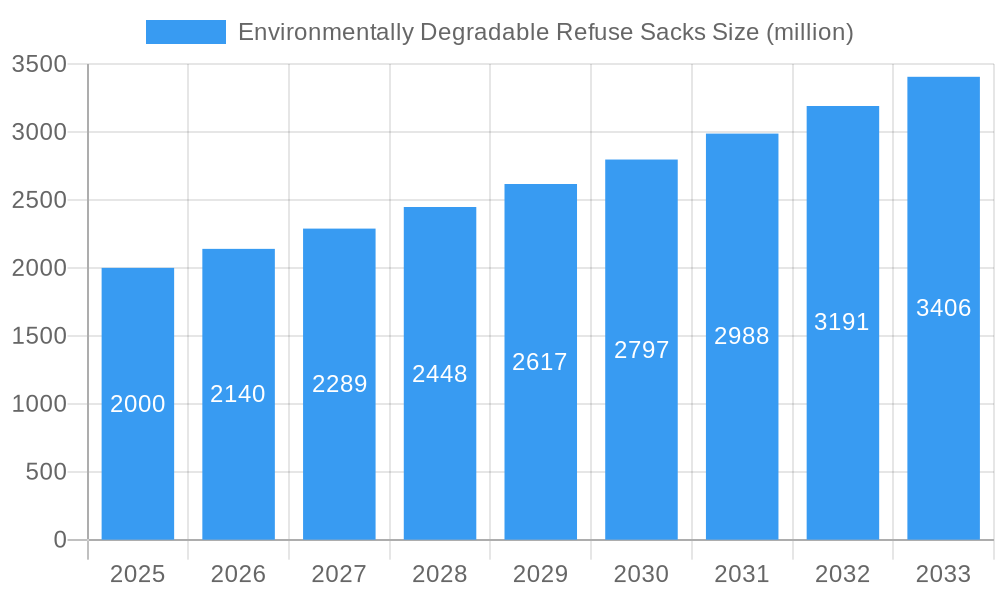
The market for environmentally degradable refuse sacks is experiencing robust growth, driven by escalating environmental concerns, stringent government regulations targeting plastic waste, and a rising consumer preference for sustainable alternatives. The market, currently valued at an estimated $2 billion in 2025, is projected to exhibit a Compound Annual Growth Rate (CAGR) of 7% from 2025 to 2033, reaching an estimated $3.5 billion by 2033. Key drivers include the increasing awareness of plastic pollution's harmful effects on ecosystems and the subsequent demand for eco-friendly waste disposal solutions. Furthermore, several governments are implementing policies that incentivize or mandate the use of biodegradable and compostable materials, further propelling market expansion. Trends indicate a shift towards oxo-degradable and bio-based polymers, offering improved degradation properties compared to traditional plastic alternatives. However, the relatively higher cost of these environmentally friendly refuse sacks compared to conventional plastic bags remains a significant restraint, limiting widespread adoption, particularly in price-sensitive markets. Segmentation within the market encompasses various sack sizes, materials (e.g., PLA, PBAT, starch-based blends), and end-use applications (household, commercial, industrial). Leading players such as Berry Global Group, Clorox, and others are actively investing in research and development to improve the performance and reduce the cost of these products, paving the way for broader market penetration.
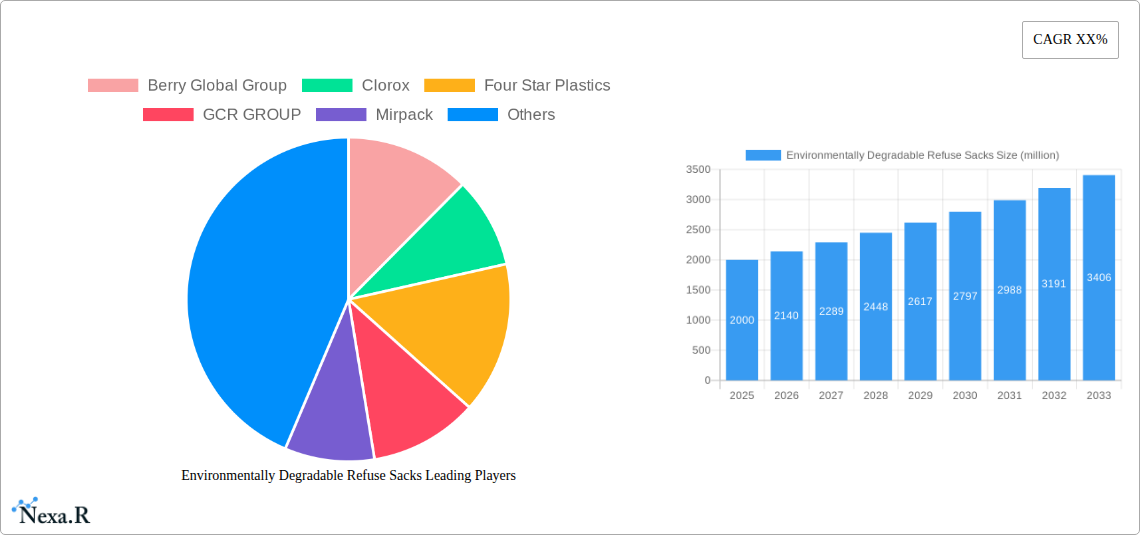
Environmentally Degradable Refuse Sacks Market Size (In Billion)
The competitive landscape is characterized by both established players and emerging companies vying for market share through product innovation, strategic partnerships, and geographic expansion. The regional distribution shows significant growth in North America and Europe, driven by strong environmental regulations and consumer awareness. Asia-Pacific is expected to witness significant growth in the coming years, fueled by increasing urbanization and rising disposable incomes. However, challenges remain, including the need for standardized testing and certification processes to ensure the genuine biodegradability of these products and addressing concerns about the efficacy of degradation under various environmental conditions. Future growth will heavily rely on technological advancements in biopolymer production, improved infrastructure for composting and recycling, and effective consumer education campaigns highlighting the benefits of switching to environmentally degradable refuse sacks.
Environmentally Degradable Refuse Sacks Company Market Share
Environmentally Degradable Refuse Sacks Market Report: 2019-2033
This comprehensive report provides a detailed analysis of the environmentally degradable refuse sacks market, encompassing market dynamics, growth trends, regional insights, product landscape, and key players. The study period covers 2019-2033, with 2025 as the base and estimated year. This report is crucial for businesses in the parent market of Packaging and the child market of Sustainable Packaging seeking to understand this evolving landscape and capitalize on emerging opportunities. The market is projected to reach xx million units by 2033.
Environmentally Degradable Refuse Sacks Market Dynamics & Structure
This section analyzes the competitive landscape, technological advancements, regulatory influences, and market trends within the environmentally degradable refuse sacks industry. The market is characterized by moderate concentration, with key players holding significant shares, but also presenting opportunities for new entrants with innovative offerings.
- Market Concentration: The top 5 players (Berry Global Group, Clorox, Four Star Plastics, GCR GROUP, Mirpack) account for approximately xx% of the market share in 2025.
- Technological Innovation: Advancements in bioplastics and compostable polymers are key drivers, however, challenges remain in achieving cost parity with traditional plastics and ensuring complete biodegradability under various environmental conditions.
- Regulatory Frameworks: Government regulations promoting sustainable waste management and reducing plastic pollution are significantly influencing market growth. The implementation of plastic taxes and bans in several regions is accelerating the adoption of environmentally degradable alternatives.
- Competitive Product Substitutes: Recycled plastic bags and reusable bags pose competitive challenges, but the focus on complete biodegradability and compostability provides a unique selling proposition for environmentally degradable refuse sacks.
- End-User Demographics: The primary end-users are households, commercial establishments, and municipalities increasingly prioritizing eco-friendly waste disposal solutions.
- M&A Trends: The number of M&A deals in this sector increased by xx% from 2021 to 2024, reflecting growing industry consolidation and investment in sustainable packaging solutions.
Environmentally Degradable Refuse Sacks Growth Trends & Insights
The environmentally degradable refuse sacks market has experienced significant growth, driven by rising environmental awareness, stricter regulations, and the increasing demand for sustainable packaging solutions. The historical period (2019-2024) saw a CAGR of xx%, and this positive trajectory is expected to continue. The market size is projected to reach xx million units in 2025 and xx million units by 2033, exhibiting a CAGR of xx% during the forecast period (2025-2033). Market penetration has increased from xx% in 2019 to xx% in 2025, indicating strong adoption rates. Consumer behavior is shifting towards environmentally conscious choices, with a growing preference for biodegradable and compostable alternatives to conventional plastic bags. Technological advancements, particularly in biopolymer technology, are further accelerating market growth.
Dominant Regions, Countries, or Segments in Environmentally Degradable Refuse Sacks
Europe and North America are currently the leading regions for the environmentally degradable refuse sacks market, driven by stringent environmental regulations and high consumer awareness. However, Asia-Pacific is expected to witness the fastest growth, spurred by increasing disposable incomes, urbanization, and rising environmental concerns.
- Key Drivers in Europe: Stringent regulations on plastic waste, high environmental consciousness among consumers, and well-established recycling infrastructure.
- Key Drivers in North America: Growing awareness of environmental issues, increased demand for sustainable packaging from both businesses and consumers, and government support for eco-friendly initiatives.
- Key Drivers in Asia-Pacific: Rapid economic growth, rising urbanization leading to increased waste generation, and government initiatives promoting sustainable waste management.
Market share is currently dominated by Europe (xx%), followed by North America (xx%) and Asia-Pacific (xx%). However, Asia-Pacific is projected to experience the highest growth rate, potentially surpassing North America in market share by 2033.
Environmentally Degradable Refuse Sacks Product Landscape
The market offers a range of products with varying biodegradability rates and compostability characteristics. Innovations focus on enhanced strength, durability, and leak resistance, while maintaining the environmental benefits. Oxodegradable and compostable polymers are commonly used, with ongoing research aimed at improving material properties and reducing production costs. Unique selling propositions often highlight certified compostability, reduced environmental impact, and enhanced performance compared to traditional plastic bags.
Key Drivers, Barriers & Challenges in Environmentally Degradable Refuse Sacks
Key Drivers:
- Growing environmental concerns: Increased awareness of plastic pollution and its impact on the environment is driving demand.
- Stricter environmental regulations: Government policies promoting sustainable waste management and reducing plastic consumption are boosting market growth.
- Technological advancements: Innovations in bioplastics and compostable materials are improving the performance and cost-effectiveness of environmentally degradable refuse sacks.
Key Challenges:
- Higher production costs: Biodegradable and compostable materials are currently more expensive to produce than conventional plastics, limiting market penetration.
- Infrastructure limitations: The lack of widespread composting infrastructure in many regions hinders the complete lifecycle benefits of compostable bags.
- Consumer perception: Some consumers remain skeptical about the effectiveness of biodegradable and compostable materials. The supply chain faces challenges in ensuring consistent quality and timely delivery.
Emerging Opportunities in Environmentally Degradable Refuse Sacks
- Untapped markets: Expanding into developing economies with growing waste generation presents significant growth potential.
- Innovative applications: Exploring new applications for biodegradable materials beyond refuse sacks, such as in agricultural mulch films, creates diverse revenue streams.
- Evolving consumer preferences: Catering to the growing demand for sustainable and ethically sourced products allows for premium pricing strategies.
Growth Accelerators in the Environmentally Degradable Refuse Sacks Industry
Technological breakthroughs in bioplastic production, particularly reducing costs and improving performance, are key growth accelerators. Strategic partnerships between producers, retailers, and waste management companies can facilitate wider adoption and improve infrastructure. Market expansion strategies focusing on emerging economies and untapped market segments, combined with effective marketing highlighting environmental benefits, will propel future growth.
Key Players Shaping the Environmentally Degradable Refuse Sacks Market
- Berry Global Group
- Clorox
- Four Star Plastics
- GCR GROUP
- Mirpack
- International Plastics
- Terdex
- Plascon Group
- Plastiroll
- Futamura
Notable Milestones in Environmentally Degradable Refuse Sacks Sector
- 2020: Several European countries implement stricter regulations on single-use plastics.
- 2021: Major packaging companies announce significant investments in biodegradable and compostable materials research.
- 2022: Several new compostable refuse sack products are launched, emphasizing superior performance and certifications.
- 2023: A large-scale partnership is formed between a major waste management company and a bioplastic producer to boost infrastructure development.
In-Depth Environmentally Degradable Refuse Sacks Market Outlook
The future of the environmentally degradable refuse sacks market is bright, driven by sustained growth in demand fueled by rising environmental awareness, increasing regulatory pressure, and ongoing technological advancements. Strategic partnerships, coupled with investments in infrastructure and marketing, will be crucial for realizing the full potential of this market. The focus on complete biodegradability and compostability, along with addressing cost parity with traditional plastics, will shape the industry's future trajectory.
Environmentally Degradable Refuse Sacks Segmentation
-
1. Application
- 1.1. Commercial Use
- 1.2. Home Use
-
2. Types
- 2.1. Biodegradable Materials
- 2.2. Photodegradable Materials
Environmentally Degradable Refuse Sacks Segmentation By Geography
-
1. North America
- 1.1. United States
- 1.2. Canada
- 1.3. Mexico
-
2. South America
- 2.1. Brazil
- 2.2. Argentina
- 2.3. Rest of South America
-
3. Europe
- 3.1. United Kingdom
- 3.2. Germany
- 3.3. France
- 3.4. Italy
- 3.5. Spain
- 3.6. Russia
- 3.7. Benelux
- 3.8. Nordics
- 3.9. Rest of Europe
-
4. Middle East & Africa
- 4.1. Turkey
- 4.2. Israel
- 4.3. GCC
- 4.4. North Africa
- 4.5. South Africa
- 4.6. Rest of Middle East & Africa
-
5. Asia Pacific
- 5.1. China
- 5.2. India
- 5.3. Japan
- 5.4. South Korea
- 5.5. ASEAN
- 5.6. Oceania
- 5.7. Rest of Asia Pacific

Environmentally Degradable Refuse Sacks Regional Market Share
Geographic Coverage of Environmentally Degradable Refuse Sacks
Environmentally Degradable Refuse Sacks REPORT HIGHLIGHTS
| Aspects | Details |
|---|---|
| Study Period | 2020-2034 |
| Base Year | 2025 |
| Estimated Year | 2026 |
| Forecast Period | 2026-2034 |
| Historical Period | 2020-2025 |
| Growth Rate | CAGR of XX% from 2020-2034 |
| Segmentation |
|
Table of Contents
- 1. Introduction
- 1.1. Research Scope
- 1.2. Market Segmentation
- 1.3. Research Methodology
- 1.4. Definitions and Assumptions
- 2. Executive Summary
- 2.1. Introduction
- 3. Market Dynamics
- 3.1. Introduction
- 3.2. Market Drivers
- 3.3. Market Restrains
- 3.4. Market Trends
- 4. Market Factor Analysis
- 4.1. Porters Five Forces
- 4.2. Supply/Value Chain
- 4.3. PESTEL analysis
- 4.4. Market Entropy
- 4.5. Patent/Trademark Analysis
- 5. Global Environmentally Degradable Refuse Sacks Analysis, Insights and Forecast, 2020-2032
- 5.1. Market Analysis, Insights and Forecast - by Application
- 5.1.1. Commercial Use
- 5.1.2. Home Use
- 5.2. Market Analysis, Insights and Forecast - by Types
- 5.2.1. Biodegradable Materials
- 5.2.2. Photodegradable Materials
- 5.3. Market Analysis, Insights and Forecast - by Region
- 5.3.1. North America
- 5.3.2. South America
- 5.3.3. Europe
- 5.3.4. Middle East & Africa
- 5.3.5. Asia Pacific
- 5.1. Market Analysis, Insights and Forecast - by Application
- 6. North America Environmentally Degradable Refuse Sacks Analysis, Insights and Forecast, 2020-2032
- 6.1. Market Analysis, Insights and Forecast - by Application
- 6.1.1. Commercial Use
- 6.1.2. Home Use
- 6.2. Market Analysis, Insights and Forecast - by Types
- 6.2.1. Biodegradable Materials
- 6.2.2. Photodegradable Materials
- 6.1. Market Analysis, Insights and Forecast - by Application
- 7. South America Environmentally Degradable Refuse Sacks Analysis, Insights and Forecast, 2020-2032
- 7.1. Market Analysis, Insights and Forecast - by Application
- 7.1.1. Commercial Use
- 7.1.2. Home Use
- 7.2. Market Analysis, Insights and Forecast - by Types
- 7.2.1. Biodegradable Materials
- 7.2.2. Photodegradable Materials
- 7.1. Market Analysis, Insights and Forecast - by Application
- 8. Europe Environmentally Degradable Refuse Sacks Analysis, Insights and Forecast, 2020-2032
- 8.1. Market Analysis, Insights and Forecast - by Application
- 8.1.1. Commercial Use
- 8.1.2. Home Use
- 8.2. Market Analysis, Insights and Forecast - by Types
- 8.2.1. Biodegradable Materials
- 8.2.2. Photodegradable Materials
- 8.1. Market Analysis, Insights and Forecast - by Application
- 9. Middle East & Africa Environmentally Degradable Refuse Sacks Analysis, Insights and Forecast, 2020-2032
- 9.1. Market Analysis, Insights and Forecast - by Application
- 9.1.1. Commercial Use
- 9.1.2. Home Use
- 9.2. Market Analysis, Insights and Forecast - by Types
- 9.2.1. Biodegradable Materials
- 9.2.2. Photodegradable Materials
- 9.1. Market Analysis, Insights and Forecast - by Application
- 10. Asia Pacific Environmentally Degradable Refuse Sacks Analysis, Insights and Forecast, 2020-2032
- 10.1. Market Analysis, Insights and Forecast - by Application
- 10.1.1. Commercial Use
- 10.1.2. Home Use
- 10.2. Market Analysis, Insights and Forecast - by Types
- 10.2.1. Biodegradable Materials
- 10.2.2. Photodegradable Materials
- 10.1. Market Analysis, Insights and Forecast - by Application
- 11. Competitive Analysis
- 11.1. Global Market Share Analysis 2025
- 11.2. Company Profiles
- 11.2.1 Berry Global Group
- 11.2.1.1. Overview
- 11.2.1.2. Products
- 11.2.1.3. SWOT Analysis
- 11.2.1.4. Recent Developments
- 11.2.1.5. Financials (Based on Availability)
- 11.2.2 Clorox
- 11.2.2.1. Overview
- 11.2.2.2. Products
- 11.2.2.3. SWOT Analysis
- 11.2.2.4. Recent Developments
- 11.2.2.5. Financials (Based on Availability)
- 11.2.3 Four Star Plastics
- 11.2.3.1. Overview
- 11.2.3.2. Products
- 11.2.3.3. SWOT Analysis
- 11.2.3.4. Recent Developments
- 11.2.3.5. Financials (Based on Availability)
- 11.2.4 GCR GROUP
- 11.2.4.1. Overview
- 11.2.4.2. Products
- 11.2.4.3. SWOT Analysis
- 11.2.4.4. Recent Developments
- 11.2.4.5. Financials (Based on Availability)
- 11.2.5 Mirpack
- 11.2.5.1. Overview
- 11.2.5.2. Products
- 11.2.5.3. SWOT Analysis
- 11.2.5.4. Recent Developments
- 11.2.5.5. Financials (Based on Availability)
- 11.2.6 International Plastics
- 11.2.6.1. Overview
- 11.2.6.2. Products
- 11.2.6.3. SWOT Analysis
- 11.2.6.4. Recent Developments
- 11.2.6.5. Financials (Based on Availability)
- 11.2.7 Terdex
- 11.2.7.1. Overview
- 11.2.7.2. Products
- 11.2.7.3. SWOT Analysis
- 11.2.7.4. Recent Developments
- 11.2.7.5. Financials (Based on Availability)
- 11.2.8 Plascon Group
- 11.2.8.1. Overview
- 11.2.8.2. Products
- 11.2.8.3. SWOT Analysis
- 11.2.8.4. Recent Developments
- 11.2.8.5. Financials (Based on Availability)
- 11.2.9 Plastiroll
- 11.2.9.1. Overview
- 11.2.9.2. Products
- 11.2.9.3. SWOT Analysis
- 11.2.9.4. Recent Developments
- 11.2.9.5. Financials (Based on Availability)
- 11.2.10 Futamura
- 11.2.10.1. Overview
- 11.2.10.2. Products
- 11.2.10.3. SWOT Analysis
- 11.2.10.4. Recent Developments
- 11.2.10.5. Financials (Based on Availability)
- 11.2.1 Berry Global Group
List of Figures
- Figure 1: Global Environmentally Degradable Refuse Sacks Revenue Breakdown (million, %) by Region 2025 & 2033
- Figure 2: North America Environmentally Degradable Refuse Sacks Revenue (million), by Application 2025 & 2033
- Figure 3: North America Environmentally Degradable Refuse Sacks Revenue Share (%), by Application 2025 & 2033
- Figure 4: North America Environmentally Degradable Refuse Sacks Revenue (million), by Types 2025 & 2033
- Figure 5: North America Environmentally Degradable Refuse Sacks Revenue Share (%), by Types 2025 & 2033
- Figure 6: North America Environmentally Degradable Refuse Sacks Revenue (million), by Country 2025 & 2033
- Figure 7: North America Environmentally Degradable Refuse Sacks Revenue Share (%), by Country 2025 & 2033
- Figure 8: South America Environmentally Degradable Refuse Sacks Revenue (million), by Application 2025 & 2033
- Figure 9: South America Environmentally Degradable Refuse Sacks Revenue Share (%), by Application 2025 & 2033
- Figure 10: South America Environmentally Degradable Refuse Sacks Revenue (million), by Types 2025 & 2033
- Figure 11: South America Environmentally Degradable Refuse Sacks Revenue Share (%), by Types 2025 & 2033
- Figure 12: South America Environmentally Degradable Refuse Sacks Revenue (million), by Country 2025 & 2033
- Figure 13: South America Environmentally Degradable Refuse Sacks Revenue Share (%), by Country 2025 & 2033
- Figure 14: Europe Environmentally Degradable Refuse Sacks Revenue (million), by Application 2025 & 2033
- Figure 15: Europe Environmentally Degradable Refuse Sacks Revenue Share (%), by Application 2025 & 2033
- Figure 16: Europe Environmentally Degradable Refuse Sacks Revenue (million), by Types 2025 & 2033
- Figure 17: Europe Environmentally Degradable Refuse Sacks Revenue Share (%), by Types 2025 & 2033
- Figure 18: Europe Environmentally Degradable Refuse Sacks Revenue (million), by Country 2025 & 2033
- Figure 19: Europe Environmentally Degradable Refuse Sacks Revenue Share (%), by Country 2025 & 2033
- Figure 20: Middle East & Africa Environmentally Degradable Refuse Sacks Revenue (million), by Application 2025 & 2033
- Figure 21: Middle East & Africa Environmentally Degradable Refuse Sacks Revenue Share (%), by Application 2025 & 2033
- Figure 22: Middle East & Africa Environmentally Degradable Refuse Sacks Revenue (million), by Types 2025 & 2033
- Figure 23: Middle East & Africa Environmentally Degradable Refuse Sacks Revenue Share (%), by Types 2025 & 2033
- Figure 24: Middle East & Africa Environmentally Degradable Refuse Sacks Revenue (million), by Country 2025 & 2033
- Figure 25: Middle East & Africa Environmentally Degradable Refuse Sacks Revenue Share (%), by Country 2025 & 2033
- Figure 26: Asia Pacific Environmentally Degradable Refuse Sacks Revenue (million), by Application 2025 & 2033
- Figure 27: Asia Pacific Environmentally Degradable Refuse Sacks Revenue Share (%), by Application 2025 & 2033
- Figure 28: Asia Pacific Environmentally Degradable Refuse Sacks Revenue (million), by Types 2025 & 2033
- Figure 29: Asia Pacific Environmentally Degradable Refuse Sacks Revenue Share (%), by Types 2025 & 2033
- Figure 30: Asia Pacific Environmentally Degradable Refuse Sacks Revenue (million), by Country 2025 & 2033
- Figure 31: Asia Pacific Environmentally Degradable Refuse Sacks Revenue Share (%), by Country 2025 & 2033
List of Tables
- Table 1: Global Environmentally Degradable Refuse Sacks Revenue million Forecast, by Application 2020 & 2033
- Table 2: Global Environmentally Degradable Refuse Sacks Revenue million Forecast, by Types 2020 & 2033
- Table 3: Global Environmentally Degradable Refuse Sacks Revenue million Forecast, by Region 2020 & 2033
- Table 4: Global Environmentally Degradable Refuse Sacks Revenue million Forecast, by Application 2020 & 2033
- Table 5: Global Environmentally Degradable Refuse Sacks Revenue million Forecast, by Types 2020 & 2033
- Table 6: Global Environmentally Degradable Refuse Sacks Revenue million Forecast, by Country 2020 & 2033
- Table 7: United States Environmentally Degradable Refuse Sacks Revenue (million) Forecast, by Application 2020 & 2033
- Table 8: Canada Environmentally Degradable Refuse Sacks Revenue (million) Forecast, by Application 2020 & 2033
- Table 9: Mexico Environmentally Degradable Refuse Sacks Revenue (million) Forecast, by Application 2020 & 2033
- Table 10: Global Environmentally Degradable Refuse Sacks Revenue million Forecast, by Application 2020 & 2033
- Table 11: Global Environmentally Degradable Refuse Sacks Revenue million Forecast, by Types 2020 & 2033
- Table 12: Global Environmentally Degradable Refuse Sacks Revenue million Forecast, by Country 2020 & 2033
- Table 13: Brazil Environmentally Degradable Refuse Sacks Revenue (million) Forecast, by Application 2020 & 2033
- Table 14: Argentina Environmentally Degradable Refuse Sacks Revenue (million) Forecast, by Application 2020 & 2033
- Table 15: Rest of South America Environmentally Degradable Refuse Sacks Revenue (million) Forecast, by Application 2020 & 2033
- Table 16: Global Environmentally Degradable Refuse Sacks Revenue million Forecast, by Application 2020 & 2033
- Table 17: Global Environmentally Degradable Refuse Sacks Revenue million Forecast, by Types 2020 & 2033
- Table 18: Global Environmentally Degradable Refuse Sacks Revenue million Forecast, by Country 2020 & 2033
- Table 19: United Kingdom Environmentally Degradable Refuse Sacks Revenue (million) Forecast, by Application 2020 & 2033
- Table 20: Germany Environmentally Degradable Refuse Sacks Revenue (million) Forecast, by Application 2020 & 2033
- Table 21: France Environmentally Degradable Refuse Sacks Revenue (million) Forecast, by Application 2020 & 2033
- Table 22: Italy Environmentally Degradable Refuse Sacks Revenue (million) Forecast, by Application 2020 & 2033
- Table 23: Spain Environmentally Degradable Refuse Sacks Revenue (million) Forecast, by Application 2020 & 2033
- Table 24: Russia Environmentally Degradable Refuse Sacks Revenue (million) Forecast, by Application 2020 & 2033
- Table 25: Benelux Environmentally Degradable Refuse Sacks Revenue (million) Forecast, by Application 2020 & 2033
- Table 26: Nordics Environmentally Degradable Refuse Sacks Revenue (million) Forecast, by Application 2020 & 2033
- Table 27: Rest of Europe Environmentally Degradable Refuse Sacks Revenue (million) Forecast, by Application 2020 & 2033
- Table 28: Global Environmentally Degradable Refuse Sacks Revenue million Forecast, by Application 2020 & 2033
- Table 29: Global Environmentally Degradable Refuse Sacks Revenue million Forecast, by Types 2020 & 2033
- Table 30: Global Environmentally Degradable Refuse Sacks Revenue million Forecast, by Country 2020 & 2033
- Table 31: Turkey Environmentally Degradable Refuse Sacks Revenue (million) Forecast, by Application 2020 & 2033
- Table 32: Israel Environmentally Degradable Refuse Sacks Revenue (million) Forecast, by Application 2020 & 2033
- Table 33: GCC Environmentally Degradable Refuse Sacks Revenue (million) Forecast, by Application 2020 & 2033
- Table 34: North Africa Environmentally Degradable Refuse Sacks Revenue (million) Forecast, by Application 2020 & 2033
- Table 35: South Africa Environmentally Degradable Refuse Sacks Revenue (million) Forecast, by Application 2020 & 2033
- Table 36: Rest of Middle East & Africa Environmentally Degradable Refuse Sacks Revenue (million) Forecast, by Application 2020 & 2033
- Table 37: Global Environmentally Degradable Refuse Sacks Revenue million Forecast, by Application 2020 & 2033
- Table 38: Global Environmentally Degradable Refuse Sacks Revenue million Forecast, by Types 2020 & 2033
- Table 39: Global Environmentally Degradable Refuse Sacks Revenue million Forecast, by Country 2020 & 2033
- Table 40: China Environmentally Degradable Refuse Sacks Revenue (million) Forecast, by Application 2020 & 2033
- Table 41: India Environmentally Degradable Refuse Sacks Revenue (million) Forecast, by Application 2020 & 2033
- Table 42: Japan Environmentally Degradable Refuse Sacks Revenue (million) Forecast, by Application 2020 & 2033
- Table 43: South Korea Environmentally Degradable Refuse Sacks Revenue (million) Forecast, by Application 2020 & 2033
- Table 44: ASEAN Environmentally Degradable Refuse Sacks Revenue (million) Forecast, by Application 2020 & 2033
- Table 45: Oceania Environmentally Degradable Refuse Sacks Revenue (million) Forecast, by Application 2020 & 2033
- Table 46: Rest of Asia Pacific Environmentally Degradable Refuse Sacks Revenue (million) Forecast, by Application 2020 & 2033
Frequently Asked Questions
1. What is the projected Compound Annual Growth Rate (CAGR) of the Environmentally Degradable Refuse Sacks?
The projected CAGR is approximately XX%.
2. Which companies are prominent players in the Environmentally Degradable Refuse Sacks?
Key companies in the market include Berry Global Group, Clorox, Four Star Plastics, GCR GROUP, Mirpack, International Plastics, Terdex, Plascon Group, Plastiroll, Futamura.
3. What are the main segments of the Environmentally Degradable Refuse Sacks?
The market segments include Application, Types.
4. Can you provide details about the market size?
The market size is estimated to be USD XXX million as of 2022.
5. What are some drivers contributing to market growth?
N/A
6. What are the notable trends driving market growth?
N/A
7. Are there any restraints impacting market growth?
N/A
8. Can you provide examples of recent developments in the market?
N/A
9. What pricing options are available for accessing the report?
Pricing options include single-user, multi-user, and enterprise licenses priced at USD 4900.00, USD 7350.00, and USD 9800.00 respectively.
10. Is the market size provided in terms of value or volume?
The market size is provided in terms of value, measured in million.
11. Are there any specific market keywords associated with the report?
Yes, the market keyword associated with the report is "Environmentally Degradable Refuse Sacks," which aids in identifying and referencing the specific market segment covered.
12. How do I determine which pricing option suits my needs best?
The pricing options vary based on user requirements and access needs. Individual users may opt for single-user licenses, while businesses requiring broader access may choose multi-user or enterprise licenses for cost-effective access to the report.
13. Are there any additional resources or data provided in the Environmentally Degradable Refuse Sacks report?
While the report offers comprehensive insights, it's advisable to review the specific contents or supplementary materials provided to ascertain if additional resources or data are available.
14. How can I stay updated on further developments or reports in the Environmentally Degradable Refuse Sacks?
To stay informed about further developments, trends, and reports in the Environmentally Degradable Refuse Sacks, consider subscribing to industry newsletters, following relevant companies and organizations, or regularly checking reputable industry news sources and publications.
Methodology
Step 1 - Identification of Relevant Samples Size from Population Database


Step 2 - Approaches for Defining Global Market Size (Value, Volume* & Price*)

Note*: In applicable scenarios
Step 3 - Data Sources
Primary Research
- Web Analytics
- Survey Reports
- Research Institute
- Latest Research Reports
- Opinion Leaders
Secondary Research
- Annual Reports
- White Paper
- Latest Press Release
- Industry Association
- Paid Database
- Investor Presentations

Step 4 - Data Triangulation
Involves using different sources of information in order to increase the validity of a study
These sources are likely to be stakeholders in a program - participants, other researchers, program staff, other community members, and so on.
Then we put all data in single framework & apply various statistical tools to find out the dynamic on the market.
During the analysis stage, feedback from the stakeholder groups would be compared to determine areas of agreement as well as areas of divergence