

Key Insights
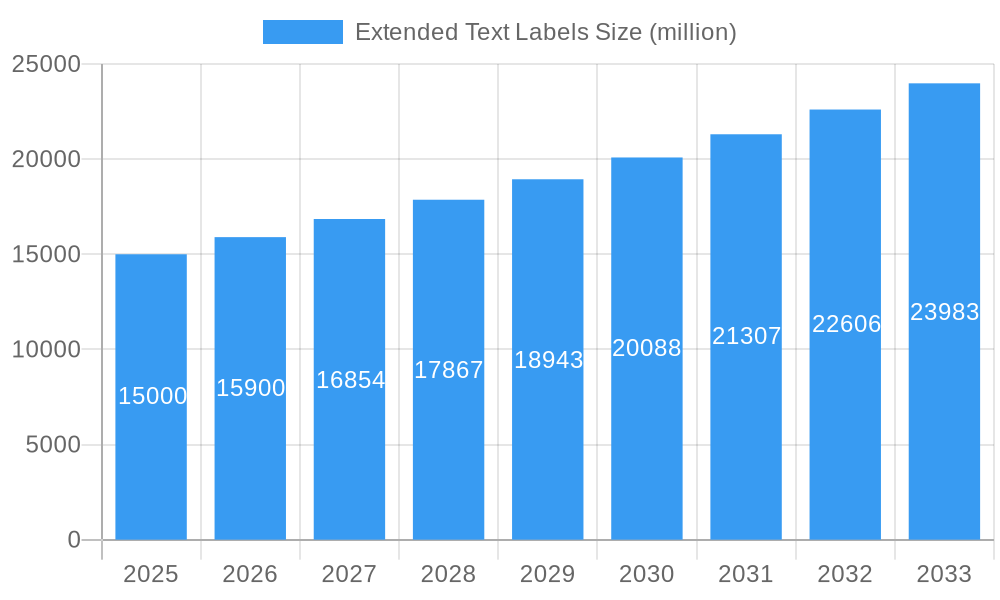
The extended text labels market is experiencing robust growth, driven by increasing demand for detailed product information and enhanced brand storytelling on packaging. This market, estimated at $15 billion in 2025, is projected to exhibit a Compound Annual Growth Rate (CAGR) of 6% from 2025 to 2033, reaching approximately $25 billion by 2033. This growth is fueled by several key factors. The rise of e-commerce necessitates clear and comprehensive product labeling to satisfy consumer expectations for detailed product information and ingredient lists. Furthermore, brands are increasingly leveraging extended text labels to enhance brand identity and engage consumers through storytelling and unique designs. This trend is further boosted by technological advancements in printing technologies that allow for higher quality, more durable, and cost-effective label production. Regulations concerning product labeling and ingredient disclosure also contribute to market expansion, requiring businesses to adopt extended text labels to comply with legal requirements across different regions.
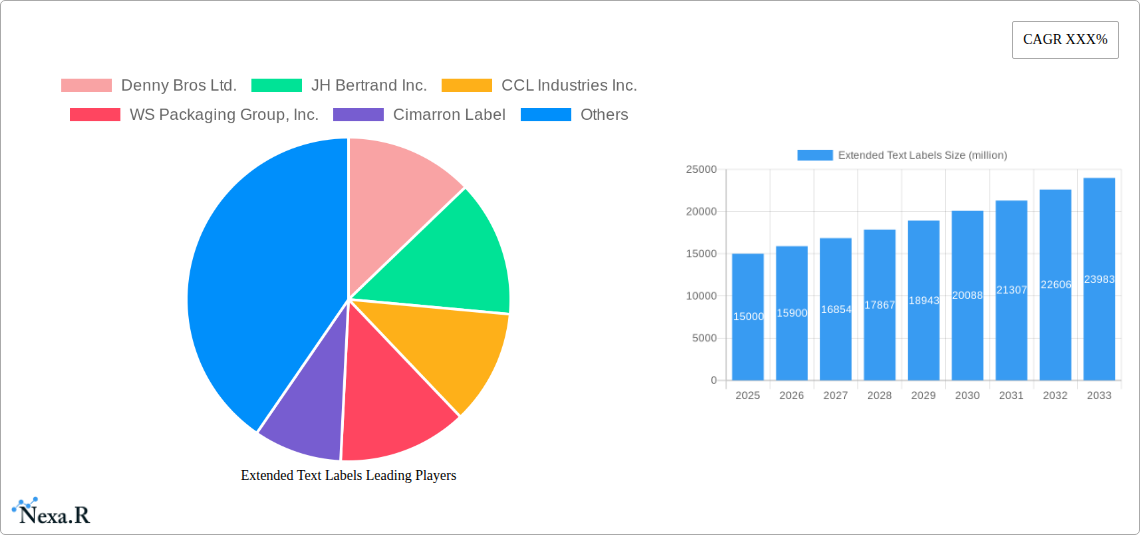
Extended Text Labels Market Size (In Billion)
However, several challenges restrain market growth. Fluctuations in raw material prices, particularly those related to adhesives and substrates, pose a significant challenge to manufacturers. Maintaining consistent supply chain operations amid geopolitical uncertainties and changing consumer preferences also presents ongoing obstacles. Furthermore, the competitive landscape is intensifying, with established players and new entrants vying for market share, leading to price competition and margin pressures. Despite these restraints, the long-term outlook for the extended text labels market remains positive, driven by sustained demand from key end-use industries such as food and beverage, pharmaceuticals, and cosmetics, amongst others. Companies like Denny Bros Ltd., CCL Industries Inc., and Schreiner Group are key players leveraging innovation and strategic partnerships to maintain their competitive edge in this evolving market.
Extended Text Labels Company Market Share
Extended Text Labels Market Report: 2019-2033
This comprehensive report provides a detailed analysis of the Extended Text Labels market, encompassing market dynamics, growth trends, regional dominance, product landscape, challenges, opportunities, and key players. The study period spans from 2019 to 2033, with 2025 serving as both the base and estimated year. The report is invaluable for industry professionals, investors, and strategic decision-makers seeking a deep understanding of this dynamic market. The parent market is the broader label and packaging industry, while the child market focuses specifically on extended text labels.
Expected Market Size (USD Million): xx (2025), xx (2033)
Projected CAGR (%): xx (2025-2033)
Extended Text Labels Market Dynamics & Structure
The Extended Text Labels market is characterized by moderate concentration, with several key players holding significant market share. Technological innovation, driven by advancements in printing technologies and material science, plays a crucial role in shaping market dynamics. Regulatory frameworks regarding labeling requirements and material sustainability influence product development and adoption. Competition from alternative labeling solutions, such as QR codes and digital labels, presents a challenge. End-user demographics, particularly within the food and beverage, pharmaceutical, and consumer goods industries, significantly impact market demand. The past five years have witnessed a moderate level of M&A activity, with consolidation among smaller players observed.
- Market Concentration: Moderately concentrated, with top 5 players holding approximately xx% market share in 2025.
- Technological Innovation: Focus on digital printing, sustainable materials (e.g., recycled paper, biodegradable films), and improved adhesive technologies.
- Regulatory Landscape: Stringent regulations regarding food safety, pharmaceutical labeling, and environmental compliance influence product development.
- Competitive Substitutes: QR codes, digital labels, and RFID tags pose competitive pressure.
- M&A Activity: Approximately xx M&A deals were recorded between 2019 and 2024.
- Innovation Barriers: High upfront investment in R&D and specialized equipment, along with maintaining compliance with evolving regulations.
Extended Text Labels Growth Trends & Insights
The Extended Text Labels market has exhibited steady growth over the historical period (2019-2024). This growth is primarily driven by increasing demand from various end-use sectors, particularly the food and beverage industry which is experiencing growth in demand for detailed product information and traceability. Technological advancements, such as the adoption of digital printing and customized label solutions, are further fueling market expansion. The shift towards personalized consumer experiences and enhanced product branding is also a significant driver. Market penetration is expected to increase further with rising adoption across new sectors such as cosmetics and healthcare products. The adoption of automation in labeling processes and the growing focus on sustainable packaging options further contribute to market growth.
- Market Size (USD Million): xx (2019), xx (2024), xx (2025), xx (2033)
- CAGR (%): xx (2019-2024), xx (2025-2033)
- Market Penetration (%): xx (2024), xx (2033)
Dominant Regions, Countries, or Segments in Extended Text Labels
North America currently holds the largest market share for extended text labels, driven by strong demand from the food and beverage, pharmaceutical and cosmetic industries. Europe follows as a significant market due to established regulatory frameworks and increasing adoption of sustainable packaging. Asia-Pacific demonstrates significant growth potential due to rapid economic growth and rising consumer spending.
- Key Drivers (North America): Strong regulatory compliance requirements, high consumer spending on packaged goods, and significant presence of major label manufacturers.
- Key Drivers (Europe): Stringent regulations regarding food safety and product information, high adoption of sustainable packaging, and sophisticated labeling requirements within the pharmaceutical and healthcare sectors.
- Key Drivers (Asia-Pacific): Rapid economic growth, increasing disposable incomes, growing demand for packaged food and beverage products, and expanding industrialization within emerging economies.
- Market Share (2025): North America (xx%), Europe (xx%), Asia-Pacific (xx%), Rest of World (xx%).
Extended Text Labels Product Landscape
Extended text labels are increasingly incorporating advanced features such as variable data printing, allowing for unique product identification and customization. Technological advancements involve the use of sustainable materials, enhanced adhesives for improved durability, and tamper-evident features to enhance product security. Unique selling propositions often include superior print quality, optimized adhesion for various substrates, and eco-friendly material composition.
Key Drivers, Barriers & Challenges in Extended Text Labels
Key Drivers:
- Growing demand for detailed product information and improved traceability.
- Increasing adoption of sustainable and eco-friendly packaging materials.
- Technological advancements in printing and label manufacturing techniques.
- Rising consumer preference for personalized and branded products.
Key Challenges & Restraints:
- Fluctuations in raw material prices (e.g., paper, adhesives).
- Stringent regulatory compliance requirements affecting production costs.
- Intense competition from alternative labeling solutions and established players.
- Supply chain disruptions affecting material availability and production timelines.
Emerging Opportunities in Extended Text Labels
- Untapped Markets: Expanding into developing economies with growing consumer markets.
- Innovative Applications: Development of smart labels with integrated technology (e.g., RFID, sensors).
- Evolving Consumer Preferences: Focus on sustainable, personalized, and interactive labels.
Growth Accelerators in the Extended Text Labels Industry
Long-term growth is fueled by technological innovation leading to more efficient and sustainable production processes. Strategic partnerships between label manufacturers and packaging companies enable wider market reach and integrated solutions. Expansion into new geographical markets and increased focus on niche applications, such as personalized healthcare labels, further contributes to sustained growth.
Key Players Shaping the Extended Text Labels Market
- Denny Bros Ltd.
- JH Bertrand Inc.
- CCL Industries Inc.
- WS Packaging Group, Inc.
- Cimarron Label
- Schreiner Group GmbH & Co. KG
- Columbine Label Company Inc.
- Resource Label Group LLC.
- Paris Art Packaging Co. Inc.
- Label Impressions Inc.
- Beneli AB
- Abbey Labels Limited
- Weber Packaging Solutions, Inc.
- Tapecon Inc.
- Primeflex Inc.
Notable Milestones in Extended Text Labels Sector
- 2020 (Q3): CCL Industries Inc. launched a new line of sustainable extended text labels.
- 2022 (Q1): Schreiner Group GmbH & Co. KG acquired a smaller label manufacturer, expanding its market share.
- 2023 (Q2): Denny Bros Ltd. introduced a new digital printing technology for enhanced label customization.
- xx (xx): [Add other relevant milestones]
In-Depth Extended Text Labels Market Outlook
The Extended Text Labels market is poised for continued growth, driven by increasing demand for advanced labeling solutions and the adoption of sustainable practices. Strategic investments in R&D, strategic partnerships, and expansion into new markets will be crucial for sustained success in this competitive landscape. The focus on innovative solutions, such as smart labels and personalized labeling, will further drive market expansion and present significant opportunities for key players.
Extended Text Labels Segmentation
-
1. Application
- 1.1. Bottles
- 1.2. Tubes
- 1.3. Cans
- 1.4. Cartons
- 1.5. Others
-
2. Type
- 2.1. by Label Type
- 2.2. by Material Type
Extended Text Labels Segmentation By Geography
-
1. North America
- 1.1. United States
- 1.2. Canada
- 1.3. Mexico
-
2. South America
- 2.1. Brazil
- 2.2. Argentina
- 2.3. Rest of South America
-
3. Europe
- 3.1. United Kingdom
- 3.2. Germany
- 3.3. France
- 3.4. Italy
- 3.5. Spain
- 3.6. Russia
- 3.7. Benelux
- 3.8. Nordics
- 3.9. Rest of Europe
-
4. Middle East & Africa
- 4.1. Turkey
- 4.2. Israel
- 4.3. GCC
- 4.4. North Africa
- 4.5. South Africa
- 4.6. Rest of Middle East & Africa
-
5. Asia Pacific
- 5.1. China
- 5.2. India
- 5.3. Japan
- 5.4. South Korea
- 5.5. ASEAN
- 5.6. Oceania
- 5.7. Rest of Asia Pacific

Extended Text Labels Regional Market Share
Geographic Coverage of Extended Text Labels
Extended Text Labels REPORT HIGHLIGHTS
| Aspects | Details |
|---|---|
| Study Period | 2020-2034 |
| Base Year | 2025 |
| Estimated Year | 2026 |
| Forecast Period | 2026-2034 |
| Historical Period | 2020-2025 |
| Growth Rate | CAGR of XXX% from 2020-2034 |
| Segmentation |
|
Table of Contents
- 1. Introduction
- 1.1. Research Scope
- 1.2. Market Segmentation
- 1.3. Research Methodology
- 1.4. Definitions and Assumptions
- 2. Executive Summary
- 2.1. Introduction
- 3. Market Dynamics
- 3.1. Introduction
- 3.2. Market Drivers
- 3.3. Market Restrains
- 3.4. Market Trends
- 4. Market Factor Analysis
- 4.1. Porters Five Forces
- 4.2. Supply/Value Chain
- 4.3. PESTEL analysis
- 4.4. Market Entropy
- 4.5. Patent/Trademark Analysis
- 5. Global Extended Text Labels Analysis, Insights and Forecast, 2020-2032
- 5.1. Market Analysis, Insights and Forecast - by Application
- 5.1.1. Bottles
- 5.1.2. Tubes
- 5.1.3. Cans
- 5.1.4. Cartons
- 5.1.5. Others
- 5.2. Market Analysis, Insights and Forecast - by Type
- 5.2.1. by Label Type
- 5.2.2. by Material Type
- 5.3. Market Analysis, Insights and Forecast - by Region
- 5.3.1. North America
- 5.3.2. South America
- 5.3.3. Europe
- 5.3.4. Middle East & Africa
- 5.3.5. Asia Pacific
- 5.1. Market Analysis, Insights and Forecast - by Application
- 6. North America Extended Text Labels Analysis, Insights and Forecast, 2020-2032
- 6.1. Market Analysis, Insights and Forecast - by Application
- 6.1.1. Bottles
- 6.1.2. Tubes
- 6.1.3. Cans
- 6.1.4. Cartons
- 6.1.5. Others
- 6.2. Market Analysis, Insights and Forecast - by Type
- 6.2.1. by Label Type
- 6.2.2. by Material Type
- 6.1. Market Analysis, Insights and Forecast - by Application
- 7. South America Extended Text Labels Analysis, Insights and Forecast, 2020-2032
- 7.1. Market Analysis, Insights and Forecast - by Application
- 7.1.1. Bottles
- 7.1.2. Tubes
- 7.1.3. Cans
- 7.1.4. Cartons
- 7.1.5. Others
- 7.2. Market Analysis, Insights and Forecast - by Type
- 7.2.1. by Label Type
- 7.2.2. by Material Type
- 7.1. Market Analysis, Insights and Forecast - by Application
- 8. Europe Extended Text Labels Analysis, Insights and Forecast, 2020-2032
- 8.1. Market Analysis, Insights and Forecast - by Application
- 8.1.1. Bottles
- 8.1.2. Tubes
- 8.1.3. Cans
- 8.1.4. Cartons
- 8.1.5. Others
- 8.2. Market Analysis, Insights and Forecast - by Type
- 8.2.1. by Label Type
- 8.2.2. by Material Type
- 8.1. Market Analysis, Insights and Forecast - by Application
- 9. Middle East & Africa Extended Text Labels Analysis, Insights and Forecast, 2020-2032
- 9.1. Market Analysis, Insights and Forecast - by Application
- 9.1.1. Bottles
- 9.1.2. Tubes
- 9.1.3. Cans
- 9.1.4. Cartons
- 9.1.5. Others
- 9.2. Market Analysis, Insights and Forecast - by Type
- 9.2.1. by Label Type
- 9.2.2. by Material Type
- 9.1. Market Analysis, Insights and Forecast - by Application
- 10. Asia Pacific Extended Text Labels Analysis, Insights and Forecast, 2020-2032
- 10.1. Market Analysis, Insights and Forecast - by Application
- 10.1.1. Bottles
- 10.1.2. Tubes
- 10.1.3. Cans
- 10.1.4. Cartons
- 10.1.5. Others
- 10.2. Market Analysis, Insights and Forecast - by Type
- 10.2.1. by Label Type
- 10.2.2. by Material Type
- 10.1. Market Analysis, Insights and Forecast - by Application
- 11. Competitive Analysis
- 11.1. Global Market Share Analysis 2025
- 11.2. Company Profiles
- 11.2.1 Denny Bros Ltd.
- 11.2.1.1. Overview
- 11.2.1.2. Products
- 11.2.1.3. SWOT Analysis
- 11.2.1.4. Recent Developments
- 11.2.1.5. Financials (Based on Availability)
- 11.2.2 JH Bertrand Inc.
- 11.2.2.1. Overview
- 11.2.2.2. Products
- 11.2.2.3. SWOT Analysis
- 11.2.2.4. Recent Developments
- 11.2.2.5. Financials (Based on Availability)
- 11.2.3 CCL Industries Inc.
- 11.2.3.1. Overview
- 11.2.3.2. Products
- 11.2.3.3. SWOT Analysis
- 11.2.3.4. Recent Developments
- 11.2.3.5. Financials (Based on Availability)
- 11.2.4 WS Packaging Group Inc.
- 11.2.4.1. Overview
- 11.2.4.2. Products
- 11.2.4.3. SWOT Analysis
- 11.2.4.4. Recent Developments
- 11.2.4.5. Financials (Based on Availability)
- 11.2.5 Cimarron Label
- 11.2.5.1. Overview
- 11.2.5.2. Products
- 11.2.5.3. SWOT Analysis
- 11.2.5.4. Recent Developments
- 11.2.5.5. Financials (Based on Availability)
- 11.2.6 Schreiner Group GmbH & Co. KG
- 11.2.6.1. Overview
- 11.2.6.2. Products
- 11.2.6.3. SWOT Analysis
- 11.2.6.4. Recent Developments
- 11.2.6.5. Financials (Based on Availability)
- 11.2.7 Columbine Label Company Inc.
- 11.2.7.1. Overview
- 11.2.7.2. Products
- 11.2.7.3. SWOT Analysis
- 11.2.7.4. Recent Developments
- 11.2.7.5. Financials (Based on Availability)
- 11.2.8 Resource Label Group LLC.
- 11.2.8.1. Overview
- 11.2.8.2. Products
- 11.2.8.3. SWOT Analysis
- 11.2.8.4. Recent Developments
- 11.2.8.5. Financials (Based on Availability)
- 11.2.9 Paris Art Packaging Co. Inc.
- 11.2.9.1. Overview
- 11.2.9.2. Products
- 11.2.9.3. SWOT Analysis
- 11.2.9.4. Recent Developments
- 11.2.9.5. Financials (Based on Availability)
- 11.2.10 Label Impressions Inc.
- 11.2.10.1. Overview
- 11.2.10.2. Products
- 11.2.10.3. SWOT Analysis
- 11.2.10.4. Recent Developments
- 11.2.10.5. Financials (Based on Availability)
- 11.2.11 Beneli AB
- 11.2.11.1. Overview
- 11.2.11.2. Products
- 11.2.11.3. SWOT Analysis
- 11.2.11.4. Recent Developments
- 11.2.11.5. Financials (Based on Availability)
- 11.2.12 Abbey Labels Limited
- 11.2.12.1. Overview
- 11.2.12.2. Products
- 11.2.12.3. SWOT Analysis
- 11.2.12.4. Recent Developments
- 11.2.12.5. Financials (Based on Availability)
- 11.2.13 Weber Packaging Solutions Inc.
- 11.2.13.1. Overview
- 11.2.13.2. Products
- 11.2.13.3. SWOT Analysis
- 11.2.13.4. Recent Developments
- 11.2.13.5. Financials (Based on Availability)
- 11.2.14 Tapecon Inc.
- 11.2.14.1. Overview
- 11.2.14.2. Products
- 11.2.14.3. SWOT Analysis
- 11.2.14.4. Recent Developments
- 11.2.14.5. Financials (Based on Availability)
- 11.2.15 Primeflex Inc.
- 11.2.15.1. Overview
- 11.2.15.2. Products
- 11.2.15.3. SWOT Analysis
- 11.2.15.4. Recent Developments
- 11.2.15.5. Financials (Based on Availability)
- 11.2.1 Denny Bros Ltd.
List of Figures
- Figure 1: Global Extended Text Labels Revenue Breakdown (million, %) by Region 2025 & 2033
- Figure 2: North America Extended Text Labels Revenue (million), by Application 2025 & 2033
- Figure 3: North America Extended Text Labels Revenue Share (%), by Application 2025 & 2033
- Figure 4: North America Extended Text Labels Revenue (million), by Type 2025 & 2033
- Figure 5: North America Extended Text Labels Revenue Share (%), by Type 2025 & 2033
- Figure 6: North America Extended Text Labels Revenue (million), by Country 2025 & 2033
- Figure 7: North America Extended Text Labels Revenue Share (%), by Country 2025 & 2033
- Figure 8: South America Extended Text Labels Revenue (million), by Application 2025 & 2033
- Figure 9: South America Extended Text Labels Revenue Share (%), by Application 2025 & 2033
- Figure 10: South America Extended Text Labels Revenue (million), by Type 2025 & 2033
- Figure 11: South America Extended Text Labels Revenue Share (%), by Type 2025 & 2033
- Figure 12: South America Extended Text Labels Revenue (million), by Country 2025 & 2033
- Figure 13: South America Extended Text Labels Revenue Share (%), by Country 2025 & 2033
- Figure 14: Europe Extended Text Labels Revenue (million), by Application 2025 & 2033
- Figure 15: Europe Extended Text Labels Revenue Share (%), by Application 2025 & 2033
- Figure 16: Europe Extended Text Labels Revenue (million), by Type 2025 & 2033
- Figure 17: Europe Extended Text Labels Revenue Share (%), by Type 2025 & 2033
- Figure 18: Europe Extended Text Labels Revenue (million), by Country 2025 & 2033
- Figure 19: Europe Extended Text Labels Revenue Share (%), by Country 2025 & 2033
- Figure 20: Middle East & Africa Extended Text Labels Revenue (million), by Application 2025 & 2033
- Figure 21: Middle East & Africa Extended Text Labels Revenue Share (%), by Application 2025 & 2033
- Figure 22: Middle East & Africa Extended Text Labels Revenue (million), by Type 2025 & 2033
- Figure 23: Middle East & Africa Extended Text Labels Revenue Share (%), by Type 2025 & 2033
- Figure 24: Middle East & Africa Extended Text Labels Revenue (million), by Country 2025 & 2033
- Figure 25: Middle East & Africa Extended Text Labels Revenue Share (%), by Country 2025 & 2033
- Figure 26: Asia Pacific Extended Text Labels Revenue (million), by Application 2025 & 2033
- Figure 27: Asia Pacific Extended Text Labels Revenue Share (%), by Application 2025 & 2033
- Figure 28: Asia Pacific Extended Text Labels Revenue (million), by Type 2025 & 2033
- Figure 29: Asia Pacific Extended Text Labels Revenue Share (%), by Type 2025 & 2033
- Figure 30: Asia Pacific Extended Text Labels Revenue (million), by Country 2025 & 2033
- Figure 31: Asia Pacific Extended Text Labels Revenue Share (%), by Country 2025 & 2033
List of Tables
- Table 1: Global Extended Text Labels Revenue million Forecast, by Application 2020 & 2033
- Table 2: Global Extended Text Labels Revenue million Forecast, by Type 2020 & 2033
- Table 3: Global Extended Text Labels Revenue million Forecast, by Region 2020 & 2033
- Table 4: Global Extended Text Labels Revenue million Forecast, by Application 2020 & 2033
- Table 5: Global Extended Text Labels Revenue million Forecast, by Type 2020 & 2033
- Table 6: Global Extended Text Labels Revenue million Forecast, by Country 2020 & 2033
- Table 7: United States Extended Text Labels Revenue (million) Forecast, by Application 2020 & 2033
- Table 8: Canada Extended Text Labels Revenue (million) Forecast, by Application 2020 & 2033
- Table 9: Mexico Extended Text Labels Revenue (million) Forecast, by Application 2020 & 2033
- Table 10: Global Extended Text Labels Revenue million Forecast, by Application 2020 & 2033
- Table 11: Global Extended Text Labels Revenue million Forecast, by Type 2020 & 2033
- Table 12: Global Extended Text Labels Revenue million Forecast, by Country 2020 & 2033
- Table 13: Brazil Extended Text Labels Revenue (million) Forecast, by Application 2020 & 2033
- Table 14: Argentina Extended Text Labels Revenue (million) Forecast, by Application 2020 & 2033
- Table 15: Rest of South America Extended Text Labels Revenue (million) Forecast, by Application 2020 & 2033
- Table 16: Global Extended Text Labels Revenue million Forecast, by Application 2020 & 2033
- Table 17: Global Extended Text Labels Revenue million Forecast, by Type 2020 & 2033
- Table 18: Global Extended Text Labels Revenue million Forecast, by Country 2020 & 2033
- Table 19: United Kingdom Extended Text Labels Revenue (million) Forecast, by Application 2020 & 2033
- Table 20: Germany Extended Text Labels Revenue (million) Forecast, by Application 2020 & 2033
- Table 21: France Extended Text Labels Revenue (million) Forecast, by Application 2020 & 2033
- Table 22: Italy Extended Text Labels Revenue (million) Forecast, by Application 2020 & 2033
- Table 23: Spain Extended Text Labels Revenue (million) Forecast, by Application 2020 & 2033
- Table 24: Russia Extended Text Labels Revenue (million) Forecast, by Application 2020 & 2033
- Table 25: Benelux Extended Text Labels Revenue (million) Forecast, by Application 2020 & 2033
- Table 26: Nordics Extended Text Labels Revenue (million) Forecast, by Application 2020 & 2033
- Table 27: Rest of Europe Extended Text Labels Revenue (million) Forecast, by Application 2020 & 2033
- Table 28: Global Extended Text Labels Revenue million Forecast, by Application 2020 & 2033
- Table 29: Global Extended Text Labels Revenue million Forecast, by Type 2020 & 2033
- Table 30: Global Extended Text Labels Revenue million Forecast, by Country 2020 & 2033
- Table 31: Turkey Extended Text Labels Revenue (million) Forecast, by Application 2020 & 2033
- Table 32: Israel Extended Text Labels Revenue (million) Forecast, by Application 2020 & 2033
- Table 33: GCC Extended Text Labels Revenue (million) Forecast, by Application 2020 & 2033
- Table 34: North Africa Extended Text Labels Revenue (million) Forecast, by Application 2020 & 2033
- Table 35: South Africa Extended Text Labels Revenue (million) Forecast, by Application 2020 & 2033
- Table 36: Rest of Middle East & Africa Extended Text Labels Revenue (million) Forecast, by Application 2020 & 2033
- Table 37: Global Extended Text Labels Revenue million Forecast, by Application 2020 & 2033
- Table 38: Global Extended Text Labels Revenue million Forecast, by Type 2020 & 2033
- Table 39: Global Extended Text Labels Revenue million Forecast, by Country 2020 & 2033
- Table 40: China Extended Text Labels Revenue (million) Forecast, by Application 2020 & 2033
- Table 41: India Extended Text Labels Revenue (million) Forecast, by Application 2020 & 2033
- Table 42: Japan Extended Text Labels Revenue (million) Forecast, by Application 2020 & 2033
- Table 43: South Korea Extended Text Labels Revenue (million) Forecast, by Application 2020 & 2033
- Table 44: ASEAN Extended Text Labels Revenue (million) Forecast, by Application 2020 & 2033
- Table 45: Oceania Extended Text Labels Revenue (million) Forecast, by Application 2020 & 2033
- Table 46: Rest of Asia Pacific Extended Text Labels Revenue (million) Forecast, by Application 2020 & 2033
Frequently Asked Questions
1. What is the projected Compound Annual Growth Rate (CAGR) of the Extended Text Labels?
The projected CAGR is approximately XXX%.
2. Which companies are prominent players in the Extended Text Labels?
Key companies in the market include Denny Bros Ltd., JH Bertrand Inc., CCL Industries Inc., WS Packaging Group, Inc., Cimarron Label, Schreiner Group GmbH & Co. KG, Columbine Label Company Inc., Resource Label Group LLC., Paris Art Packaging Co. Inc., Label Impressions Inc., Beneli AB, Abbey Labels Limited, Weber Packaging Solutions, Inc., Tapecon Inc., Primeflex Inc..
3. What are the main segments of the Extended Text Labels?
The market segments include Application, Type.
4. Can you provide details about the market size?
The market size is estimated to be USD XXX million as of 2022.
5. What are some drivers contributing to market growth?
N/A
6. What are the notable trends driving market growth?
N/A
7. Are there any restraints impacting market growth?
N/A
8. Can you provide examples of recent developments in the market?
N/A
9. What pricing options are available for accessing the report?
Pricing options include single-user, multi-user, and enterprise licenses priced at USD 2900.00, USD 4350.00, and USD 5800.00 respectively.
10. Is the market size provided in terms of value or volume?
The market size is provided in terms of value, measured in million.
11. Are there any specific market keywords associated with the report?
Yes, the market keyword associated with the report is "Extended Text Labels," which aids in identifying and referencing the specific market segment covered.
12. How do I determine which pricing option suits my needs best?
The pricing options vary based on user requirements and access needs. Individual users may opt for single-user licenses, while businesses requiring broader access may choose multi-user or enterprise licenses for cost-effective access to the report.
13. Are there any additional resources or data provided in the Extended Text Labels report?
While the report offers comprehensive insights, it's advisable to review the specific contents or supplementary materials provided to ascertain if additional resources or data are available.
14. How can I stay updated on further developments or reports in the Extended Text Labels?
To stay informed about further developments, trends, and reports in the Extended Text Labels, consider subscribing to industry newsletters, following relevant companies and organizations, or regularly checking reputable industry news sources and publications.
Methodology
Step 1 - Identification of Relevant Samples Size from Population Database


Step 2 - Approaches for Defining Global Market Size (Value, Volume* & Price*)

Note*: In applicable scenarios
Step 3 - Data Sources
Primary Research
- Web Analytics
- Survey Reports
- Research Institute
- Latest Research Reports
- Opinion Leaders
Secondary Research
- Annual Reports
- White Paper
- Latest Press Release
- Industry Association
- Paid Database
- Investor Presentations

Step 4 - Data Triangulation
Involves using different sources of information in order to increase the validity of a study
These sources are likely to be stakeholders in a program - participants, other researchers, program staff, other community members, and so on.
Then we put all data in single framework & apply various statistical tools to find out the dynamic on the market.
During the analysis stage, feedback from the stakeholder groups would be compared to determine areas of agreement as well as areas of divergence