

Key Insights
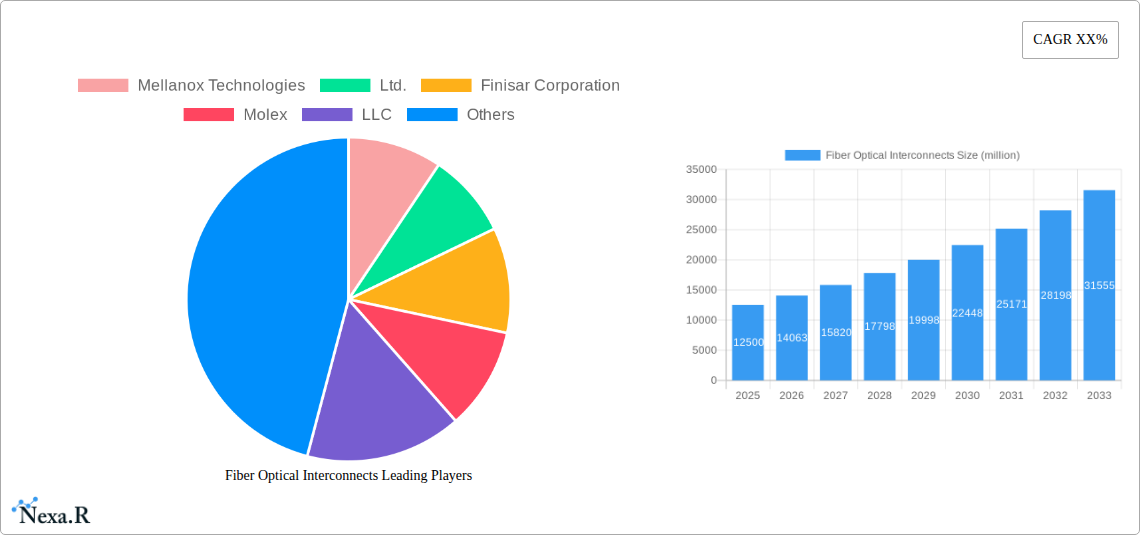
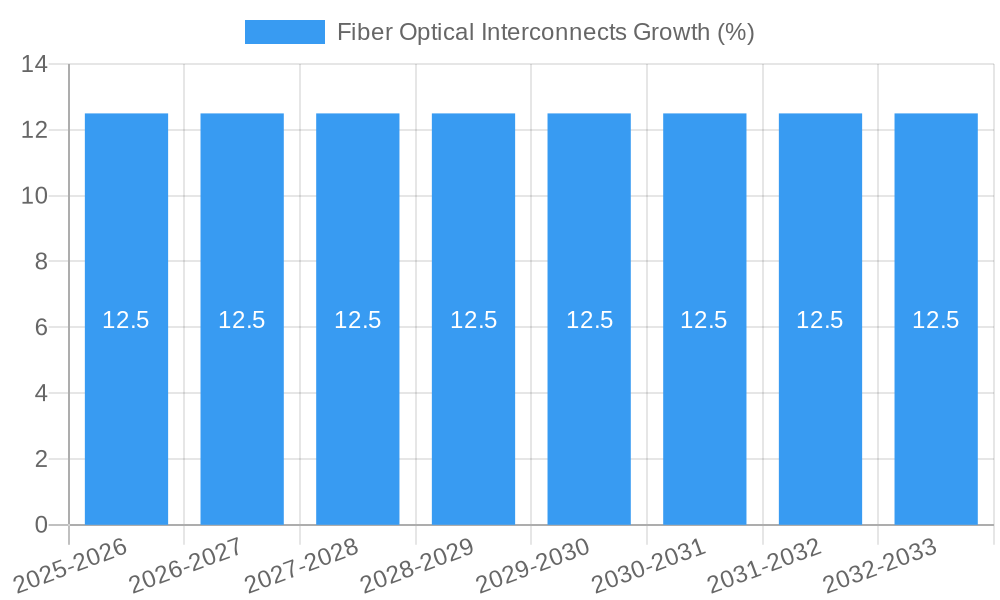
The Fiber Optical Interconnects market is poised for significant expansion, driven by an estimated market size of \$12,500 million in 2025 and a projected Compound Annual Growth Rate (CAGR) of 12.5% through 2033. This robust growth is fueled by the insatiable demand for higher bandwidth and faster data transmission speeds across a multitude of applications, most notably in data communication and telecommunications. The proliferation of 5G networks, the escalating adoption of cloud computing, and the continuous evolution of data centers are primary catalysts. Furthermore, the burgeoning growth of the Internet of Things (IoT) ecosystem, with its ever-increasing number of connected devices, necessitates advanced interconnect solutions that fiber optics are uniquely positioned to provide. Emerging applications in areas like high-performance computing, artificial intelligence, and virtual reality are also creating new avenues for market penetration and sustained growth.
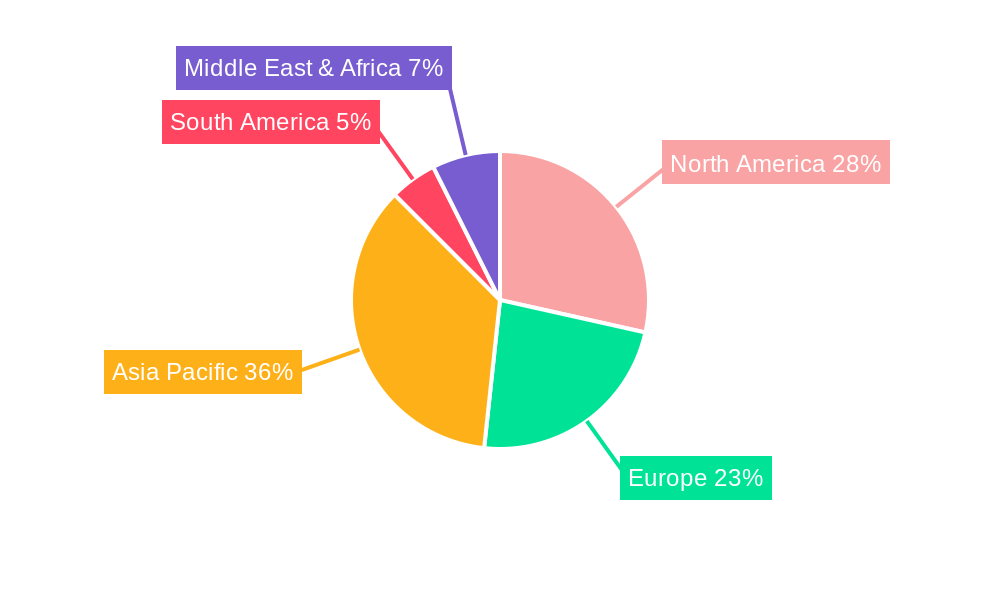
Key market restraints include the initial high cost of deployment for some advanced fiber optic solutions and the technical expertise required for installation and maintenance. However, ongoing innovation and economies of scale are steadily mitigating these challenges. The market is segmented into various types, including essential Cable Assemblies and Connectors, sophisticated Silicon Photonics Systems, PIC-based Interconnects, Optical Engines, Optical Transceivers, and specialized Free Space Optics, along with Fibers & Waveguides. Major players like Broadcom Limited, TE Connectivity Ltd, and Finisar Corporation are actively investing in research and development to introduce more efficient, cost-effective, and high-performance interconnect solutions, further shaping the competitive landscape and driving market advancements. The Asia Pacific region, particularly China and India, is anticipated to be a leading growth engine due to rapid digital transformation and substantial investments in telecommunications infrastructure.
This in-depth report offers a strategic analysis of the global Fiber Optical Interconnects market, providing critical insights for stakeholders navigating this rapidly evolving landscape. With a study period spanning from 2019 to 2033, including a base year of 2025 and a forecast period from 2025 to 2033, this report meticulously dissects market dynamics, growth trends, regional dominance, product innovations, and the competitive environment. Leveraging high-traffic keywords and detailed segmentation, this report is optimized for maximum search engine visibility and delivers actionable intelligence for industry professionals.
Fiber Optical Interconnects Market Dynamics & Structure
The Fiber Optical Interconnects market is characterized by a moderately concentrated structure, driven by continuous technological innovation and increasing demand from data-intensive applications. Key drivers include the proliferation of 5G networks, the expansion of cloud computing infrastructure, and the growing adoption of AI and machine learning, all of which necessitate higher bandwidth and lower latency solutions. Regulatory frameworks, particularly those promoting digital transformation and infrastructure development, play a crucial role in shaping market accessibility and adoption. While direct competitive product substitutes are limited given the inherent advantages of fiber optics, advancements in copper interconnects for shorter distances present a mild competitive pressure. End-user demographics are increasingly diverse, encompassing large enterprises, telecommunication providers, data center operators, and specialized research institutions. Mergers and acquisitions (M&A) are a recurring trend, as larger players acquire innovative smaller companies to consolidate market share and gain access to cutting-edge technologies. For instance, the historical period saw several strategic acquisitions aimed at bolstering portfolios in silicon photonics and high-speed optical transceivers.
- Market Concentration: Moderately concentrated, with key players dominating specific segments.
- Technological Innovation Drivers: 5G deployment, cloud growth, AI/ML adoption, data center expansion.
- Regulatory Frameworks: Government initiatives for digital infrastructure and broadband expansion.
- Competitive Product Substitutes: Limited, but advancements in high-speed copper for shorter reaches.
- End-User Demographics: Enterprises, telecommunication carriers, data center operators, research institutions.
- M&A Trends: Ongoing consolidation and strategic acquisitions to enhance technological capabilities.
Fiber Optical Interconnects Growth Trends & Insights
The global Fiber Optical Interconnects market is projected to experience robust growth, driven by the insatiable demand for higher data transmission speeds and enhanced network capabilities. The market size is expected to expand significantly, with adoption rates for advanced fiber optic interconnect solutions accelerating across various industries. Technological disruptions, such as the maturation of silicon photonics and the development of higher-density connectors, are reshaping product offerings and driving innovation. Consumer behavior shifts are also influencing market dynamics, with an increasing expectation for seamless, high-speed connectivity and the proliferation of bandwidth-intensive applications. The market penetration of fiber optical interconnects is deepening as organizations prioritize network performance and scalability. Specific metrics, such as an anticipated Compound Annual Growth Rate (CAGR) of approximately 8.5% during the forecast period, underscore the strong upward trajectory. The market's evolution is also influenced by a growing awareness of energy efficiency and power consumption within data centers, leading to the demand for more optimized interconnect solutions. The increasing complexity of data processing and the exponential growth of data generation are fundamental underlying factors propelling this sustained growth. Furthermore, the ongoing digitalization of economies worldwide and the push towards smart city initiatives are creating new avenues for fiber optical interconnect adoption. The transition to higher speed Ethernet standards, such as 400GbE and beyond, is a significant market catalyst. The integration of AI in network management and traffic optimization is also indirectly boosting the demand for reliable and high-performance interconnects.
Dominant Regions, Countries, or Segments in Fiber Optical Interconnects
North America, particularly the United States, currently holds a dominant position in the global Fiber Optical Interconnects market, driven by its advanced technological infrastructure, significant investments in 5G deployment, and the presence of major data center hubs. The region benefits from strong government support for digital innovation and a high concentration of leading technology companies. In terms of Applications, Data Communication is the most influential segment, encompassing the needs of hyperscale data centers, enterprise networks, and cloud service providers. This segment's dominance is fueled by the massive growth in data traffic, cloud computing, and artificial intelligence. Within the Types segmentation, Optical Transceivers represent a key growth area, with consistent demand for higher speed and more efficient solutions. Silicon Photonics Systems and PIC-based Interconnects are emerging as significant growth drivers, offering advanced capabilities for next-generation networks.
Leading Region: North America (primarily USA)
- Key Drivers: Advanced 5G infrastructure, hyperscale data center expansion, strong R&D investments, supportive government policies for digital transformation.
- Market Share: Anticipated to hold over 30% of the global market by 2025.
- Growth Potential: Continued innovation in next-generation networking technologies.
Dominant Application Segment: Data Communication
- Key Drivers: Exponential data traffic growth, cloud computing adoption, AI/ML workloads, enterprise digital transformation initiatives.
- Market Share: Expected to contribute over 55% of the total market revenue in 2025.
- Growth Potential: Driven by increasing demand for higher bandwidth and lower latency in data-intensive applications.
Key Type Segments: Optical Transceivers, Cable Assemblies, and Silicon Photonics Systems.
- Optical Transceivers: Crucial for high-speed data transmission in data centers and telecom networks.
- Cable Assemblies: Essential for connecting various network components, with increasing demand for high-performance optical cables.
- Silicon Photonics Systems: A rapidly growing segment due to its integration capabilities, cost-effectiveness, and performance benefits in advanced interconnect solutions.
Fiber Optical Interconnects Product Landscape
The Fiber Optical Interconnects product landscape is characterized by continuous innovation focused on increasing bandwidth, reducing latency, enhancing energy efficiency, and miniaturization. Key product categories include high-density optical transceivers supporting speeds of 400GbE, 800GbE, and beyond, designed for data center and telecommunication network upgrades. Advanced optical engines and PIC-based interconnects are enabling greater integration and signal processing capabilities. Cable assemblies are evolving with improved fiber types and connector designs for higher performance and reliability. Silicon photonics systems are a major technological advancement, allowing for the integration of optical and electronic functions on a single chip, leading to smaller, more powerful, and more cost-effective interconnect solutions. Free space optics are finding niche applications in specific industrial and military settings requiring non-physical connections.
Key Drivers, Barriers & Challenges in Fiber Optical Interconnects
Key Drivers: The fiber optical interconnects market is propelled by several key drivers, including the exponential growth of data traffic fueled by cloud computing and AI, the global rollout of 5G networks demanding higher bandwidth, and the continuous need for faster and more efficient data transmission in data centers. Government initiatives promoting digital infrastructure development and the increasing adoption of high-performance computing also act as significant growth catalysts.
Key Barriers & Challenges: Despite robust growth, the market faces challenges such as the high initial cost of deployment for some advanced fiber optic solutions, the complexity of installation and maintenance in certain environments, and the need for skilled labor. Supply chain disruptions can impact the availability of specialized components, and intense competition can lead to price pressures. Regulatory hurdles related to network standardization and spectrum allocation, while generally supportive, can also introduce complexities. The predicted impact of these challenges on market growth is estimated at around 10-15% in specific niche segments.
Emerging Opportunities in Fiber Optical Interconnects
Emerging opportunities lie in the expansion of fiber optical interconnects into new application areas, such as industrial automation and the Internet of Things (IoT), where high-speed, reliable connectivity is crucial. The development of next-generation data centers, including edge computing facilities, presents a significant growth avenue. Furthermore, the increasing demand for sustainable and energy-efficient interconnect solutions offers opportunities for manufacturers focused on green technology. The growing adoption of passive optical networks (PON) in residential and business environments also presents untapped market potential.
Growth Accelerators in the Fiber Optical Interconnects Industry
Growth accelerators for the fiber optical interconnects industry are primarily technological breakthroughs and strategic market expansion. The continued evolution of silicon photonics technology promises to drive down costs and increase the performance of optical interconnects, making them more accessible. Strategic partnerships between component manufacturers, network equipment providers, and service operators are crucial for accelerating the adoption of new technologies and expanding market reach. The development of standardized interfaces and interoperability protocols will also foster wider adoption and reduce integration complexities.
Key Players Shaping the Fiber Optical Interconnects Market
- Mellanox Technologies, Ltd.
- Finisar Corporation
- Molex, LLC
- Acacia Communications Inc.
- Oclaro, Inc.
- Sumitomo Electric Industries, Ltd.
- Broadcom Limited
- TE Connectivity Ltd
- Amphenol FCI
- Juniper Networks, Inc.
- Infinera Corporation
- Fujitsu Ltd.
Notable Milestones in Fiber Optical Interconnects Sector
- 2019: Launch of 400GbE optical transceivers becoming more widely available.
- 2020: Increased M&A activity focused on silicon photonics companies.
- 2021: Significant advancements in PIC (Photonic Integrated Circuit) technology for high-density interconnects.
- 2022: Growing interest and development in Free Space Optics for specific industrial applications.
- 2023: Standardization efforts for 800GbE and beyond gaining momentum.
- 2024: Increased focus on energy-efficient optical interconnect solutions for data centers.
In-Depth Fiber Optical Interconnects Market Outlook
The future outlook for the Fiber Optical Interconnects market is exceptionally bright, with continued strong growth driven by ongoing digital transformation and the increasing demands of data-intensive applications. Key growth accelerators include the maturation of silicon photonics, enabling more integrated and cost-effective solutions, and strategic collaborations that foster innovation and market penetration. The expansion of 5G and the development of next-generation telecommunication infrastructure will further fuel demand. Untapped markets in emerging economies and niche industrial applications represent significant future opportunities, poised to further solidify the indispensability of fiber optical interconnects in the global technological ecosystem.
Fiber Optical Interconnects Segmentation
-
1. Application
- 1.1. Data Communication
- 1.2. Telecommunication
-
2. Types
- 2.1. Cable Assemblies
- 2.2. Connectors
- 2.3. Silicon Photonics Systems
- 2.4. PIC-based Interconnects
- 2.5. Optical Engines
- 2.6. Optical Transceivers
- 2.7. Free Space Optics
- 2.8. Fibers & Wave Guides
Fiber Optical Interconnects Segmentation By Geography
-
1. North America
- 1.1. United States
- 1.2. Canada
- 1.3. Mexico
-
2. South America
- 2.1. Brazil
- 2.2. Argentina
- 2.3. Rest of South America
-
3. Europe
- 3.1. United Kingdom
- 3.2. Germany
- 3.3. France
- 3.4. Italy
- 3.5. Spain
- 3.6. Russia
- 3.7. Benelux
- 3.8. Nordics
- 3.9. Rest of Europe
-
4. Middle East & Africa
- 4.1. Turkey
- 4.2. Israel
- 4.3. GCC
- 4.4. North Africa
- 4.5. South Africa
- 4.6. Rest of Middle East & Africa
-
5. Asia Pacific
- 5.1. China
- 5.2. India
- 5.3. Japan
- 5.4. South Korea
- 5.5. ASEAN
- 5.6. Oceania
- 5.7. Rest of Asia Pacific
Fiber Optical Interconnects REPORT HIGHLIGHTS
| Aspects | Details |
|---|---|
| Study Period | 2019-2033 |
| Base Year | 2024 |
| Estimated Year | 2025 |
| Forecast Period | 2025-2033 |
| Historical Period | 2019-2024 |
| Growth Rate | CAGR of XX% from 2019-2033 |
| Segmentation |
|
Table of Contents
- 1. Introduction
- 1.1. Research Scope
- 1.2. Market Segmentation
- 1.3. Research Methodology
- 1.4. Definitions and Assumptions
- 2. Executive Summary
- 2.1. Introduction
- 3. Market Dynamics
- 3.1. Introduction
- 3.2. Market Drivers
- 3.3. Market Restrains
- 3.4. Market Trends
- 4. Market Factor Analysis
- 4.1. Porters Five Forces
- 4.2. Supply/Value Chain
- 4.3. PESTEL analysis
- 4.4. Market Entropy
- 4.5. Patent/Trademark Analysis
- 5. Global Fiber Optical Interconnects Analysis, Insights and Forecast, 2019-2031
- 5.1. Market Analysis, Insights and Forecast - by Application
- 5.1.1. Data Communication
- 5.1.2. Telecommunication
- 5.2. Market Analysis, Insights and Forecast - by Types
- 5.2.1. Cable Assemblies
- 5.2.2. Connectors
- 5.2.3. Silicon Photonics Systems
- 5.2.4. PIC-based Interconnects
- 5.2.5. Optical Engines
- 5.2.6. Optical Transceivers
- 5.2.7. Free Space Optics
- 5.2.8. Fibers & Wave Guides
- 5.3. Market Analysis, Insights and Forecast - by Region
- 5.3.1. North America
- 5.3.2. South America
- 5.3.3. Europe
- 5.3.4. Middle East & Africa
- 5.3.5. Asia Pacific
- 5.1. Market Analysis, Insights and Forecast - by Application
- 6. North America Fiber Optical Interconnects Analysis, Insights and Forecast, 2019-2031
- 6.1. Market Analysis, Insights and Forecast - by Application
- 6.1.1. Data Communication
- 6.1.2. Telecommunication
- 6.2. Market Analysis, Insights and Forecast - by Types
- 6.2.1. Cable Assemblies
- 6.2.2. Connectors
- 6.2.3. Silicon Photonics Systems
- 6.2.4. PIC-based Interconnects
- 6.2.5. Optical Engines
- 6.2.6. Optical Transceivers
- 6.2.7. Free Space Optics
- 6.2.8. Fibers & Wave Guides
- 6.1. Market Analysis, Insights and Forecast - by Application
- 7. South America Fiber Optical Interconnects Analysis, Insights and Forecast, 2019-2031
- 7.1. Market Analysis, Insights and Forecast - by Application
- 7.1.1. Data Communication
- 7.1.2. Telecommunication
- 7.2. Market Analysis, Insights and Forecast - by Types
- 7.2.1. Cable Assemblies
- 7.2.2. Connectors
- 7.2.3. Silicon Photonics Systems
- 7.2.4. PIC-based Interconnects
- 7.2.5. Optical Engines
- 7.2.6. Optical Transceivers
- 7.2.7. Free Space Optics
- 7.2.8. Fibers & Wave Guides
- 7.1. Market Analysis, Insights and Forecast - by Application
- 8. Europe Fiber Optical Interconnects Analysis, Insights and Forecast, 2019-2031
- 8.1. Market Analysis, Insights and Forecast - by Application
- 8.1.1. Data Communication
- 8.1.2. Telecommunication
- 8.2. Market Analysis, Insights and Forecast - by Types
- 8.2.1. Cable Assemblies
- 8.2.2. Connectors
- 8.2.3. Silicon Photonics Systems
- 8.2.4. PIC-based Interconnects
- 8.2.5. Optical Engines
- 8.2.6. Optical Transceivers
- 8.2.7. Free Space Optics
- 8.2.8. Fibers & Wave Guides
- 8.1. Market Analysis, Insights and Forecast - by Application
- 9. Middle East & Africa Fiber Optical Interconnects Analysis, Insights and Forecast, 2019-2031
- 9.1. Market Analysis, Insights and Forecast - by Application
- 9.1.1. Data Communication
- 9.1.2. Telecommunication
- 9.2. Market Analysis, Insights and Forecast - by Types
- 9.2.1. Cable Assemblies
- 9.2.2. Connectors
- 9.2.3. Silicon Photonics Systems
- 9.2.4. PIC-based Interconnects
- 9.2.5. Optical Engines
- 9.2.6. Optical Transceivers
- 9.2.7. Free Space Optics
- 9.2.8. Fibers & Wave Guides
- 9.1. Market Analysis, Insights and Forecast - by Application
- 10. Asia Pacific Fiber Optical Interconnects Analysis, Insights and Forecast, 2019-2031
- 10.1. Market Analysis, Insights and Forecast - by Application
- 10.1.1. Data Communication
- 10.1.2. Telecommunication
- 10.2. Market Analysis, Insights and Forecast - by Types
- 10.2.1. Cable Assemblies
- 10.2.2. Connectors
- 10.2.3. Silicon Photonics Systems
- 10.2.4. PIC-based Interconnects
- 10.2.5. Optical Engines
- 10.2.6. Optical Transceivers
- 10.2.7. Free Space Optics
- 10.2.8. Fibers & Wave Guides
- 10.1. Market Analysis, Insights and Forecast - by Application
- 11. Competitive Analysis
- 11.1. Global Market Share Analysis 2024
- 11.2. Company Profiles
- 11.2.1 Mellanox Technologies
- 11.2.1.1. Overview
- 11.2.1.2. Products
- 11.2.1.3. SWOT Analysis
- 11.2.1.4. Recent Developments
- 11.2.1.5. Financials (Based on Availability)
- 11.2.2 Ltd.
- 11.2.2.1. Overview
- 11.2.2.2. Products
- 11.2.2.3. SWOT Analysis
- 11.2.2.4. Recent Developments
- 11.2.2.5. Financials (Based on Availability)
- 11.2.3 Finisar Corporation
- 11.2.3.1. Overview
- 11.2.3.2. Products
- 11.2.3.3. SWOT Analysis
- 11.2.3.4. Recent Developments
- 11.2.3.5. Financials (Based on Availability)
- 11.2.4 Molex
- 11.2.4.1. Overview
- 11.2.4.2. Products
- 11.2.4.3. SWOT Analysis
- 11.2.4.4. Recent Developments
- 11.2.4.5. Financials (Based on Availability)
- 11.2.5 LLC
- 11.2.5.1. Overview
- 11.2.5.2. Products
- 11.2.5.3. SWOT Analysis
- 11.2.5.4. Recent Developments
- 11.2.5.5. Financials (Based on Availability)
- 11.2.6 Acacia Communications Inc.
- 11.2.6.1. Overview
- 11.2.6.2. Products
- 11.2.6.3. SWOT Analysis
- 11.2.6.4. Recent Developments
- 11.2.6.5. Financials (Based on Availability)
- 11.2.7 Oclaro
- 11.2.7.1. Overview
- 11.2.7.2. Products
- 11.2.7.3. SWOT Analysis
- 11.2.7.4. Recent Developments
- 11.2.7.5. Financials (Based on Availability)
- 11.2.8 Inc.
- 11.2.8.1. Overview
- 11.2.8.2. Products
- 11.2.8.3. SWOT Analysis
- 11.2.8.4. Recent Developments
- 11.2.8.5. Financials (Based on Availability)
- 11.2.9 Sumitomo Electric Industries
- 11.2.9.1. Overview
- 11.2.9.2. Products
- 11.2.9.3. SWOT Analysis
- 11.2.9.4. Recent Developments
- 11.2.9.5. Financials (Based on Availability)
- 11.2.10 Ltd.
- 11.2.10.1. Overview
- 11.2.10.2. Products
- 11.2.10.3. SWOT Analysis
- 11.2.10.4. Recent Developments
- 11.2.10.5. Financials (Based on Availability)
- 11.2.11 Broadcom Limited
- 11.2.11.1. Overview
- 11.2.11.2. Products
- 11.2.11.3. SWOT Analysis
- 11.2.11.4. Recent Developments
- 11.2.11.5. Financials (Based on Availability)
- 11.2.12 TE Connectivity Ltd
- 11.2.12.1. Overview
- 11.2.12.2. Products
- 11.2.12.3. SWOT Analysis
- 11.2.12.4. Recent Developments
- 11.2.12.5. Financials (Based on Availability)
- 11.2.13 Amphenol FCI
- 11.2.13.1. Overview
- 11.2.13.2. Products
- 11.2.13.3. SWOT Analysis
- 11.2.13.4. Recent Developments
- 11.2.13.5. Financials (Based on Availability)
- 11.2.14 Juniper Networks
- 11.2.14.1. Overview
- 11.2.14.2. Products
- 11.2.14.3. SWOT Analysis
- 11.2.14.4. Recent Developments
- 11.2.14.5. Financials (Based on Availability)
- 11.2.15 Inc.
- 11.2.15.1. Overview
- 11.2.15.2. Products
- 11.2.15.3. SWOT Analysis
- 11.2.15.4. Recent Developments
- 11.2.15.5. Financials (Based on Availability)
- 11.2.16 Infinera Corporation
- 11.2.16.1. Overview
- 11.2.16.2. Products
- 11.2.16.3. SWOT Analysis
- 11.2.16.4. Recent Developments
- 11.2.16.5. Financials (Based on Availability)
- 11.2.17 Fujitsu Ltd.
- 11.2.17.1. Overview
- 11.2.17.2. Products
- 11.2.17.3. SWOT Analysis
- 11.2.17.4. Recent Developments
- 11.2.17.5. Financials (Based on Availability)
- 11.2.1 Mellanox Technologies
List of Figures
- Figure 1: Global Fiber Optical Interconnects Revenue Breakdown (million, %) by Region 2024 & 2032
- Figure 2: North America Fiber Optical Interconnects Revenue (million), by Application 2024 & 2032
- Figure 3: North America Fiber Optical Interconnects Revenue Share (%), by Application 2024 & 2032
- Figure 4: North America Fiber Optical Interconnects Revenue (million), by Types 2024 & 2032
- Figure 5: North America Fiber Optical Interconnects Revenue Share (%), by Types 2024 & 2032
- Figure 6: North America Fiber Optical Interconnects Revenue (million), by Country 2024 & 2032
- Figure 7: North America Fiber Optical Interconnects Revenue Share (%), by Country 2024 & 2032
- Figure 8: South America Fiber Optical Interconnects Revenue (million), by Application 2024 & 2032
- Figure 9: South America Fiber Optical Interconnects Revenue Share (%), by Application 2024 & 2032
- Figure 10: South America Fiber Optical Interconnects Revenue (million), by Types 2024 & 2032
- Figure 11: South America Fiber Optical Interconnects Revenue Share (%), by Types 2024 & 2032
- Figure 12: South America Fiber Optical Interconnects Revenue (million), by Country 2024 & 2032
- Figure 13: South America Fiber Optical Interconnects Revenue Share (%), by Country 2024 & 2032
- Figure 14: Europe Fiber Optical Interconnects Revenue (million), by Application 2024 & 2032
- Figure 15: Europe Fiber Optical Interconnects Revenue Share (%), by Application 2024 & 2032
- Figure 16: Europe Fiber Optical Interconnects Revenue (million), by Types 2024 & 2032
- Figure 17: Europe Fiber Optical Interconnects Revenue Share (%), by Types 2024 & 2032
- Figure 18: Europe Fiber Optical Interconnects Revenue (million), by Country 2024 & 2032
- Figure 19: Europe Fiber Optical Interconnects Revenue Share (%), by Country 2024 & 2032
- Figure 20: Middle East & Africa Fiber Optical Interconnects Revenue (million), by Application 2024 & 2032
- Figure 21: Middle East & Africa Fiber Optical Interconnects Revenue Share (%), by Application 2024 & 2032
- Figure 22: Middle East & Africa Fiber Optical Interconnects Revenue (million), by Types 2024 & 2032
- Figure 23: Middle East & Africa Fiber Optical Interconnects Revenue Share (%), by Types 2024 & 2032
- Figure 24: Middle East & Africa Fiber Optical Interconnects Revenue (million), by Country 2024 & 2032
- Figure 25: Middle East & Africa Fiber Optical Interconnects Revenue Share (%), by Country 2024 & 2032
- Figure 26: Asia Pacific Fiber Optical Interconnects Revenue (million), by Application 2024 & 2032
- Figure 27: Asia Pacific Fiber Optical Interconnects Revenue Share (%), by Application 2024 & 2032
- Figure 28: Asia Pacific Fiber Optical Interconnects Revenue (million), by Types 2024 & 2032
- Figure 29: Asia Pacific Fiber Optical Interconnects Revenue Share (%), by Types 2024 & 2032
- Figure 30: Asia Pacific Fiber Optical Interconnects Revenue (million), by Country 2024 & 2032
- Figure 31: Asia Pacific Fiber Optical Interconnects Revenue Share (%), by Country 2024 & 2032
List of Tables
- Table 1: Global Fiber Optical Interconnects Revenue million Forecast, by Region 2019 & 2032
- Table 2: Global Fiber Optical Interconnects Revenue million Forecast, by Application 2019 & 2032
- Table 3: Global Fiber Optical Interconnects Revenue million Forecast, by Types 2019 & 2032
- Table 4: Global Fiber Optical Interconnects Revenue million Forecast, by Region 2019 & 2032
- Table 5: Global Fiber Optical Interconnects Revenue million Forecast, by Application 2019 & 2032
- Table 6: Global Fiber Optical Interconnects Revenue million Forecast, by Types 2019 & 2032
- Table 7: Global Fiber Optical Interconnects Revenue million Forecast, by Country 2019 & 2032
- Table 8: United States Fiber Optical Interconnects Revenue (million) Forecast, by Application 2019 & 2032
- Table 9: Canada Fiber Optical Interconnects Revenue (million) Forecast, by Application 2019 & 2032
- Table 10: Mexico Fiber Optical Interconnects Revenue (million) Forecast, by Application 2019 & 2032
- Table 11: Global Fiber Optical Interconnects Revenue million Forecast, by Application 2019 & 2032
- Table 12: Global Fiber Optical Interconnects Revenue million Forecast, by Types 2019 & 2032
- Table 13: Global Fiber Optical Interconnects Revenue million Forecast, by Country 2019 & 2032
- Table 14: Brazil Fiber Optical Interconnects Revenue (million) Forecast, by Application 2019 & 2032
- Table 15: Argentina Fiber Optical Interconnects Revenue (million) Forecast, by Application 2019 & 2032
- Table 16: Rest of South America Fiber Optical Interconnects Revenue (million) Forecast, by Application 2019 & 2032
- Table 17: Global Fiber Optical Interconnects Revenue million Forecast, by Application 2019 & 2032
- Table 18: Global Fiber Optical Interconnects Revenue million Forecast, by Types 2019 & 2032
- Table 19: Global Fiber Optical Interconnects Revenue million Forecast, by Country 2019 & 2032
- Table 20: United Kingdom Fiber Optical Interconnects Revenue (million) Forecast, by Application 2019 & 2032
- Table 21: Germany Fiber Optical Interconnects Revenue (million) Forecast, by Application 2019 & 2032
- Table 22: France Fiber Optical Interconnects Revenue (million) Forecast, by Application 2019 & 2032
- Table 23: Italy Fiber Optical Interconnects Revenue (million) Forecast, by Application 2019 & 2032
- Table 24: Spain Fiber Optical Interconnects Revenue (million) Forecast, by Application 2019 & 2032
- Table 25: Russia Fiber Optical Interconnects Revenue (million) Forecast, by Application 2019 & 2032
- Table 26: Benelux Fiber Optical Interconnects Revenue (million) Forecast, by Application 2019 & 2032
- Table 27: Nordics Fiber Optical Interconnects Revenue (million) Forecast, by Application 2019 & 2032
- Table 28: Rest of Europe Fiber Optical Interconnects Revenue (million) Forecast, by Application 2019 & 2032
- Table 29: Global Fiber Optical Interconnects Revenue million Forecast, by Application 2019 & 2032
- Table 30: Global Fiber Optical Interconnects Revenue million Forecast, by Types 2019 & 2032
- Table 31: Global Fiber Optical Interconnects Revenue million Forecast, by Country 2019 & 2032
- Table 32: Turkey Fiber Optical Interconnects Revenue (million) Forecast, by Application 2019 & 2032
- Table 33: Israel Fiber Optical Interconnects Revenue (million) Forecast, by Application 2019 & 2032
- Table 34: GCC Fiber Optical Interconnects Revenue (million) Forecast, by Application 2019 & 2032
- Table 35: North Africa Fiber Optical Interconnects Revenue (million) Forecast, by Application 2019 & 2032
- Table 36: South Africa Fiber Optical Interconnects Revenue (million) Forecast, by Application 2019 & 2032
- Table 37: Rest of Middle East & Africa Fiber Optical Interconnects Revenue (million) Forecast, by Application 2019 & 2032
- Table 38: Global Fiber Optical Interconnects Revenue million Forecast, by Application 2019 & 2032
- Table 39: Global Fiber Optical Interconnects Revenue million Forecast, by Types 2019 & 2032
- Table 40: Global Fiber Optical Interconnects Revenue million Forecast, by Country 2019 & 2032
- Table 41: China Fiber Optical Interconnects Revenue (million) Forecast, by Application 2019 & 2032
- Table 42: India Fiber Optical Interconnects Revenue (million) Forecast, by Application 2019 & 2032
- Table 43: Japan Fiber Optical Interconnects Revenue (million) Forecast, by Application 2019 & 2032
- Table 44: South Korea Fiber Optical Interconnects Revenue (million) Forecast, by Application 2019 & 2032
- Table 45: ASEAN Fiber Optical Interconnects Revenue (million) Forecast, by Application 2019 & 2032
- Table 46: Oceania Fiber Optical Interconnects Revenue (million) Forecast, by Application 2019 & 2032
- Table 47: Rest of Asia Pacific Fiber Optical Interconnects Revenue (million) Forecast, by Application 2019 & 2032
Frequently Asked Questions
1. What is the projected Compound Annual Growth Rate (CAGR) of the Fiber Optical Interconnects?
The projected CAGR is approximately XX%.
2. Which companies are prominent players in the Fiber Optical Interconnects?
Key companies in the market include Mellanox Technologies, Ltd., Finisar Corporation, Molex, LLC, Acacia Communications Inc., Oclaro, Inc., Sumitomo Electric Industries, Ltd., Broadcom Limited, TE Connectivity Ltd, Amphenol FCI, Juniper Networks, Inc., Infinera Corporation, Fujitsu Ltd..
3. What are the main segments of the Fiber Optical Interconnects?
The market segments include Application, Types.
4. Can you provide details about the market size?
The market size is estimated to be USD XXX million as of 2022.
5. What are some drivers contributing to market growth?
N/A
6. What are the notable trends driving market growth?
N/A
7. Are there any restraints impacting market growth?
N/A
8. Can you provide examples of recent developments in the market?
N/A
9. What pricing options are available for accessing the report?
Pricing options include single-user, multi-user, and enterprise licenses priced at USD 2900.00, USD 4350.00, and USD 5800.00 respectively.
10. Is the market size provided in terms of value or volume?
The market size is provided in terms of value, measured in million.
11. Are there any specific market keywords associated with the report?
Yes, the market keyword associated with the report is "Fiber Optical Interconnects," which aids in identifying and referencing the specific market segment covered.
12. How do I determine which pricing option suits my needs best?
The pricing options vary based on user requirements and access needs. Individual users may opt for single-user licenses, while businesses requiring broader access may choose multi-user or enterprise licenses for cost-effective access to the report.
13. Are there any additional resources or data provided in the Fiber Optical Interconnects report?
While the report offers comprehensive insights, it's advisable to review the specific contents or supplementary materials provided to ascertain if additional resources or data are available.
14. How can I stay updated on further developments or reports in the Fiber Optical Interconnects?
To stay informed about further developments, trends, and reports in the Fiber Optical Interconnects, consider subscribing to industry newsletters, following relevant companies and organizations, or regularly checking reputable industry news sources and publications.
Methodology
Step 1 - Identification of Relevant Samples Size from Population Database


Step 2 - Approaches for Defining Global Market Size (Value, Volume* & Price*)

Note*: In applicable scenarios
Step 3 - Data Sources
Primary Research
- Web Analytics
- Survey Reports
- Research Institute
- Latest Research Reports
- Opinion Leaders
Secondary Research
- Annual Reports
- White Paper
- Latest Press Release
- Industry Association
- Paid Database
- Investor Presentations

Step 4 - Data Triangulation
Involves using different sources of information in order to increase the validity of a study
These sources are likely to be stakeholders in a program - participants, other researchers, program staff, other community members, and so on.
Then we put all data in single framework & apply various statistical tools to find out the dynamic on the market.
During the analysis stage, feedback from the stakeholder groups would be compared to determine areas of agreement as well as areas of divergence
