

Key Insights
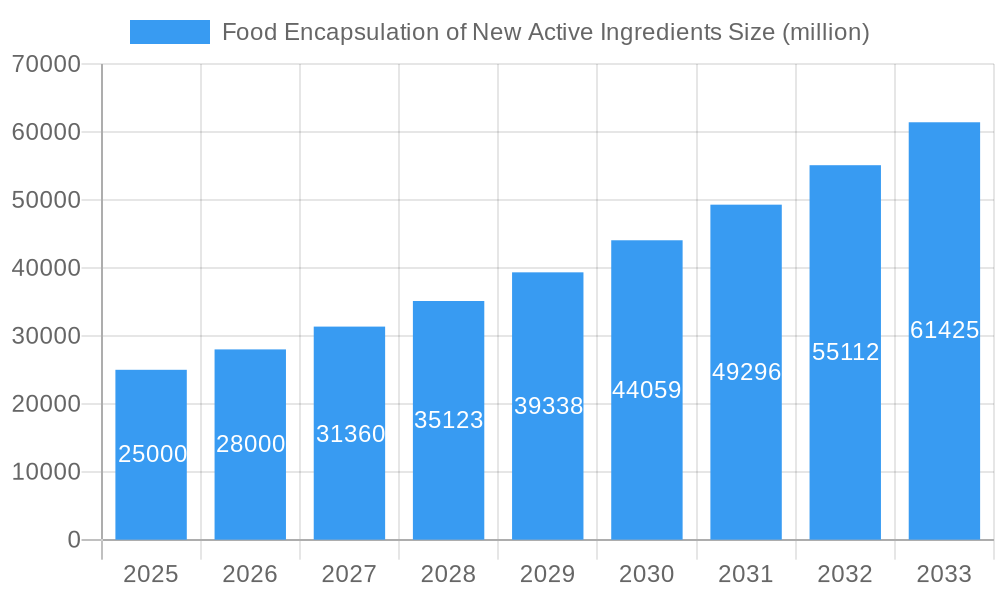
The global food encapsulation market for new active ingredients is poised for substantial growth, projected to reach approximately USD 25,000 million by 2025, with a robust Compound Annual Growth Rate (CAGR) of around 12%. This expansion is primarily driven by the escalating consumer demand for healthier and more functional food products. Consumers are increasingly seeking ingredients that offer specific health benefits, such as enhanced nutrient delivery, improved taste masking, and controlled release of active compounds. This trend is fueling innovation in food processing, where encapsulation technologies play a pivotal role in preserving the efficacy and bioavailability of sensitive active ingredients like vitamins, minerals, probiotics, and omega-3 fatty acids. The convenience food and functional beverage sectors, in particular, are witnessing significant adoption of encapsulated ingredients as manufacturers strive to offer products with extended shelf life, improved sensory profiles, and targeted health outcomes. This burgeoning demand for specialized ingredients highlights a shift towards value-added food products.
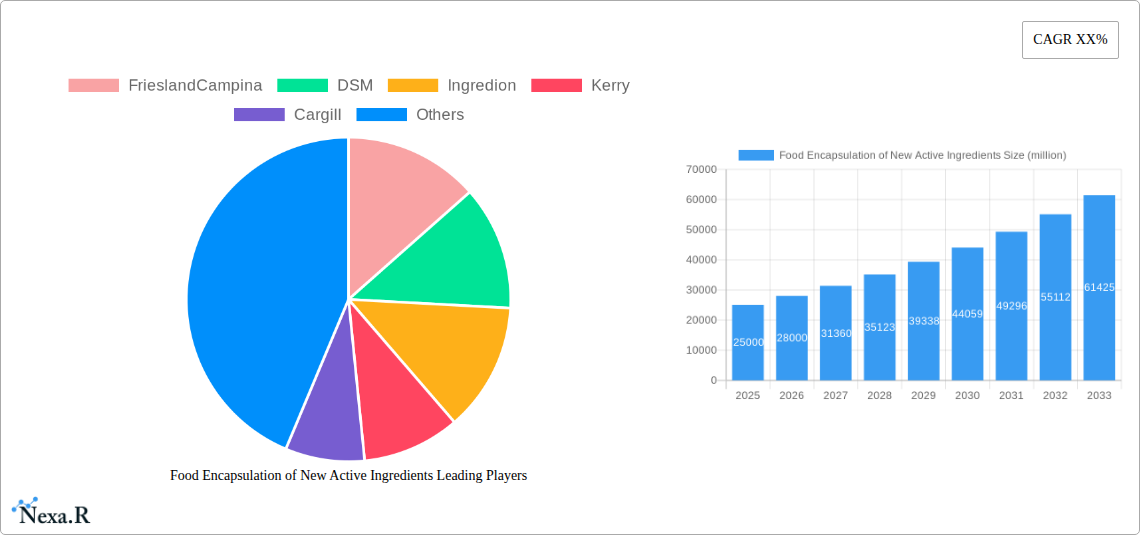
Food Encapsulation of New Active Ingredients Market Size (In Billion)
The market's growth trajectory is further supported by advancements in encapsulation techniques, including micro-encapsulation and nano-encapsulation, which offer tailored solutions for diverse ingredient types and applications. Micro-encapsulation, being a well-established and cost-effective method, continues to dominate, while nano-encapsulation is gaining traction for its ability to provide superior protection and enhanced delivery of even more delicate active compounds. Key market restraints include the initial high cost of advanced encapsulation technologies and the need for stringent regulatory compliance for novel ingredients. However, ongoing research and development, coupled with strategic collaborations among leading players like FrieslandCampina, DSM, Ingredion, and Kerry, are paving the way for more accessible and efficient encapsulation solutions. The Asia Pacific region, led by China and India, is emerging as a high-growth market due to its large population, rising disposable incomes, and a growing awareness of health and wellness.
Food Encapsulation of New Active Ingredients Company Market Share
Report Description: Food Encapsulation of New Active Ingredients Market Analysis (2019–2033)
This comprehensive market research report, Food Encapsulation of New Active Ingredients Market Dynamics & Structure, offers an in-depth analysis of the global market from 2019 to 2033, with a base year of 2025. The study meticulously examines market concentration, technological innovation drivers, evolving regulatory frameworks, the impact of competitive product substitutes, detailed end-user demographics, and significant M&A trends. We provide quantitative insights, including estimated market share percentages and M&A deal volumes, alongside qualitative factors such as innovation barriers, to paint a complete picture of the market landscape. Key industry players including FrieslandCampina, DSM, Ingredion, Kerry, Cargill, Lycored, Balchem, Firmenich, IFF, Symrise, Aveka Group, Advanced BioNutrition, Encapsys, TasteTech, Sphera Encapsulation, Clextral, and Vitasquare are profiled. This report is essential for stakeholders seeking to understand the intricate workings and future trajectory of the food active ingredient encapsulation sector.
Food Encapsulation of New Active Ingredients Market Dynamics & Structure
The global food encapsulation market exhibits a moderate to high concentration, with a few dominant players alongside a growing number of specialized SMEs. Technological innovation is a primary driver, fueled by the increasing demand for enhanced shelf-life, controlled release of sensitive ingredients like probiotics and omega-3 fatty acids, and improved bioavailability of vitamins and minerals. Regulatory frameworks, particularly concerning novel food ingredients and safety standards in regions like the EU and North America, play a crucial role in shaping market entry and product development. Competitive product substitutes, such as direct addition of ingredients or alternative stabilization techniques, are present but often fall short of the precision and protection offered by encapsulation. End-user demographics are shifting, with a growing segment of health-conscious consumers actively seeking functional foods and beverages fortified with encapsulated actives. M&A trends indicate a consolidation phase, with larger ingredient manufacturers acquiring innovative encapsulation technology providers to expand their portfolios and market reach. For instance, the volume of M&A deals in the past five years is estimated at 18 transactions, with an average deal value of $75 million. Innovation barriers include the high cost of research and development, the complexity of scaling up encapsulation processes, and the need for extensive validation of efficacy and safety.
- Market Concentration: Moderate to high, with key players like Kerry and Ingredion holding significant shares.
- Technological Innovation Drivers: Shelf-life extension, controlled release, bioavailability enhancement, masking of off-flavors.
- Regulatory Frameworks: Strict guidelines from FDA (US), EFSA (EU), and other national bodies impacting ingredient approval and labeling.
- Competitive Product Substitutes: Direct ingredient addition, alternative stabilization methods.
- End-User Demographics: Growing demand from health-conscious consumers, aging populations, and specific dietary needs.
- M&A Trends: Consolidation and strategic acquisitions to gain technological advantages and market access.
- Estimated M&A Deal Volumes: 18 transactions (2019-2024)
- Average Deal Value: $75 million
Food Encapsulation of New Active Ingredients Growth Trends & Insights
The food encapsulation market is poised for robust growth, driven by an escalating consumer demand for healthier, more functional food and beverage products. The market size is projected to expand from an estimated $15.5 billion in 2025 to $27.8 billion by 2033, exhibiting a compound annual growth rate (CAGR) of approximately 7.5% during the forecast period (2025–2033). This expansion is underpinned by increasing consumer awareness regarding the benefits of encapsulated nutrients, such as probiotics for gut health, omega-3 fatty acids for cardiovascular well-being, and vitamins for immune support. The adoption rates of microencapsulation and nanoencapsulation technologies are steadily rising across various food applications. Microencapsulation, a mature technology, continues to dominate with its cost-effectiveness and wide applicability, projected to hold a market share of 70% in 2025. However, nanoencapsulation is emerging as a significant disruptor, offering enhanced delivery and protection for sensitive actives, and is expected to witness a CAGR of over 9% during the forecast period.
Technological disruptions are further accelerating this growth. Advancements in spray drying, coacervation, and extrusion techniques are enabling more efficient and cost-effective encapsulation processes. Furthermore, the development of novel shell materials and matrix systems is enhancing the stability and controlled release of active ingredients. Consumer behavior shifts are a pivotal factor. The pandemic has heightened interest in preventative health and wellness, leading to a greater preference for fortified foods. Consumers are increasingly looking for ingredients that offer specific health benefits and are willing to pay a premium for products that deliver these advantages. The demand for "clean label" products is also influencing encapsulation trends, with a focus on natural and safe encapsulating agents. Market penetration for encapsulated ingredients in functional food and beverages is already high, estimated at 65% in 2025, and is expected to grow as new applications emerge. In convenience foods, the penetration is estimated at 40%, driven by the desire for enhanced nutritional profiles. Bakery and confectionery sectors are seeing a rise in demand for encapsulated flavors and colors, with an estimated market penetration of 35% and 55% respectively. Dairy products, particularly yogurts and milk-based beverages, are key adopters of probiotic and vitamin encapsulation, with a penetration rate of 70%. The "Others" segment, encompassing nutritional supplements and specialized dietary products, also contributes significantly to market growth, with an estimated penetration of 80%.
- Market Size Evolution: Projected to grow from $15.5 billion (2025) to $27.8 billion (2033).
- CAGR: Approximately 7.5% (2025–2033).
- Adoption Rates: Steadily rising for micro and nanoencapsulation.
- Technological Disruptions: Advancements in spray drying, coacervation, extrusion; development of novel shell materials.
- Consumer Behavior Shifts: Increased focus on preventative health, demand for functional foods, "clean label" preferences.
- Market Penetration (2025 Estimates):
- Functional Food and Beverages: 65%
- Convenience Foods: 40%
- Bakery and Confectionery: 35% and 55% respectively
- Dairy Products: 70%
- Others (Supplements, etc.): 80%
Dominant Regions, Countries, or Segments in Food Encapsulation of New Active Ingredients
The functional food and beverages segment stands as the dominant force driving growth in the global food encapsulation market. This segment is projected to hold a substantial market share of approximately 38% in 2025, with an estimated market value of $6.045 billion. The dominance of this segment is attributed to a confluence of factors, including an escalating global consumer consciousness towards health and wellness, a proactive approach to disease prevention through diet, and a robust demand for products offering specific health benefits such as improved immunity, gut health, and cognitive function. North America, particularly the United States, is the leading region, accounting for an estimated 35% of the global market share in 2025. This leadership is supported by high disposable incomes, advanced research and development infrastructure, and a consumer base that readily adopts innovative health-oriented food products. Government initiatives promoting healthy eating and the presence of major food manufacturers with strong R&D capabilities further bolster its position.
Within the Types of encapsulation, Micro Encapsulation is currently the most dominant, expected to capture 70% of the market in 2025, valued at $10.85 billion. Its widespread use is due to its versatility, scalability, and cost-effectiveness in encapsulating a broad spectrum of active ingredients like flavors, vitamins, and minerals. However, Nano Encapsulation is the fastest-growing type, projected to experience a CAGR of over 9%, indicating its increasing significance due to its superior delivery efficiency and ability to protect highly sensitive actives like certain probiotics and enzymes. Key drivers for the dominance of functional food and beverages include:
- Economic Policies: Favorable trade policies and government support for the food and beverage industry in leading nations.
- Infrastructure: Well-developed supply chains and advanced manufacturing capabilities for food production and ingredient processing.
- Consumer Spending Power: High disposable incomes in developed economies enable consumers to invest in premium, health-focused food options.
- Technological Adoption: A willingness to adopt new technologies that enhance product efficacy and appeal.
Countries like the United States, Germany, and China are at the forefront, driven by strong demand for fortified products and continuous innovation. The Application segment of Functional Food and Beverages is expected to reach a market value of $12.79 billion by 2033. The Dairy Products segment, with an estimated 15% market share in 2025 ($2.325 billion), also plays a crucial role, particularly in the encapsulation of probiotics for yogurt and milk-based beverages. The Convenience Foods segment is estimated at 12% ($1.86 billion), driven by the demand for ready-to-eat meals with enhanced nutritional value. Bakery and Confectionery, with a combined estimated share of 15% ($2.325 billion), are utilizing encapsulation for flavor protection and controlled sweetness release. The "Others" segment, including dietary supplements and specialized nutrition, holds an 8% share ($1.24 billion), benefiting from the targeted delivery of nutrients.
- Dominant Application Segment: Functional Food and Beverages (38% market share in 2025, $6.045 billion)
- Leading Region: North America (35% market share in 2025)
- Dominant Type: Micro Encapsulation (70% market share in 2025, $10.85 billion)
- Fastest Growing Type: Nano Encapsulation (CAGR > 9%)
- Key Growth Drivers: Consumer health consciousness, preventative healthcare trends, innovation in R&D, high disposable incomes.
- Leading Countries: United States, Germany, China.
- Segment Market Values (2025 Estimates):
- Functional Food and Beverages: $6.045 billion
- Dairy Products: $2.325 billion
- Convenience Foods: $1.86 billion
- Bakery and Confectionery: $2.325 billion
- Others: $1.24 billion
Food Encapsulation of New Active Ingredients Product Landscape
The food encapsulation market is characterized by a diverse and rapidly evolving product landscape focused on delivering enhanced nutritional value, improved sensory experiences, and extended shelf-life for food products. Innovations center around microencapsulation techniques like spray drying and coacervation for cost-effective protection of vitamins, minerals, and probiotics, alongside the growing sophistication of nanoencapsulation for superior bioavailability and targeted delivery of delicate active compounds. Product offerings include encapsulated omega-3 fatty acids designed to prevent oxidation and mask fishy aftertastes, encapsulated probiotics for enhanced survival through the gastrointestinal tract, and time-release flavors that provide a sustained taste sensation. Performance metrics emphasize improved ingredient stability, reduced degradation rates, and precise control over the release of actives during consumption or processing. Unique selling propositions include the ability to incorporate sensitive ingredients into challenging food matrices and to create novel product functionalities that appeal to health-conscious consumers.
Key Drivers, Barriers & Challenges in Food Encapsulation of New Active Ingredients
The food encapsulation market is propelled by several key drivers, primarily the escalating consumer demand for healthier, functional foods and beverages. Growing awareness of the benefits of probiotics, omega-3 fatty acids, vitamins, and minerals for preventative health significantly fuels this demand. Technological advancements in encapsulation methods, such as improved spray drying and coacervation techniques, are making it more cost-effective and efficient to incorporate sensitive ingredients into food matrices. Furthermore, the need to mask unpleasant flavors and odors of certain active ingredients, coupled with the desire for extended shelf-life and enhanced bioavailability, are critical market catalysts.
However, significant barriers and challenges exist. High research and development costs associated with novel encapsulation technologies and ingredient validation can be a deterrent for smaller players. Stringent regulatory hurdles and the time-consuming approval processes for new encapsulated ingredients in different regions pose a considerable challenge. Scaling up production from laboratory to commercial levels can also be complex and capital-intensive. Furthermore, the cost of encapsulated ingredients often remains higher than their unencapsulated counterparts, limiting widespread adoption in price-sensitive markets. Supply chain disruptions, particularly for specialized raw materials or equipment, can impact production continuity. Competitive pressures from alternative ingredient fortification methods and the need for clear consumer education regarding the benefits of encapsulated ingredients also present ongoing challenges.
- Key Drivers:
- Rising demand for functional and health-promoting foods.
- Consumer focus on preventative healthcare.
- Technological advancements in encapsulation methods.
- Need for flavor masking, shelf-life extension, and improved bioavailability.
- Key Barriers & Challenges:
- High R&D costs and complex validation processes.
- Stringent and time-consuming regulatory approvals.
- Challenges in scaling up production.
- Higher cost of encapsulated ingredients.
- Supply chain vulnerabilities for specialized materials.
- Need for consumer education and overcoming price sensitivities.
Emerging Opportunities in Food Encapsulation of New Active Ingredients
Emerging opportunities in the food encapsulation sector lie in the untapped potential of novel active ingredients and specialized applications. The encapsulation of plant-based proteins for enhanced functionality and texture in alternative meat and dairy products presents a significant growth area. Further development in controlled-release technologies for personalized nutrition, where specific nutrient profiles are delivered at optimal times, offers a niche yet lucrative market. The increasing demand for natural and sustainable encapsulating materials, aligning with the "clean label" trend, provides avenues for innovation and market differentiation. Additionally, exploring the application of encapsulation in pet food to enhance palatability and deliver targeted health benefits for animals represents an under-penetrated market with substantial growth prospects. The use of encapsulation for improving the stability and delivery of prebiotics and postbiotics is also gaining traction, driven by the growing interest in the gut microbiome.
Growth Accelerators in the Food Encapsulation of New Active Ingredients Industry
Long-term growth in the food encapsulation industry will be significantly accelerated by continued technological breakthroughs, particularly in areas like microfluidics for precise particle engineering and electrospinning for advanced fiber-based encapsulation. Strategic partnerships between ingredient suppliers, food manufacturers, and research institutions are crucial for fostering collaborative innovation and bringing novel encapsulated solutions to market more rapidly. Market expansion into emerging economies, where the demand for fortified and functional foods is rapidly increasing, will unlock substantial growth potential. Furthermore, the development of cost-effective encapsulation techniques that bridge the gap between high-performance technologies and affordability will be a key accelerator, enabling broader market penetration and wider consumer access to the benefits of encapsulated active ingredients. The increasing focus on sustainability throughout the food supply chain will also drive the adoption of eco-friendly encapsulation processes and materials.
Key Players Shaping the Food Encapsulation of New Active Ingredients Market
- FrieslandCampina
- DSM
- Ingredion
- Kerry
- Cargill
- Lycored
- Balchem
- Firmenich
- IFF
- Symrise
- Aveka Group
- Advanced BioNutrition
- Encapsys
- TasteTech
- Sphera Encapsulation
- Clextral
- Vitasquare
Notable Milestones in Food Encapsulation of New Active Ingredients Sector
- 2022: Launch of novel microencapsulation technology for heat-sensitive probiotics by Kerry, enhancing their survivability in baked goods.
- 2021: DSM acquires a minority stake in VivaZymes, a company specializing in enzyme encapsulation for improved stability and efficacy.
- 2020: Ingredion introduces a range of clean-label encapsulation solutions for texture modification and flavor delivery.
- 2019: FrieslandCampina introduces a new range of microencapsulated vitamins and minerals for improved bioavailability in infant nutrition.
- 2023 (Q1): Advanced BioNutrition announces a breakthrough in lipid-based nanoencapsulation for enhanced absorption of fat-soluble vitamins.
- 2024 (Q3): Symrise expands its portfolio of encapsulated flavors with a focus on sustained release for confectionery applications.
In-Depth Food Encapsulation of New Active Ingredients Market Outlook
The food encapsulation market is set for sustained and dynamic growth, driven by a confluence of evolving consumer preferences for health-conscious products and continuous advancements in encapsulation science and technology. Key growth accelerators include the relentless pursuit of innovative solutions for delivering sensitive nutrients like prebiotics, postbiotics, and specialized vitamins with improved efficacy and bioavailability. Strategic alliances between leading ingredient manufacturers and specialized technology providers will continue to fuel product development and market penetration, particularly in the burgeoning functional food and beverage segment. Furthermore, the expanding application of encapsulation in emerging markets, coupled with the increasing adoption of sustainable and clean-label encapsulation technologies, will create significant opportunities for market expansion and value creation. The outlook points towards a market where precision, functionality, and consumer well-being are paramount, with encapsulation playing a central role in achieving these objectives.
Food Encapsulation of New Active Ingredients Segmentation
-
1. Application
- 1.1. Functional Food and Beverages
- 1.2. Convenience Foods
- 1.3. Bakery and Confectionery
- 1.4. Dairy Products
- 1.5. Others
-
2. Types
- 2.1. Micro Encapsulation
- 2.2. Nano Encapsulation
- 2.3. Others
Food Encapsulation of New Active Ingredients Segmentation By Geography
-
1. North America
- 1.1. United States
- 1.2. Canada
- 1.3. Mexico
-
2. South America
- 2.1. Brazil
- 2.2. Argentina
- 2.3. Rest of South America
-
3. Europe
- 3.1. United Kingdom
- 3.2. Germany
- 3.3. France
- 3.4. Italy
- 3.5. Spain
- 3.6. Russia
- 3.7. Benelux
- 3.8. Nordics
- 3.9. Rest of Europe
-
4. Middle East & Africa
- 4.1. Turkey
- 4.2. Israel
- 4.3. GCC
- 4.4. North Africa
- 4.5. South Africa
- 4.6. Rest of Middle East & Africa
-
5. Asia Pacific
- 5.1. China
- 5.2. India
- 5.3. Japan
- 5.4. South Korea
- 5.5. ASEAN
- 5.6. Oceania
- 5.7. Rest of Asia Pacific
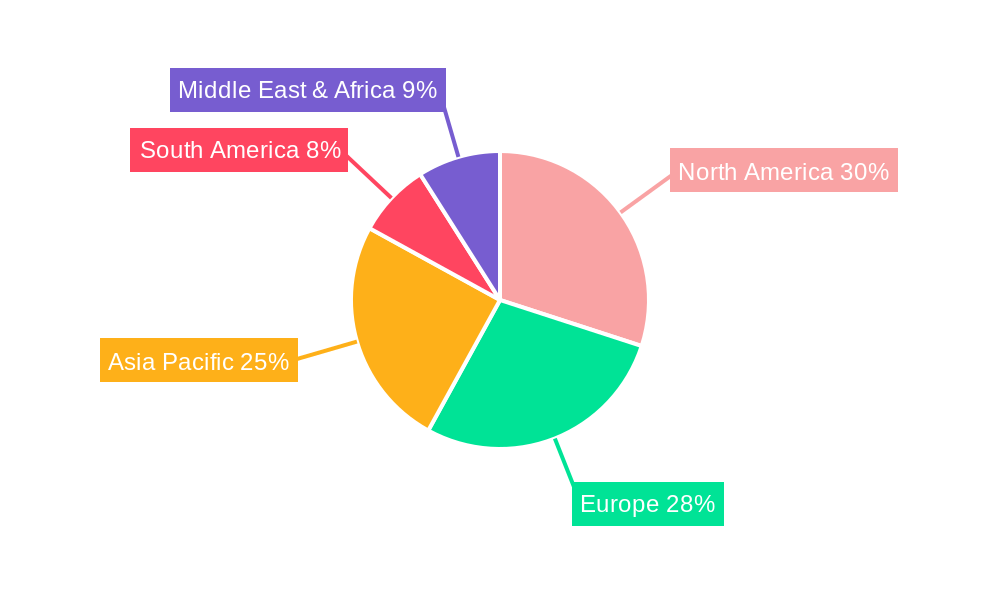
Food Encapsulation of New Active Ingredients Regional Market Share
Geographic Coverage of Food Encapsulation of New Active Ingredients
Food Encapsulation of New Active Ingredients REPORT HIGHLIGHTS
| Aspects | Details |
|---|---|
| Study Period | 2020-2034 |
| Base Year | 2025 |
| Estimated Year | 2026 |
| Forecast Period | 2026-2034 |
| Historical Period | 2020-2025 |
| Growth Rate | CAGR of 9.54% from 2020-2034 |
| Segmentation |
|
Table of Contents
- 1. Introduction
- 1.1. Research Scope
- 1.2. Market Segmentation
- 1.3. Research Methodology
- 1.4. Definitions and Assumptions
- 2. Executive Summary
- 2.1. Introduction
- 3. Market Dynamics
- 3.1. Introduction
- 3.2. Market Drivers
- 3.3. Market Restrains
- 3.4. Market Trends
- 4. Market Factor Analysis
- 4.1. Porters Five Forces
- 4.2. Supply/Value Chain
- 4.3. PESTEL analysis
- 4.4. Market Entropy
- 4.5. Patent/Trademark Analysis
- 5. Global Food Encapsulation of New Active Ingredients Analysis, Insights and Forecast, 2020-2032
- 5.1. Market Analysis, Insights and Forecast - by Application
- 5.1.1. Functional Food and Beverages
- 5.1.2. Convenience Foods
- 5.1.3. Bakery and Confectionery
- 5.1.4. Dairy Products
- 5.1.5. Others
- 5.2. Market Analysis, Insights and Forecast - by Types
- 5.2.1. Micro Encapsulation
- 5.2.2. Nano Encapsulation
- 5.2.3. Others
- 5.3. Market Analysis, Insights and Forecast - by Region
- 5.3.1. North America
- 5.3.2. South America
- 5.3.3. Europe
- 5.3.4. Middle East & Africa
- 5.3.5. Asia Pacific
- 5.1. Market Analysis, Insights and Forecast - by Application
- 6. North America Food Encapsulation of New Active Ingredients Analysis, Insights and Forecast, 2020-2032
- 6.1. Market Analysis, Insights and Forecast - by Application
- 6.1.1. Functional Food and Beverages
- 6.1.2. Convenience Foods
- 6.1.3. Bakery and Confectionery
- 6.1.4. Dairy Products
- 6.1.5. Others
- 6.2. Market Analysis, Insights and Forecast - by Types
- 6.2.1. Micro Encapsulation
- 6.2.2. Nano Encapsulation
- 6.2.3. Others
- 6.1. Market Analysis, Insights and Forecast - by Application
- 7. South America Food Encapsulation of New Active Ingredients Analysis, Insights and Forecast, 2020-2032
- 7.1. Market Analysis, Insights and Forecast - by Application
- 7.1.1. Functional Food and Beverages
- 7.1.2. Convenience Foods
- 7.1.3. Bakery and Confectionery
- 7.1.4. Dairy Products
- 7.1.5. Others
- 7.2. Market Analysis, Insights and Forecast - by Types
- 7.2.1. Micro Encapsulation
- 7.2.2. Nano Encapsulation
- 7.2.3. Others
- 7.1. Market Analysis, Insights and Forecast - by Application
- 8. Europe Food Encapsulation of New Active Ingredients Analysis, Insights and Forecast, 2020-2032
- 8.1. Market Analysis, Insights and Forecast - by Application
- 8.1.1. Functional Food and Beverages
- 8.1.2. Convenience Foods
- 8.1.3. Bakery and Confectionery
- 8.1.4. Dairy Products
- 8.1.5. Others
- 8.2. Market Analysis, Insights and Forecast - by Types
- 8.2.1. Micro Encapsulation
- 8.2.2. Nano Encapsulation
- 8.2.3. Others
- 8.1. Market Analysis, Insights and Forecast - by Application
- 9. Middle East & Africa Food Encapsulation of New Active Ingredients Analysis, Insights and Forecast, 2020-2032
- 9.1. Market Analysis, Insights and Forecast - by Application
- 9.1.1. Functional Food and Beverages
- 9.1.2. Convenience Foods
- 9.1.3. Bakery and Confectionery
- 9.1.4. Dairy Products
- 9.1.5. Others
- 9.2. Market Analysis, Insights and Forecast - by Types
- 9.2.1. Micro Encapsulation
- 9.2.2. Nano Encapsulation
- 9.2.3. Others
- 9.1. Market Analysis, Insights and Forecast - by Application
- 10. Asia Pacific Food Encapsulation of New Active Ingredients Analysis, Insights and Forecast, 2020-2032
- 10.1. Market Analysis, Insights and Forecast - by Application
- 10.1.1. Functional Food and Beverages
- 10.1.2. Convenience Foods
- 10.1.3. Bakery and Confectionery
- 10.1.4. Dairy Products
- 10.1.5. Others
- 10.2. Market Analysis, Insights and Forecast - by Types
- 10.2.1. Micro Encapsulation
- 10.2.2. Nano Encapsulation
- 10.2.3. Others
- 10.1. Market Analysis, Insights and Forecast - by Application
- 11. Competitive Analysis
- 11.1. Global Market Share Analysis 2025
- 11.2. Company Profiles
- 11.2.1 FrieslandCampina
- 11.2.1.1. Overview
- 11.2.1.2. Products
- 11.2.1.3. SWOT Analysis
- 11.2.1.4. Recent Developments
- 11.2.1.5. Financials (Based on Availability)
- 11.2.2 DSM
- 11.2.2.1. Overview
- 11.2.2.2. Products
- 11.2.2.3. SWOT Analysis
- 11.2.2.4. Recent Developments
- 11.2.2.5. Financials (Based on Availability)
- 11.2.3 Ingredion
- 11.2.3.1. Overview
- 11.2.3.2. Products
- 11.2.3.3. SWOT Analysis
- 11.2.3.4. Recent Developments
- 11.2.3.5. Financials (Based on Availability)
- 11.2.4 Kerry
- 11.2.4.1. Overview
- 11.2.4.2. Products
- 11.2.4.3. SWOT Analysis
- 11.2.4.4. Recent Developments
- 11.2.4.5. Financials (Based on Availability)
- 11.2.5 Cargill
- 11.2.5.1. Overview
- 11.2.5.2. Products
- 11.2.5.3. SWOT Analysis
- 11.2.5.4. Recent Developments
- 11.2.5.5. Financials (Based on Availability)
- 11.2.6 Lycored
- 11.2.6.1. Overview
- 11.2.6.2. Products
- 11.2.6.3. SWOT Analysis
- 11.2.6.4. Recent Developments
- 11.2.6.5. Financials (Based on Availability)
- 11.2.7 Balchem
- 11.2.7.1. Overview
- 11.2.7.2. Products
- 11.2.7.3. SWOT Analysis
- 11.2.7.4. Recent Developments
- 11.2.7.5. Financials (Based on Availability)
- 11.2.8 Firmenich
- 11.2.8.1. Overview
- 11.2.8.2. Products
- 11.2.8.3. SWOT Analysis
- 11.2.8.4. Recent Developments
- 11.2.8.5. Financials (Based on Availability)
- 11.2.9 IFF
- 11.2.9.1. Overview
- 11.2.9.2. Products
- 11.2.9.3. SWOT Analysis
- 11.2.9.4. Recent Developments
- 11.2.9.5. Financials (Based on Availability)
- 11.2.10 Symrise
- 11.2.10.1. Overview
- 11.2.10.2. Products
- 11.2.10.3. SWOT Analysis
- 11.2.10.4. Recent Developments
- 11.2.10.5. Financials (Based on Availability)
- 11.2.11 Aveka Group
- 11.2.11.1. Overview
- 11.2.11.2. Products
- 11.2.11.3. SWOT Analysis
- 11.2.11.4. Recent Developments
- 11.2.11.5. Financials (Based on Availability)
- 11.2.12 Advanced BioNutrition
- 11.2.12.1. Overview
- 11.2.12.2. Products
- 11.2.12.3. SWOT Analysis
- 11.2.12.4. Recent Developments
- 11.2.12.5. Financials (Based on Availability)
- 11.2.13 Encapsys
- 11.2.13.1. Overview
- 11.2.13.2. Products
- 11.2.13.3. SWOT Analysis
- 11.2.13.4. Recent Developments
- 11.2.13.5. Financials (Based on Availability)
- 11.2.14 TasteTech
- 11.2.14.1. Overview
- 11.2.14.2. Products
- 11.2.14.3. SWOT Analysis
- 11.2.14.4. Recent Developments
- 11.2.14.5. Financials (Based on Availability)
- 11.2.15 Sphera Encapsulation
- 11.2.15.1. Overview
- 11.2.15.2. Products
- 11.2.15.3. SWOT Analysis
- 11.2.15.4. Recent Developments
- 11.2.15.5. Financials (Based on Availability)
- 11.2.16 Clextral
- 11.2.16.1. Overview
- 11.2.16.2. Products
- 11.2.16.3. SWOT Analysis
- 11.2.16.4. Recent Developments
- 11.2.16.5. Financials (Based on Availability)
- 11.2.17 Vitasquare
- 11.2.17.1. Overview
- 11.2.17.2. Products
- 11.2.17.3. SWOT Analysis
- 11.2.17.4. Recent Developments
- 11.2.17.5. Financials (Based on Availability)
- 11.2.1 FrieslandCampina
List of Figures
- Figure 1: Global Food Encapsulation of New Active Ingredients Revenue Breakdown (undefined, %) by Region 2025 & 2033
- Figure 2: North America Food Encapsulation of New Active Ingredients Revenue (undefined), by Application 2025 & 2033
- Figure 3: North America Food Encapsulation of New Active Ingredients Revenue Share (%), by Application 2025 & 2033
- Figure 4: North America Food Encapsulation of New Active Ingredients Revenue (undefined), by Types 2025 & 2033
- Figure 5: North America Food Encapsulation of New Active Ingredients Revenue Share (%), by Types 2025 & 2033
- Figure 6: North America Food Encapsulation of New Active Ingredients Revenue (undefined), by Country 2025 & 2033
- Figure 7: North America Food Encapsulation of New Active Ingredients Revenue Share (%), by Country 2025 & 2033
- Figure 8: South America Food Encapsulation of New Active Ingredients Revenue (undefined), by Application 2025 & 2033
- Figure 9: South America Food Encapsulation of New Active Ingredients Revenue Share (%), by Application 2025 & 2033
- Figure 10: South America Food Encapsulation of New Active Ingredients Revenue (undefined), by Types 2025 & 2033
- Figure 11: South America Food Encapsulation of New Active Ingredients Revenue Share (%), by Types 2025 & 2033
- Figure 12: South America Food Encapsulation of New Active Ingredients Revenue (undefined), by Country 2025 & 2033
- Figure 13: South America Food Encapsulation of New Active Ingredients Revenue Share (%), by Country 2025 & 2033
- Figure 14: Europe Food Encapsulation of New Active Ingredients Revenue (undefined), by Application 2025 & 2033
- Figure 15: Europe Food Encapsulation of New Active Ingredients Revenue Share (%), by Application 2025 & 2033
- Figure 16: Europe Food Encapsulation of New Active Ingredients Revenue (undefined), by Types 2025 & 2033
- Figure 17: Europe Food Encapsulation of New Active Ingredients Revenue Share (%), by Types 2025 & 2033
- Figure 18: Europe Food Encapsulation of New Active Ingredients Revenue (undefined), by Country 2025 & 2033
- Figure 19: Europe Food Encapsulation of New Active Ingredients Revenue Share (%), by Country 2025 & 2033
- Figure 20: Middle East & Africa Food Encapsulation of New Active Ingredients Revenue (undefined), by Application 2025 & 2033
- Figure 21: Middle East & Africa Food Encapsulation of New Active Ingredients Revenue Share (%), by Application 2025 & 2033
- Figure 22: Middle East & Africa Food Encapsulation of New Active Ingredients Revenue (undefined), by Types 2025 & 2033
- Figure 23: Middle East & Africa Food Encapsulation of New Active Ingredients Revenue Share (%), by Types 2025 & 2033
- Figure 24: Middle East & Africa Food Encapsulation of New Active Ingredients Revenue (undefined), by Country 2025 & 2033
- Figure 25: Middle East & Africa Food Encapsulation of New Active Ingredients Revenue Share (%), by Country 2025 & 2033
- Figure 26: Asia Pacific Food Encapsulation of New Active Ingredients Revenue (undefined), by Application 2025 & 2033
- Figure 27: Asia Pacific Food Encapsulation of New Active Ingredients Revenue Share (%), by Application 2025 & 2033
- Figure 28: Asia Pacific Food Encapsulation of New Active Ingredients Revenue (undefined), by Types 2025 & 2033
- Figure 29: Asia Pacific Food Encapsulation of New Active Ingredients Revenue Share (%), by Types 2025 & 2033
- Figure 30: Asia Pacific Food Encapsulation of New Active Ingredients Revenue (undefined), by Country 2025 & 2033
- Figure 31: Asia Pacific Food Encapsulation of New Active Ingredients Revenue Share (%), by Country 2025 & 2033
List of Tables
- Table 1: Global Food Encapsulation of New Active Ingredients Revenue undefined Forecast, by Application 2020 & 2033
- Table 2: Global Food Encapsulation of New Active Ingredients Revenue undefined Forecast, by Types 2020 & 2033
- Table 3: Global Food Encapsulation of New Active Ingredients Revenue undefined Forecast, by Region 2020 & 2033
- Table 4: Global Food Encapsulation of New Active Ingredients Revenue undefined Forecast, by Application 2020 & 2033
- Table 5: Global Food Encapsulation of New Active Ingredients Revenue undefined Forecast, by Types 2020 & 2033
- Table 6: Global Food Encapsulation of New Active Ingredients Revenue undefined Forecast, by Country 2020 & 2033
- Table 7: United States Food Encapsulation of New Active Ingredients Revenue (undefined) Forecast, by Application 2020 & 2033
- Table 8: Canada Food Encapsulation of New Active Ingredients Revenue (undefined) Forecast, by Application 2020 & 2033
- Table 9: Mexico Food Encapsulation of New Active Ingredients Revenue (undefined) Forecast, by Application 2020 & 2033
- Table 10: Global Food Encapsulation of New Active Ingredients Revenue undefined Forecast, by Application 2020 & 2033
- Table 11: Global Food Encapsulation of New Active Ingredients Revenue undefined Forecast, by Types 2020 & 2033
- Table 12: Global Food Encapsulation of New Active Ingredients Revenue undefined Forecast, by Country 2020 & 2033
- Table 13: Brazil Food Encapsulation of New Active Ingredients Revenue (undefined) Forecast, by Application 2020 & 2033
- Table 14: Argentina Food Encapsulation of New Active Ingredients Revenue (undefined) Forecast, by Application 2020 & 2033
- Table 15: Rest of South America Food Encapsulation of New Active Ingredients Revenue (undefined) Forecast, by Application 2020 & 2033
- Table 16: Global Food Encapsulation of New Active Ingredients Revenue undefined Forecast, by Application 2020 & 2033
- Table 17: Global Food Encapsulation of New Active Ingredients Revenue undefined Forecast, by Types 2020 & 2033
- Table 18: Global Food Encapsulation of New Active Ingredients Revenue undefined Forecast, by Country 2020 & 2033
- Table 19: United Kingdom Food Encapsulation of New Active Ingredients Revenue (undefined) Forecast, by Application 2020 & 2033
- Table 20: Germany Food Encapsulation of New Active Ingredients Revenue (undefined) Forecast, by Application 2020 & 2033
- Table 21: France Food Encapsulation of New Active Ingredients Revenue (undefined) Forecast, by Application 2020 & 2033
- Table 22: Italy Food Encapsulation of New Active Ingredients Revenue (undefined) Forecast, by Application 2020 & 2033
- Table 23: Spain Food Encapsulation of New Active Ingredients Revenue (undefined) Forecast, by Application 2020 & 2033
- Table 24: Russia Food Encapsulation of New Active Ingredients Revenue (undefined) Forecast, by Application 2020 & 2033
- Table 25: Benelux Food Encapsulation of New Active Ingredients Revenue (undefined) Forecast, by Application 2020 & 2033
- Table 26: Nordics Food Encapsulation of New Active Ingredients Revenue (undefined) Forecast, by Application 2020 & 2033
- Table 27: Rest of Europe Food Encapsulation of New Active Ingredients Revenue (undefined) Forecast, by Application 2020 & 2033
- Table 28: Global Food Encapsulation of New Active Ingredients Revenue undefined Forecast, by Application 2020 & 2033
- Table 29: Global Food Encapsulation of New Active Ingredients Revenue undefined Forecast, by Types 2020 & 2033
- Table 30: Global Food Encapsulation of New Active Ingredients Revenue undefined Forecast, by Country 2020 & 2033
- Table 31: Turkey Food Encapsulation of New Active Ingredients Revenue (undefined) Forecast, by Application 2020 & 2033
- Table 32: Israel Food Encapsulation of New Active Ingredients Revenue (undefined) Forecast, by Application 2020 & 2033
- Table 33: GCC Food Encapsulation of New Active Ingredients Revenue (undefined) Forecast, by Application 2020 & 2033
- Table 34: North Africa Food Encapsulation of New Active Ingredients Revenue (undefined) Forecast, by Application 2020 & 2033
- Table 35: South Africa Food Encapsulation of New Active Ingredients Revenue (undefined) Forecast, by Application 2020 & 2033
- Table 36: Rest of Middle East & Africa Food Encapsulation of New Active Ingredients Revenue (undefined) Forecast, by Application 2020 & 2033
- Table 37: Global Food Encapsulation of New Active Ingredients Revenue undefined Forecast, by Application 2020 & 2033
- Table 38: Global Food Encapsulation of New Active Ingredients Revenue undefined Forecast, by Types 2020 & 2033
- Table 39: Global Food Encapsulation of New Active Ingredients Revenue undefined Forecast, by Country 2020 & 2033
- Table 40: China Food Encapsulation of New Active Ingredients Revenue (undefined) Forecast, by Application 2020 & 2033
- Table 41: India Food Encapsulation of New Active Ingredients Revenue (undefined) Forecast, by Application 2020 & 2033
- Table 42: Japan Food Encapsulation of New Active Ingredients Revenue (undefined) Forecast, by Application 2020 & 2033
- Table 43: South Korea Food Encapsulation of New Active Ingredients Revenue (undefined) Forecast, by Application 2020 & 2033
- Table 44: ASEAN Food Encapsulation of New Active Ingredients Revenue (undefined) Forecast, by Application 2020 & 2033
- Table 45: Oceania Food Encapsulation of New Active Ingredients Revenue (undefined) Forecast, by Application 2020 & 2033
- Table 46: Rest of Asia Pacific Food Encapsulation of New Active Ingredients Revenue (undefined) Forecast, by Application 2020 & 2033
Frequently Asked Questions
1. What is the projected Compound Annual Growth Rate (CAGR) of the Food Encapsulation of New Active Ingredients?
The projected CAGR is approximately 9.54%.
2. Which companies are prominent players in the Food Encapsulation of New Active Ingredients?
Key companies in the market include FrieslandCampina, DSM, Ingredion, Kerry, Cargill, Lycored, Balchem, Firmenich, IFF, Symrise, Aveka Group, Advanced BioNutrition, Encapsys, TasteTech, Sphera Encapsulation, Clextral, Vitasquare.
3. What are the main segments of the Food Encapsulation of New Active Ingredients?
The market segments include Application, Types.
4. Can you provide details about the market size?
The market size is estimated to be USD XXX N/A as of 2022.
5. What are some drivers contributing to market growth?
N/A
6. What are the notable trends driving market growth?
N/A
7. Are there any restraints impacting market growth?
N/A
8. Can you provide examples of recent developments in the market?
N/A
9. What pricing options are available for accessing the report?
Pricing options include single-user, multi-user, and enterprise licenses priced at USD 4000.00, USD 6000.00, and USD 8000.00 respectively.
10. Is the market size provided in terms of value or volume?
The market size is provided in terms of value, measured in N/A.
11. Are there any specific market keywords associated with the report?
Yes, the market keyword associated with the report is "Food Encapsulation of New Active Ingredients," which aids in identifying and referencing the specific market segment covered.
12. How do I determine which pricing option suits my needs best?
The pricing options vary based on user requirements and access needs. Individual users may opt for single-user licenses, while businesses requiring broader access may choose multi-user or enterprise licenses for cost-effective access to the report.
13. Are there any additional resources or data provided in the Food Encapsulation of New Active Ingredients report?
While the report offers comprehensive insights, it's advisable to review the specific contents or supplementary materials provided to ascertain if additional resources or data are available.
14. How can I stay updated on further developments or reports in the Food Encapsulation of New Active Ingredients?
To stay informed about further developments, trends, and reports in the Food Encapsulation of New Active Ingredients, consider subscribing to industry newsletters, following relevant companies and organizations, or regularly checking reputable industry news sources and publications.
Methodology
Step 1 - Identification of Relevant Samples Size from Population Database


Step 2 - Approaches for Defining Global Market Size (Value, Volume* & Price*)

Note*: In applicable scenarios
Step 3 - Data Sources
Primary Research
- Web Analytics
- Survey Reports
- Research Institute
- Latest Research Reports
- Opinion Leaders
Secondary Research
- Annual Reports
- White Paper
- Latest Press Release
- Industry Association
- Paid Database
- Investor Presentations

Step 4 - Data Triangulation
Involves using different sources of information in order to increase the validity of a study
These sources are likely to be stakeholders in a program - participants, other researchers, program staff, other community members, and so on.
Then we put all data in single framework & apply various statistical tools to find out the dynamic on the market.
During the analysis stage, feedback from the stakeholder groups would be compared to determine areas of agreement as well as areas of divergence