

Key Insights
The global food-grade biomass plastic-free tableware market is poised for significant expansion, propelled by rising consumer preference for sustainable and eco-conscious alternatives. Heightened awareness of plastic pollution's environmental impact and supportive government regulations curbing plastic waste are key drivers. The market is projected to grow at a Compound Annual Growth Rate (CAGR) of 7.6%, reaching a market size of 21.4 billion by 2025. Key segments include disposable and reusable tableware, with disposable items currently dominating due to accessibility and cost-effectiveness. Leading companies are actively investing in research and development for biodegradable and compostable materials, further stimulating growth. Geographically, North America and Europe lead adoption, while Asia-Pacific anticipates robust expansion due to increasing disposable income and environmental consciousness. Challenges include the higher cost of biomass materials and ensuring consistent product quality.
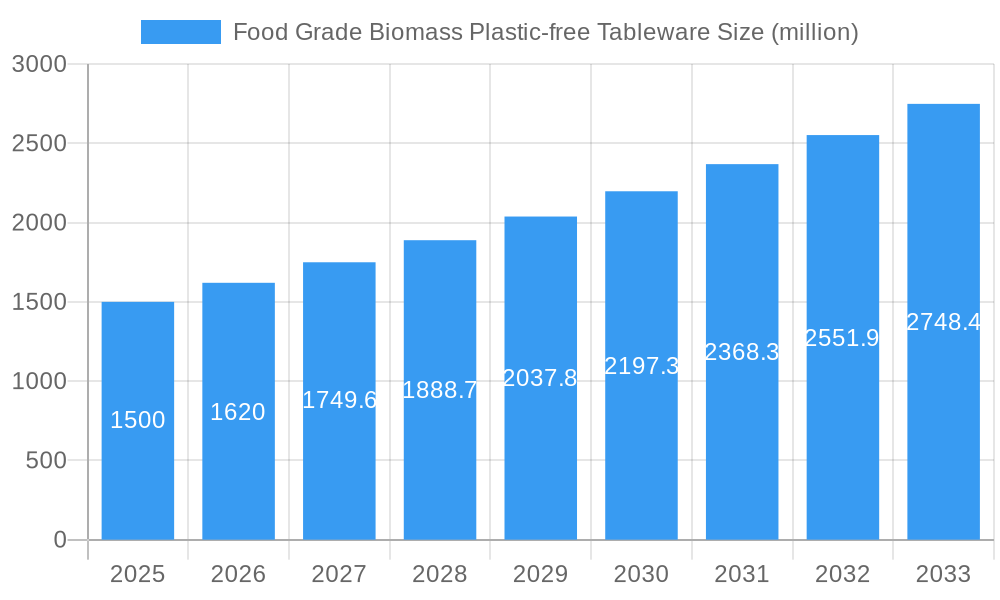
Food Grade Biomass Plastic-free Tableware Market Size (In Billion)
The competitive arena features established entities and agile startups. Market leaders capitalize on extensive distribution and brand equity, while new entrants introduce innovative designs and materials. Growing emphasis on sustainable sourcing and supply chain transparency is driving the adoption of certified biomass materials. Future growth will be shaped by material science advancements, yielding more durable and aesthetically pleasing products. Government incentives and public awareness campaigns are instrumental in driving market acceptance. While initial costs present a hurdle, the long-term environmental and economic advantages are increasingly influencing purchasing decisions.
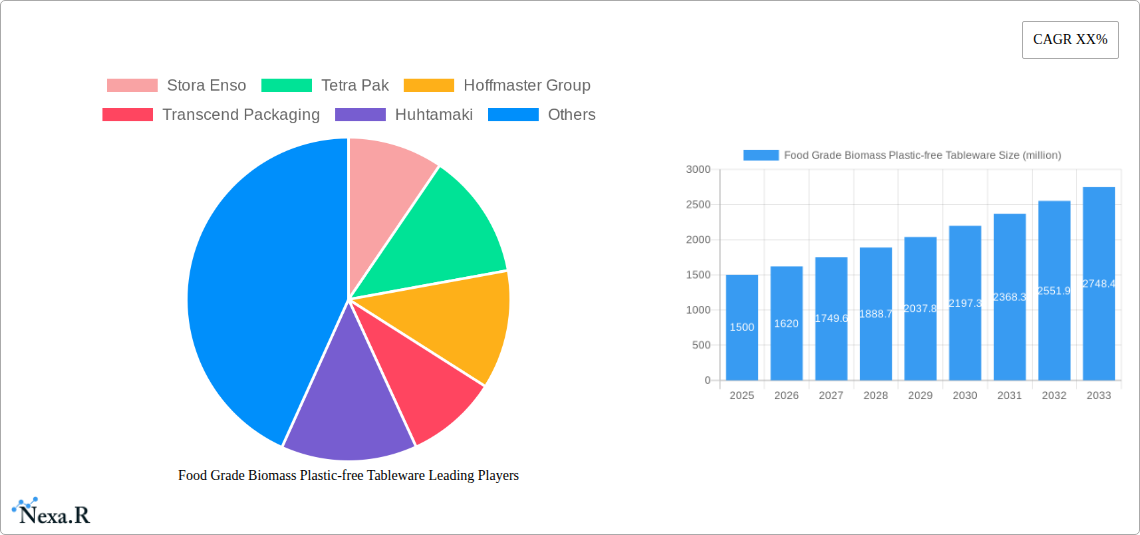
Food Grade Biomass Plastic-free Tableware Company Market Share
Food Grade Biomass Plastic-free Tableware Market Report: 2019-2033
This comprehensive report provides an in-depth analysis of the global food grade biomass plastic-free tableware market, encompassing market dynamics, growth trends, regional segmentation, product landscape, key players, and future outlook. The study period covers 2019-2033, with 2025 as the base and estimated year, and a forecast period of 2025-2033. This report is crucial for industry professionals, investors, and stakeholders seeking to understand and capitalize on the burgeoning demand for sustainable tableware solutions. The market is valued at xx million units in 2025 and is projected to reach xx million units by 2033.
Food Grade Biomass Plastic-free Tableware Market Dynamics & Structure
The food grade biomass plastic-free tableware market is characterized by increasing consumer demand for eco-friendly alternatives to traditional plastic tableware, driven by growing environmental awareness and stringent regulations. Market concentration is moderate, with several key players vying for market share. Technological innovation, particularly in bio-based materials and manufacturing processes, is a major driver. Regulatory frameworks promoting sustainability and banning single-use plastics are further accelerating market growth. Competitive substitutes include traditional plastic tableware and other biodegradable materials, but biomass-based options are gaining traction due to their superior performance and compostability. End-user demographics show strong demand from restaurants, food service businesses, and consumers seeking sustainable alternatives for home use. M&A activity is expected to increase, with larger players potentially acquiring smaller innovative companies to expand their product portfolios and market reach.
- Market Concentration: Moderate, with top 5 players holding approximately xx% market share in 2025.
- Technological Innovation: Focus on improving biodegradability, strength, and cost-effectiveness of biomass materials.
- Regulatory Frameworks: Increasing bans on single-use plastics are driving adoption of eco-friendly alternatives.
- Competitive Substitutes: Traditional plastic and other biodegradable materials pose competition.
- End-User Demographics: High demand from food service, restaurants, and environmentally conscious consumers.
- M&A Trends: Consolidation expected, with larger companies acquiring smaller innovative players. An estimated xx M&A deals are predicted in the forecast period.
Food Grade Biomass Plastic-free Tableware Growth Trends & Insights
The global food grade biomass plastic-free tableware market witnessed significant growth during the historical period (2019-2024), driven primarily by the rising awareness of plastic pollution and the increasing preference for sustainable products. The market size has expanded from xx million units in 2019 to xx million units in 2024, exhibiting a CAGR of xx%. This upward trend is expected to continue during the forecast period (2025-2033), with the market size projected to reach xx million units by 2033. Market penetration is increasing across various segments, notably in developed economies with strong environmental regulations. Technological disruptions, such as advancements in bio-polymer technology and improved manufacturing techniques, are facilitating the wider adoption of biomass-based tableware. Changes in consumer behavior, driven by increasing environmental consciousness and willingness to pay a premium for sustainable products, are key growth factors. Further, the growing adoption of online ordering and food delivery services adds to the demand.
Dominant Regions, Countries, or Segments in Food Grade Biomass Plastic-free Tableware
North America and Europe are currently the leading regions in the food grade biomass plastic-free tableware market due to strong environmental regulations, high consumer awareness, and well-established supply chains. However, Asia-Pacific is projected to experience the fastest growth due to its expanding food service industry and increasing adoption of sustainable practices. Specific countries like the US, Germany, China, and Japan are driving market growth within their respective regions.
- North America: Stringent regulations, high consumer awareness, and established infrastructure drive growth.
- Europe: Similar to North America, strong regulatory framework and consumer demand support market growth.
- Asia-Pacific: Rapid expansion of food service and increasing environmental consciousness fuel the fastest growth.
- Key Drivers: Stringent environmental regulations, growing consumer awareness of sustainability, and government initiatives.
Food Grade Biomass Plastic-free Tableware Product Landscape
The product landscape features a variety of tableware items made from diverse biomass materials such as bagasse, bamboo, and sugarcane. Innovations focus on enhancing product performance characteristics, including strength, durability, and compostability. New product applications extend beyond plates and cutlery to encompass bowls, cups, and other food service items. Key selling propositions emphasize eco-friendliness, biodegradability, and compostability, aligning with consumer preferences for sustainable products. Technological advancements encompass improved material formulations for increased strength and water resistance, as well as innovative manufacturing processes for cost reduction and efficiency.
Key Drivers, Barriers & Challenges in Food Grade Biomass Plastic-free Tableware
Key Drivers: Growing environmental concerns, increasing consumer demand for sustainable products, stringent government regulations on plastic waste, and advancements in bio-based material technology are primary growth drivers. For example, the EU's single-use plastics directive has significantly increased demand for sustainable alternatives.
Key Challenges & Restraints: High production costs compared to traditional plastic tableware, limitations in product durability and water resistance for certain applications, and the potential for supply chain disruptions due to raw material availability are significant challenges. Regulatory complexities and inconsistent standards across different regions can also impede market growth. The relatively lower shelf life compared to plastic is also a major challenge. This challenge impacts about xx% of the market.
Emerging Opportunities in Food Grade Biomass Plastic-free Tableware
Untapped markets in developing economies present significant opportunities, particularly in regions with limited access to traditional plastic tableware and growing food service sectors. Innovative applications in specialized areas like compostable food packaging and catering services are emerging. Evolving consumer preferences, with a focus on convenience and aesthetics, offer opportunities for product diversification and premium product offerings.
Growth Accelerators in the Food Grade Biomass Plastic-free Tableware Industry
Technological breakthroughs in bio-polymer technology are enhancing product durability and performance. Strategic partnerships between material suppliers, manufacturers, and retailers are streamlining the supply chain and improving cost-efficiency. Market expansion strategies focusing on emerging economies and untapped market segments are accelerating growth.
Key Players Shaping the Food Grade Biomass Plastic-free Tableware Market
- Stora Enso
- Tetra Pak
- Hoffmaster Group
- Transcend Packaging
- Huhtamaki
- Sowinpak
- Footprint
- Canada Brown Eco Products
- Aardvark Straws
- OkStraw Paper Straws
- StoneStraw
- Hetrun
- Ningbo Asia Pulp and Paper Industry
- Bohui Paper
- Xiamen Elements Packaging
- Ruize Arts
- Fuling Technology
- Pando EP Technology
Notable Milestones in Food Grade Biomass Plastic-free Tableware Sector
- 2020: Several major food chains announce commitments to phasing out plastic tableware.
- 2021: Significant investments in bio-based material R&D are observed.
- 2022: Introduction of compostable tableware with improved strength and water resistance.
- 2023: Several key players announce strategic partnerships to expand market reach.
- 2024: Several new biodegradable material patents filed.
In-Depth Food Grade Biomass Plastic-free Tableware Market Outlook
The future of the food grade biomass plastic-free tableware market is extremely positive, driven by ongoing technological advancements, increasing consumer awareness, and supportive regulatory frameworks. Strategic opportunities abound for companies focusing on innovation, sustainability, and efficient supply chain management. The market is poised for significant expansion, especially in emerging markets, making it an attractive sector for investment and growth. The increasing focus on circular economy principles offers further opportunities for companies that can develop effective end-of-life solutions for biomass-based tableware.
Food Grade Biomass Plastic-free Tableware Segmentation
-
1. Application
- 1.1. Commercial
- 1.2. Home
-
2. Types
- 2.1. Disposable Type
- 2.2. Reusable Type
Food Grade Biomass Plastic-free Tableware Segmentation By Geography
-
1. North America
- 1.1. United States
- 1.2. Canada
- 1.3. Mexico
-
2. South America
- 2.1. Brazil
- 2.2. Argentina
- 2.3. Rest of South America
-
3. Europe
- 3.1. United Kingdom
- 3.2. Germany
- 3.3. France
- 3.4. Italy
- 3.5. Spain
- 3.6. Russia
- 3.7. Benelux
- 3.8. Nordics
- 3.9. Rest of Europe
-
4. Middle East & Africa
- 4.1. Turkey
- 4.2. Israel
- 4.3. GCC
- 4.4. North Africa
- 4.5. South Africa
- 4.6. Rest of Middle East & Africa
-
5. Asia Pacific
- 5.1. China
- 5.2. India
- 5.3. Japan
- 5.4. South Korea
- 5.5. ASEAN
- 5.6. Oceania
- 5.7. Rest of Asia Pacific

Food Grade Biomass Plastic-free Tableware Regional Market Share
Geographic Coverage of Food Grade Biomass Plastic-free Tableware
Food Grade Biomass Plastic-free Tableware REPORT HIGHLIGHTS
| Aspects | Details |
|---|---|
| Study Period | 2020-2034 |
| Base Year | 2025 |
| Estimated Year | 2026 |
| Forecast Period | 2026-2034 |
| Historical Period | 2020-2025 |
| Growth Rate | CAGR of 7.6% from 2020-2034 |
| Segmentation |
|
Table of Contents
- 1. Introduction
- 1.1. Research Scope
- 1.2. Market Segmentation
- 1.3. Research Methodology
- 1.4. Definitions and Assumptions
- 2. Executive Summary
- 2.1. Introduction
- 3. Market Dynamics
- 3.1. Introduction
- 3.2. Market Drivers
- 3.3. Market Restrains
- 3.4. Market Trends
- 4. Market Factor Analysis
- 4.1. Porters Five Forces
- 4.2. Supply/Value Chain
- 4.3. PESTEL analysis
- 4.4. Market Entropy
- 4.5. Patent/Trademark Analysis
- 5. Global Food Grade Biomass Plastic-free Tableware Analysis, Insights and Forecast, 2020-2032
- 5.1. Market Analysis, Insights and Forecast - by Application
- 5.1.1. Commercial
- 5.1.2. Home
- 5.2. Market Analysis, Insights and Forecast - by Types
- 5.2.1. Disposable Type
- 5.2.2. Reusable Type
- 5.3. Market Analysis, Insights and Forecast - by Region
- 5.3.1. North America
- 5.3.2. South America
- 5.3.3. Europe
- 5.3.4. Middle East & Africa
- 5.3.5. Asia Pacific
- 5.1. Market Analysis, Insights and Forecast - by Application
- 6. North America Food Grade Biomass Plastic-free Tableware Analysis, Insights and Forecast, 2020-2032
- 6.1. Market Analysis, Insights and Forecast - by Application
- 6.1.1. Commercial
- 6.1.2. Home
- 6.2. Market Analysis, Insights and Forecast - by Types
- 6.2.1. Disposable Type
- 6.2.2. Reusable Type
- 6.1. Market Analysis, Insights and Forecast - by Application
- 7. South America Food Grade Biomass Plastic-free Tableware Analysis, Insights and Forecast, 2020-2032
- 7.1. Market Analysis, Insights and Forecast - by Application
- 7.1.1. Commercial
- 7.1.2. Home
- 7.2. Market Analysis, Insights and Forecast - by Types
- 7.2.1. Disposable Type
- 7.2.2. Reusable Type
- 7.1. Market Analysis, Insights and Forecast - by Application
- 8. Europe Food Grade Biomass Plastic-free Tableware Analysis, Insights and Forecast, 2020-2032
- 8.1. Market Analysis, Insights and Forecast - by Application
- 8.1.1. Commercial
- 8.1.2. Home
- 8.2. Market Analysis, Insights and Forecast - by Types
- 8.2.1. Disposable Type
- 8.2.2. Reusable Type
- 8.1. Market Analysis, Insights and Forecast - by Application
- 9. Middle East & Africa Food Grade Biomass Plastic-free Tableware Analysis, Insights and Forecast, 2020-2032
- 9.1. Market Analysis, Insights and Forecast - by Application
- 9.1.1. Commercial
- 9.1.2. Home
- 9.2. Market Analysis, Insights and Forecast - by Types
- 9.2.1. Disposable Type
- 9.2.2. Reusable Type
- 9.1. Market Analysis, Insights and Forecast - by Application
- 10. Asia Pacific Food Grade Biomass Plastic-free Tableware Analysis, Insights and Forecast, 2020-2032
- 10.1. Market Analysis, Insights and Forecast - by Application
- 10.1.1. Commercial
- 10.1.2. Home
- 10.2. Market Analysis, Insights and Forecast - by Types
- 10.2.1. Disposable Type
- 10.2.2. Reusable Type
- 10.1. Market Analysis, Insights and Forecast - by Application
- 11. Competitive Analysis
- 11.1. Global Market Share Analysis 2025
- 11.2. Company Profiles
- 11.2.1 Stora Enso
- 11.2.1.1. Overview
- 11.2.1.2. Products
- 11.2.1.3. SWOT Analysis
- 11.2.1.4. Recent Developments
- 11.2.1.5. Financials (Based on Availability)
- 11.2.2 Tetra Pak
- 11.2.2.1. Overview
- 11.2.2.2. Products
- 11.2.2.3. SWOT Analysis
- 11.2.2.4. Recent Developments
- 11.2.2.5. Financials (Based on Availability)
- 11.2.3 Hoffmaster Group
- 11.2.3.1. Overview
- 11.2.3.2. Products
- 11.2.3.3. SWOT Analysis
- 11.2.3.4. Recent Developments
- 11.2.3.5. Financials (Based on Availability)
- 11.2.4 Transcend Packaging
- 11.2.4.1. Overview
- 11.2.4.2. Products
- 11.2.4.3. SWOT Analysis
- 11.2.4.4. Recent Developments
- 11.2.4.5. Financials (Based on Availability)
- 11.2.5 Huhtamaki
- 11.2.5.1. Overview
- 11.2.5.2. Products
- 11.2.5.3. SWOT Analysis
- 11.2.5.4. Recent Developments
- 11.2.5.5. Financials (Based on Availability)
- 11.2.6 Sowinpak
- 11.2.6.1. Overview
- 11.2.6.2. Products
- 11.2.6.3. SWOT Analysis
- 11.2.6.4. Recent Developments
- 11.2.6.5. Financials (Based on Availability)
- 11.2.7 Footprint
- 11.2.7.1. Overview
- 11.2.7.2. Products
- 11.2.7.3. SWOT Analysis
- 11.2.7.4. Recent Developments
- 11.2.7.5. Financials (Based on Availability)
- 11.2.8 Canada Brown Eco Products
- 11.2.8.1. Overview
- 11.2.8.2. Products
- 11.2.8.3. SWOT Analysis
- 11.2.8.4. Recent Developments
- 11.2.8.5. Financials (Based on Availability)
- 11.2.9 Aardvark Straws
- 11.2.9.1. Overview
- 11.2.9.2. Products
- 11.2.9.3. SWOT Analysis
- 11.2.9.4. Recent Developments
- 11.2.9.5. Financials (Based on Availability)
- 11.2.10 OkStraw Paper Straws
- 11.2.10.1. Overview
- 11.2.10.2. Products
- 11.2.10.3. SWOT Analysis
- 11.2.10.4. Recent Developments
- 11.2.10.5. Financials (Based on Availability)
- 11.2.11 StoneStraw
- 11.2.11.1. Overview
- 11.2.11.2. Products
- 11.2.11.3. SWOT Analysis
- 11.2.11.4. Recent Developments
- 11.2.11.5. Financials (Based on Availability)
- 11.2.12 Hetrun
- 11.2.12.1. Overview
- 11.2.12.2. Products
- 11.2.12.3. SWOT Analysis
- 11.2.12.4. Recent Developments
- 11.2.12.5. Financials (Based on Availability)
- 11.2.13 Ningbo Asia Pulp and Paper Industry
- 11.2.13.1. Overview
- 11.2.13.2. Products
- 11.2.13.3. SWOT Analysis
- 11.2.13.4. Recent Developments
- 11.2.13.5. Financials (Based on Availability)
- 11.2.14 Bohui Paper
- 11.2.14.1. Overview
- 11.2.14.2. Products
- 11.2.14.3. SWOT Analysis
- 11.2.14.4. Recent Developments
- 11.2.14.5. Financials (Based on Availability)
- 11.2.15 Xiamen Elements Packaging
- 11.2.15.1. Overview
- 11.2.15.2. Products
- 11.2.15.3. SWOT Analysis
- 11.2.15.4. Recent Developments
- 11.2.15.5. Financials (Based on Availability)
- 11.2.16 Ruize Arts
- 11.2.16.1. Overview
- 11.2.16.2. Products
- 11.2.16.3. SWOT Analysis
- 11.2.16.4. Recent Developments
- 11.2.16.5. Financials (Based on Availability)
- 11.2.17 Fuling Technology
- 11.2.17.1. Overview
- 11.2.17.2. Products
- 11.2.17.3. SWOT Analysis
- 11.2.17.4. Recent Developments
- 11.2.17.5. Financials (Based on Availability)
- 11.2.18 Pando EP Technology
- 11.2.18.1. Overview
- 11.2.18.2. Products
- 11.2.18.3. SWOT Analysis
- 11.2.18.4. Recent Developments
- 11.2.18.5. Financials (Based on Availability)
- 11.2.1 Stora Enso
List of Figures
- Figure 1: Global Food Grade Biomass Plastic-free Tableware Revenue Breakdown (billion, %) by Region 2025 & 2033
- Figure 2: North America Food Grade Biomass Plastic-free Tableware Revenue (billion), by Application 2025 & 2033
- Figure 3: North America Food Grade Biomass Plastic-free Tableware Revenue Share (%), by Application 2025 & 2033
- Figure 4: North America Food Grade Biomass Plastic-free Tableware Revenue (billion), by Types 2025 & 2033
- Figure 5: North America Food Grade Biomass Plastic-free Tableware Revenue Share (%), by Types 2025 & 2033
- Figure 6: North America Food Grade Biomass Plastic-free Tableware Revenue (billion), by Country 2025 & 2033
- Figure 7: North America Food Grade Biomass Plastic-free Tableware Revenue Share (%), by Country 2025 & 2033
- Figure 8: South America Food Grade Biomass Plastic-free Tableware Revenue (billion), by Application 2025 & 2033
- Figure 9: South America Food Grade Biomass Plastic-free Tableware Revenue Share (%), by Application 2025 & 2033
- Figure 10: South America Food Grade Biomass Plastic-free Tableware Revenue (billion), by Types 2025 & 2033
- Figure 11: South America Food Grade Biomass Plastic-free Tableware Revenue Share (%), by Types 2025 & 2033
- Figure 12: South America Food Grade Biomass Plastic-free Tableware Revenue (billion), by Country 2025 & 2033
- Figure 13: South America Food Grade Biomass Plastic-free Tableware Revenue Share (%), by Country 2025 & 2033
- Figure 14: Europe Food Grade Biomass Plastic-free Tableware Revenue (billion), by Application 2025 & 2033
- Figure 15: Europe Food Grade Biomass Plastic-free Tableware Revenue Share (%), by Application 2025 & 2033
- Figure 16: Europe Food Grade Biomass Plastic-free Tableware Revenue (billion), by Types 2025 & 2033
- Figure 17: Europe Food Grade Biomass Plastic-free Tableware Revenue Share (%), by Types 2025 & 2033
- Figure 18: Europe Food Grade Biomass Plastic-free Tableware Revenue (billion), by Country 2025 & 2033
- Figure 19: Europe Food Grade Biomass Plastic-free Tableware Revenue Share (%), by Country 2025 & 2033
- Figure 20: Middle East & Africa Food Grade Biomass Plastic-free Tableware Revenue (billion), by Application 2025 & 2033
- Figure 21: Middle East & Africa Food Grade Biomass Plastic-free Tableware Revenue Share (%), by Application 2025 & 2033
- Figure 22: Middle East & Africa Food Grade Biomass Plastic-free Tableware Revenue (billion), by Types 2025 & 2033
- Figure 23: Middle East & Africa Food Grade Biomass Plastic-free Tableware Revenue Share (%), by Types 2025 & 2033
- Figure 24: Middle East & Africa Food Grade Biomass Plastic-free Tableware Revenue (billion), by Country 2025 & 2033
- Figure 25: Middle East & Africa Food Grade Biomass Plastic-free Tableware Revenue Share (%), by Country 2025 & 2033
- Figure 26: Asia Pacific Food Grade Biomass Plastic-free Tableware Revenue (billion), by Application 2025 & 2033
- Figure 27: Asia Pacific Food Grade Biomass Plastic-free Tableware Revenue Share (%), by Application 2025 & 2033
- Figure 28: Asia Pacific Food Grade Biomass Plastic-free Tableware Revenue (billion), by Types 2025 & 2033
- Figure 29: Asia Pacific Food Grade Biomass Plastic-free Tableware Revenue Share (%), by Types 2025 & 2033
- Figure 30: Asia Pacific Food Grade Biomass Plastic-free Tableware Revenue (billion), by Country 2025 & 2033
- Figure 31: Asia Pacific Food Grade Biomass Plastic-free Tableware Revenue Share (%), by Country 2025 & 2033
List of Tables
- Table 1: Global Food Grade Biomass Plastic-free Tableware Revenue billion Forecast, by Application 2020 & 2033
- Table 2: Global Food Grade Biomass Plastic-free Tableware Revenue billion Forecast, by Types 2020 & 2033
- Table 3: Global Food Grade Biomass Plastic-free Tableware Revenue billion Forecast, by Region 2020 & 2033
- Table 4: Global Food Grade Biomass Plastic-free Tableware Revenue billion Forecast, by Application 2020 & 2033
- Table 5: Global Food Grade Biomass Plastic-free Tableware Revenue billion Forecast, by Types 2020 & 2033
- Table 6: Global Food Grade Biomass Plastic-free Tableware Revenue billion Forecast, by Country 2020 & 2033
- Table 7: United States Food Grade Biomass Plastic-free Tableware Revenue (billion) Forecast, by Application 2020 & 2033
- Table 8: Canada Food Grade Biomass Plastic-free Tableware Revenue (billion) Forecast, by Application 2020 & 2033
- Table 9: Mexico Food Grade Biomass Plastic-free Tableware Revenue (billion) Forecast, by Application 2020 & 2033
- Table 10: Global Food Grade Biomass Plastic-free Tableware Revenue billion Forecast, by Application 2020 & 2033
- Table 11: Global Food Grade Biomass Plastic-free Tableware Revenue billion Forecast, by Types 2020 & 2033
- Table 12: Global Food Grade Biomass Plastic-free Tableware Revenue billion Forecast, by Country 2020 & 2033
- Table 13: Brazil Food Grade Biomass Plastic-free Tableware Revenue (billion) Forecast, by Application 2020 & 2033
- Table 14: Argentina Food Grade Biomass Plastic-free Tableware Revenue (billion) Forecast, by Application 2020 & 2033
- Table 15: Rest of South America Food Grade Biomass Plastic-free Tableware Revenue (billion) Forecast, by Application 2020 & 2033
- Table 16: Global Food Grade Biomass Plastic-free Tableware Revenue billion Forecast, by Application 2020 & 2033
- Table 17: Global Food Grade Biomass Plastic-free Tableware Revenue billion Forecast, by Types 2020 & 2033
- Table 18: Global Food Grade Biomass Plastic-free Tableware Revenue billion Forecast, by Country 2020 & 2033
- Table 19: United Kingdom Food Grade Biomass Plastic-free Tableware Revenue (billion) Forecast, by Application 2020 & 2033
- Table 20: Germany Food Grade Biomass Plastic-free Tableware Revenue (billion) Forecast, by Application 2020 & 2033
- Table 21: France Food Grade Biomass Plastic-free Tableware Revenue (billion) Forecast, by Application 2020 & 2033
- Table 22: Italy Food Grade Biomass Plastic-free Tableware Revenue (billion) Forecast, by Application 2020 & 2033
- Table 23: Spain Food Grade Biomass Plastic-free Tableware Revenue (billion) Forecast, by Application 2020 & 2033
- Table 24: Russia Food Grade Biomass Plastic-free Tableware Revenue (billion) Forecast, by Application 2020 & 2033
- Table 25: Benelux Food Grade Biomass Plastic-free Tableware Revenue (billion) Forecast, by Application 2020 & 2033
- Table 26: Nordics Food Grade Biomass Plastic-free Tableware Revenue (billion) Forecast, by Application 2020 & 2033
- Table 27: Rest of Europe Food Grade Biomass Plastic-free Tableware Revenue (billion) Forecast, by Application 2020 & 2033
- Table 28: Global Food Grade Biomass Plastic-free Tableware Revenue billion Forecast, by Application 2020 & 2033
- Table 29: Global Food Grade Biomass Plastic-free Tableware Revenue billion Forecast, by Types 2020 & 2033
- Table 30: Global Food Grade Biomass Plastic-free Tableware Revenue billion Forecast, by Country 2020 & 2033
- Table 31: Turkey Food Grade Biomass Plastic-free Tableware Revenue (billion) Forecast, by Application 2020 & 2033
- Table 32: Israel Food Grade Biomass Plastic-free Tableware Revenue (billion) Forecast, by Application 2020 & 2033
- Table 33: GCC Food Grade Biomass Plastic-free Tableware Revenue (billion) Forecast, by Application 2020 & 2033
- Table 34: North Africa Food Grade Biomass Plastic-free Tableware Revenue (billion) Forecast, by Application 2020 & 2033
- Table 35: South Africa Food Grade Biomass Plastic-free Tableware Revenue (billion) Forecast, by Application 2020 & 2033
- Table 36: Rest of Middle East & Africa Food Grade Biomass Plastic-free Tableware Revenue (billion) Forecast, by Application 2020 & 2033
- Table 37: Global Food Grade Biomass Plastic-free Tableware Revenue billion Forecast, by Application 2020 & 2033
- Table 38: Global Food Grade Biomass Plastic-free Tableware Revenue billion Forecast, by Types 2020 & 2033
- Table 39: Global Food Grade Biomass Plastic-free Tableware Revenue billion Forecast, by Country 2020 & 2033
- Table 40: China Food Grade Biomass Plastic-free Tableware Revenue (billion) Forecast, by Application 2020 & 2033
- Table 41: India Food Grade Biomass Plastic-free Tableware Revenue (billion) Forecast, by Application 2020 & 2033
- Table 42: Japan Food Grade Biomass Plastic-free Tableware Revenue (billion) Forecast, by Application 2020 & 2033
- Table 43: South Korea Food Grade Biomass Plastic-free Tableware Revenue (billion) Forecast, by Application 2020 & 2033
- Table 44: ASEAN Food Grade Biomass Plastic-free Tableware Revenue (billion) Forecast, by Application 2020 & 2033
- Table 45: Oceania Food Grade Biomass Plastic-free Tableware Revenue (billion) Forecast, by Application 2020 & 2033
- Table 46: Rest of Asia Pacific Food Grade Biomass Plastic-free Tableware Revenue (billion) Forecast, by Application 2020 & 2033
Frequently Asked Questions
1. What is the projected Compound Annual Growth Rate (CAGR) of the Food Grade Biomass Plastic-free Tableware?
The projected CAGR is approximately 7.6%.
2. Which companies are prominent players in the Food Grade Biomass Plastic-free Tableware?
Key companies in the market include Stora Enso, Tetra Pak, Hoffmaster Group, Transcend Packaging, Huhtamaki, Sowinpak, Footprint, Canada Brown Eco Products, Aardvark Straws, OkStraw Paper Straws, StoneStraw, Hetrun, Ningbo Asia Pulp and Paper Industry, Bohui Paper, Xiamen Elements Packaging, Ruize Arts, Fuling Technology, Pando EP Technology.
3. What are the main segments of the Food Grade Biomass Plastic-free Tableware?
The market segments include Application, Types.
4. Can you provide details about the market size?
The market size is estimated to be USD 21.4 billion as of 2022.
5. What are some drivers contributing to market growth?
N/A
6. What are the notable trends driving market growth?
N/A
7. Are there any restraints impacting market growth?
N/A
8. Can you provide examples of recent developments in the market?
N/A
9. What pricing options are available for accessing the report?
Pricing options include single-user, multi-user, and enterprise licenses priced at USD 4900.00, USD 7350.00, and USD 9800.00 respectively.
10. Is the market size provided in terms of value or volume?
The market size is provided in terms of value, measured in billion.
11. Are there any specific market keywords associated with the report?
Yes, the market keyword associated with the report is "Food Grade Biomass Plastic-free Tableware," which aids in identifying and referencing the specific market segment covered.
12. How do I determine which pricing option suits my needs best?
The pricing options vary based on user requirements and access needs. Individual users may opt for single-user licenses, while businesses requiring broader access may choose multi-user or enterprise licenses for cost-effective access to the report.
13. Are there any additional resources or data provided in the Food Grade Biomass Plastic-free Tableware report?
While the report offers comprehensive insights, it's advisable to review the specific contents or supplementary materials provided to ascertain if additional resources or data are available.
14. How can I stay updated on further developments or reports in the Food Grade Biomass Plastic-free Tableware?
To stay informed about further developments, trends, and reports in the Food Grade Biomass Plastic-free Tableware, consider subscribing to industry newsletters, following relevant companies and organizations, or regularly checking reputable industry news sources and publications.
Methodology
Step 1 - Identification of Relevant Samples Size from Population Database


Step 2 - Approaches for Defining Global Market Size (Value, Volume* & Price*)

Note*: In applicable scenarios
Step 3 - Data Sources
Primary Research
- Web Analytics
- Survey Reports
- Research Institute
- Latest Research Reports
- Opinion Leaders
Secondary Research
- Annual Reports
- White Paper
- Latest Press Release
- Industry Association
- Paid Database
- Investor Presentations

Step 4 - Data Triangulation
Involves using different sources of information in order to increase the validity of a study
These sources are likely to be stakeholders in a program - participants, other researchers, program staff, other community members, and so on.
Then we put all data in single framework & apply various statistical tools to find out the dynamic on the market.
During the analysis stage, feedback from the stakeholder groups would be compared to determine areas of agreement as well as areas of divergence