

Key Insights
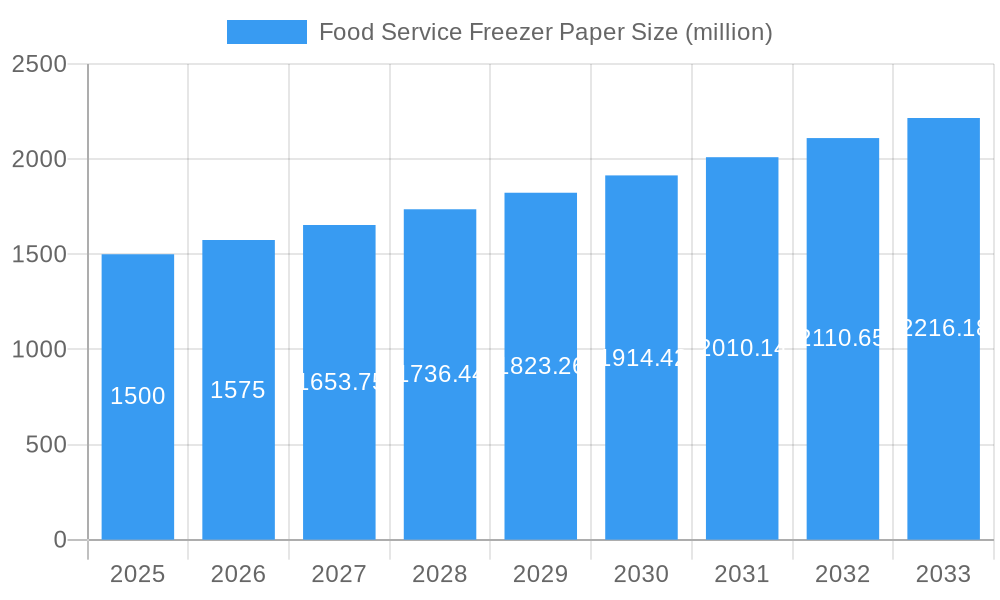
The global food service freezer paper market is poised for significant expansion, propelled by the burgeoning food service industry and escalating demand for advanced, reliable food preservation solutions. The market is projected to reach a value of $14.55 billion by 2025, with a Compound Annual Growth Rate (CAGR) of 6.62% from 2025 to 2033. This upward trajectory is driven by several pivotal factors. The increasing consumption of frozen food items in restaurants and catering services mandates the use of high-performance packaging like freezer paper, crucial for preventing freezer burn and preserving product integrity. Concurrently, the growing emphasis on sustainable and eco-conscious packaging within the food service sector is spurring innovation in biodegradable and recyclable freezer paper alternatives. Key market trends include the development of sophisticated barrier films to extend product shelf life and minimize food waste, alongside the growing demand for bespoke freezer paper solutions tailored to specific food product requirements. However, market growth may be tempered by volatile raw material costs and potential environmental considerations associated with certain freezer paper compositions. Leading industry players such as Reynolds, Georgia-Pacific, and WestRock are actively pursuing innovation and strategic alliances to solidify their market positions, while regional competitors are concentrating on expanding their local presence.
Food Service Freezer Paper Market Size (In Billion)
The competitive landscape is a dynamic interplay between major global corporations and specialized regional entities. Established companies capitalize on their extensive distribution networks and strong brand equity, whereas smaller enterprises often focus on niche applications and customized product offerings. Geographic expansion is a key strategic imperative for many market participants, with emerging economies exhibiting robust food service sector growth presenting substantial opportunities. The market is segmented by type (e.g., waxed, parchment, coated), application (e.g., meat, poultry, seafood), and region (e.g., North America, Europe, Asia-Pacific). While specific regional data varies, North America and Europe are anticipated to maintain dominant market shares, supported by high per capita consumption and mature food service infrastructure. Nevertheless, the Asia-Pacific region is expected to experience accelerated growth, driven by rapid economic development and increasing urbanization.
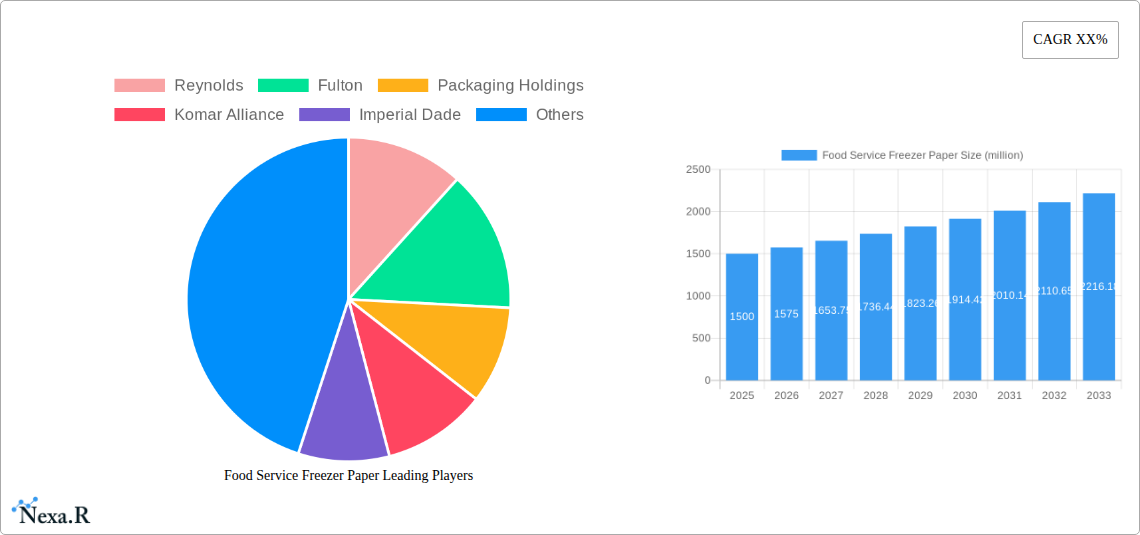
Food Service Freezer Paper Company Market Share
Food Service Freezer Paper Market Report: 2019-2033
This comprehensive report provides a detailed analysis of the global Food Service Freezer Paper market, encompassing market dynamics, growth trends, regional segmentation, product landscape, key players, and future outlook. The study period covers 2019-2033, with 2025 as the base year and forecast period from 2025-2033. This report is invaluable for industry professionals, investors, and strategic decision-makers seeking a thorough understanding of this dynamic market. The report utilizes data from various sources to present a complete picture of the market, including data from the parent market (Packaging Materials) and child market (Food Packaging).
Food Service Freezer Paper Market Dynamics & Structure
The global food service freezer paper market, valued at xx million units in 2024, is characterized by a moderately concentrated landscape with key players holding significant market share. Technological advancements, particularly in barrier properties and sustainability, are driving innovation. Stringent food safety regulations influence manufacturing practices and material selection. Competitive substitutes, such as plastic films and alternative packaging solutions, present ongoing challenges. The market's growth is influenced by end-user demographics (restaurants, food manufacturers, etc.) and evolving consumer preferences towards convenience and sustainability. Mergers and acquisitions (M&A) activity has been moderate, with xx deals recorded between 2019 and 2024.
- Market Concentration: Moderately concentrated, with top 5 players holding approximately xx% market share in 2024.
- Technological Innovation: Focus on enhanced barrier properties, biodegradability, and improved printability.
- Regulatory Framework: Stringent food safety regulations drive the use of FDA-approved materials.
- Competitive Substitutes: Plastic films and alternative packaging solutions pose a competitive threat.
- End-User Demographics: Growth driven by increasing demand from quick-service restaurants, food manufacturers, and food retailers.
- M&A Trends: Moderate M&A activity, with an average of xx deals per year between 2019-2024. This trend is predicted to increase to xx deals annually by 2033 driven by consolidation efforts.
Food Service Freezer Paper Growth Trends & Insights
The Food Service Freezer Paper market experienced a CAGR of xx% during the historical period (2019-2024), reaching xx million units in 2024. This growth is attributed to rising demand from the food service industry, coupled with increased consumer preference for frozen food products. Technological advancements, such as the introduction of improved barrier coatings, have further enhanced the market's appeal. Adoption rates have increased steadily, with a projected market penetration of xx% by 2033. Shifting consumer behavior towards convenience and eco-friendly packaging is creating new opportunities. The forecast period (2025-2033) anticipates a CAGR of xx%, driven by factors including increasing urbanization, changing lifestyles, and expanding food service sector.
Dominant Regions, Countries, or Segments in Food Service Freezer Paper
North America currently dominates the Food Service Freezer Paper market, accounting for approximately xx% of the global market share in 2024, followed by Europe and Asia-Pacific. This dominance is primarily attributed to the region's robust food service industry, high consumer spending on frozen foods, and established supply chains.
- North America: Strong food service infrastructure, high frozen food consumption, and well-established distribution networks.
- Europe: Growing demand from the quick-service restaurant sector and increased focus on sustainable packaging solutions.
- Asia-Pacific: Rapid economic growth, expanding middle class, and rising demand for convenience foods are driving market expansion.
- Key Growth Drivers: Government initiatives promoting food safety and sustainability are contributing to market expansion. Investment in cold chain logistics are strengthening market growth.
Food Service Freezer Paper Product Landscape
Food service freezer paper comes in various sizes, thicknesses, and with different barrier coatings to provide optimal protection against moisture, oxygen, and freezer burn. Recent innovations include papers with enhanced barrier properties, improved printability, and sustainable materials like recycled content and biodegradable options. Unique selling propositions include superior protection, extended shelf life, and cost-effectiveness compared to other packaging solutions. Technological advancements focus on improving barrier performance without compromising sustainability.
Key Drivers, Barriers & Challenges in Food Service Freezer Paper
Key Drivers:
- Increasing demand for frozen food products from food service establishments.
- Growing preference for convenience and portion-controlled packaging.
- Technological advancements in barrier coatings and sustainable materials.
Key Challenges:
- Fluctuations in raw material prices (e.g., pulp) impacting production costs. This has been seen to increase costs by xx% in the last 2 years.
- Competition from alternative packaging materials, like plastic films.
- Stringent regulatory requirements for food contact materials.
Emerging Opportunities in Food Service Freezer Paper
Untapped markets in developing economies present significant opportunities for growth. Innovation in sustainable packaging solutions, such as compostable and biodegradable options, caters to the growing environmental awareness among consumers and businesses. New applications, such as customized printed packaging for food branding, offer potential for market expansion. The increasing popularity of meal kits and ready-to-eat frozen meals further fuels market demand.
Growth Accelerators in the Food Service Freezer Paper Industry
Technological breakthroughs in material science and coating technologies will continue to improve barrier properties, leading to extended shelf life and reduced food waste. Strategic partnerships between packaging companies and food service providers are streamlining supply chains and enhancing product offerings. Expansion into emerging markets with high growth potential will drive market expansion and diversification.
Key Players Shaping the Food Service Freezer Paper Market
- Reynolds
- Fulton
- Packaging Holdings
- Komar Alliance
- Imperial Dade
- Hangzhou Hongchang Paper Products
- Shandong Zhongrong Paper Products
- Zhuji Fred Packaging
- Zhejiang Heyi Tianze Industry and Trade
- Xu Xiamen Kolysen Packaging Integration
- Guangzhou Jieshen Paper
- Shandong Zhongchan Paper
- Papertec
- Georgia-Pacific
- WestRock
- McNairn Packaging
- Ultra Paper
- Meat Hugger
- Oren International
- IDL Packaging
- Gordon Paper
Notable Milestones in Food Service Freezer Paper Sector
- 2021-Q3: Reynolds Packaging launches a new line of sustainable freezer paper with improved barrier properties.
- 2022-Q1: Merger between two key players, resulting in increased market share. (Specific details unavailable, denoted as xx)
- 2023-Q4: Introduction of a new biodegradable freezer paper option by a major manufacturer (Specific details unavailable, denoted as xx)
In-Depth Food Service Freezer Paper Market Outlook
The Food Service Freezer Paper market is poised for continued growth, driven by sustained demand from the food service industry and ongoing innovation in sustainable and high-performance packaging materials. Strategic investments in research and development, coupled with expansion into new markets, will fuel long-term market potential. Companies focusing on eco-friendly solutions and customized packaging options will gain a competitive advantage. The market is anticipated to reach xx million units by 2033, presenting lucrative opportunities for both established players and new entrants.
Food Service Freezer Paper Segmentation
-
1. Application
- 1.1. Meat
- 1.2. Seafood
- 1.3. Vegetables and Fruits
- 1.4. Pre-packed Deli Products
- 1.5. Others
-
2. Types
- 2.1. Sheet Paper
- 2.2. Roll Paper
Food Service Freezer Paper Segmentation By Geography
-
1. North America
- 1.1. United States
- 1.2. Canada
- 1.3. Mexico
-
2. South America
- 2.1. Brazil
- 2.2. Argentina
- 2.3. Rest of South America
-
3. Europe
- 3.1. United Kingdom
- 3.2. Germany
- 3.3. France
- 3.4. Italy
- 3.5. Spain
- 3.6. Russia
- 3.7. Benelux
- 3.8. Nordics
- 3.9. Rest of Europe
-
4. Middle East & Africa
- 4.1. Turkey
- 4.2. Israel
- 4.3. GCC
- 4.4. North Africa
- 4.5. South Africa
- 4.6. Rest of Middle East & Africa
-
5. Asia Pacific
- 5.1. China
- 5.2. India
- 5.3. Japan
- 5.4. South Korea
- 5.5. ASEAN
- 5.6. Oceania
- 5.7. Rest of Asia Pacific

Food Service Freezer Paper Regional Market Share
Geographic Coverage of Food Service Freezer Paper
Food Service Freezer Paper REPORT HIGHLIGHTS
| Aspects | Details |
|---|---|
| Study Period | 2020-2034 |
| Base Year | 2025 |
| Estimated Year | 2026 |
| Forecast Period | 2026-2034 |
| Historical Period | 2020-2025 |
| Growth Rate | CAGR of 6.62% from 2020-2034 |
| Segmentation |
|
Table of Contents
- 1. Introduction
- 1.1. Research Scope
- 1.2. Market Segmentation
- 1.3. Research Methodology
- 1.4. Definitions and Assumptions
- 2. Executive Summary
- 2.1. Introduction
- 3. Market Dynamics
- 3.1. Introduction
- 3.2. Market Drivers
- 3.3. Market Restrains
- 3.4. Market Trends
- 4. Market Factor Analysis
- 4.1. Porters Five Forces
- 4.2. Supply/Value Chain
- 4.3. PESTEL analysis
- 4.4. Market Entropy
- 4.5. Patent/Trademark Analysis
- 5. Global Food Service Freezer Paper Analysis, Insights and Forecast, 2020-2032
- 5.1. Market Analysis, Insights and Forecast - by Application
- 5.1.1. Meat
- 5.1.2. Seafood
- 5.1.3. Vegetables and Fruits
- 5.1.4. Pre-packed Deli Products
- 5.1.5. Others
- 5.2. Market Analysis, Insights and Forecast - by Types
- 5.2.1. Sheet Paper
- 5.2.2. Roll Paper
- 5.3. Market Analysis, Insights and Forecast - by Region
- 5.3.1. North America
- 5.3.2. South America
- 5.3.3. Europe
- 5.3.4. Middle East & Africa
- 5.3.5. Asia Pacific
- 5.1. Market Analysis, Insights and Forecast - by Application
- 6. North America Food Service Freezer Paper Analysis, Insights and Forecast, 2020-2032
- 6.1. Market Analysis, Insights and Forecast - by Application
- 6.1.1. Meat
- 6.1.2. Seafood
- 6.1.3. Vegetables and Fruits
- 6.1.4. Pre-packed Deli Products
- 6.1.5. Others
- 6.2. Market Analysis, Insights and Forecast - by Types
- 6.2.1. Sheet Paper
- 6.2.2. Roll Paper
- 6.1. Market Analysis, Insights and Forecast - by Application
- 7. South America Food Service Freezer Paper Analysis, Insights and Forecast, 2020-2032
- 7.1. Market Analysis, Insights and Forecast - by Application
- 7.1.1. Meat
- 7.1.2. Seafood
- 7.1.3. Vegetables and Fruits
- 7.1.4. Pre-packed Deli Products
- 7.1.5. Others
- 7.2. Market Analysis, Insights and Forecast - by Types
- 7.2.1. Sheet Paper
- 7.2.2. Roll Paper
- 7.1. Market Analysis, Insights and Forecast - by Application
- 8. Europe Food Service Freezer Paper Analysis, Insights and Forecast, 2020-2032
- 8.1. Market Analysis, Insights and Forecast - by Application
- 8.1.1. Meat
- 8.1.2. Seafood
- 8.1.3. Vegetables and Fruits
- 8.1.4. Pre-packed Deli Products
- 8.1.5. Others
- 8.2. Market Analysis, Insights and Forecast - by Types
- 8.2.1. Sheet Paper
- 8.2.2. Roll Paper
- 8.1. Market Analysis, Insights and Forecast - by Application
- 9. Middle East & Africa Food Service Freezer Paper Analysis, Insights and Forecast, 2020-2032
- 9.1. Market Analysis, Insights and Forecast - by Application
- 9.1.1. Meat
- 9.1.2. Seafood
- 9.1.3. Vegetables and Fruits
- 9.1.4. Pre-packed Deli Products
- 9.1.5. Others
- 9.2. Market Analysis, Insights and Forecast - by Types
- 9.2.1. Sheet Paper
- 9.2.2. Roll Paper
- 9.1. Market Analysis, Insights and Forecast - by Application
- 10. Asia Pacific Food Service Freezer Paper Analysis, Insights and Forecast, 2020-2032
- 10.1. Market Analysis, Insights and Forecast - by Application
- 10.1.1. Meat
- 10.1.2. Seafood
- 10.1.3. Vegetables and Fruits
- 10.1.4. Pre-packed Deli Products
- 10.1.5. Others
- 10.2. Market Analysis, Insights and Forecast - by Types
- 10.2.1. Sheet Paper
- 10.2.2. Roll Paper
- 10.1. Market Analysis, Insights and Forecast - by Application
- 11. Competitive Analysis
- 11.1. Global Market Share Analysis 2025
- 11.2. Company Profiles
- 11.2.1 Reynolds
- 11.2.1.1. Overview
- 11.2.1.2. Products
- 11.2.1.3. SWOT Analysis
- 11.2.1.4. Recent Developments
- 11.2.1.5. Financials (Based on Availability)
- 11.2.2 Fulton
- 11.2.2.1. Overview
- 11.2.2.2. Products
- 11.2.2.3. SWOT Analysis
- 11.2.2.4. Recent Developments
- 11.2.2.5. Financials (Based on Availability)
- 11.2.3 Packaging Holdings
- 11.2.3.1. Overview
- 11.2.3.2. Products
- 11.2.3.3. SWOT Analysis
- 11.2.3.4. Recent Developments
- 11.2.3.5. Financials (Based on Availability)
- 11.2.4 Komar Alliance
- 11.2.4.1. Overview
- 11.2.4.2. Products
- 11.2.4.3. SWOT Analysis
- 11.2.4.4. Recent Developments
- 11.2.4.5. Financials (Based on Availability)
- 11.2.5 Imperial Dade
- 11.2.5.1. Overview
- 11.2.5.2. Products
- 11.2.5.3. SWOT Analysis
- 11.2.5.4. Recent Developments
- 11.2.5.5. Financials (Based on Availability)
- 11.2.6 Hangzhou Hongchang Paper Products
- 11.2.6.1. Overview
- 11.2.6.2. Products
- 11.2.6.3. SWOT Analysis
- 11.2.6.4. Recent Developments
- 11.2.6.5. Financials (Based on Availability)
- 11.2.7 Shandong Zhongrong Paper Products
- 11.2.7.1. Overview
- 11.2.7.2. Products
- 11.2.7.3. SWOT Analysis
- 11.2.7.4. Recent Developments
- 11.2.7.5. Financials (Based on Availability)
- 11.2.8 Zhuji Fred Packaging
- 11.2.8.1. Overview
- 11.2.8.2. Products
- 11.2.8.3. SWOT Analysis
- 11.2.8.4. Recent Developments
- 11.2.8.5. Financials (Based on Availability)
- 11.2.9 Zhejiang Heyi Tianze Industry and Trade
- 11.2.9.1. Overview
- 11.2.9.2. Products
- 11.2.9.3. SWOT Analysis
- 11.2.9.4. Recent Developments
- 11.2.9.5. Financials (Based on Availability)
- 11.2.10 Xu Xiamen Kolysen Packaging Integration
- 11.2.10.1. Overview
- 11.2.10.2. Products
- 11.2.10.3. SWOT Analysis
- 11.2.10.4. Recent Developments
- 11.2.10.5. Financials (Based on Availability)
- 11.2.11 Guangzhou Jieshen Paper
- 11.2.11.1. Overview
- 11.2.11.2. Products
- 11.2.11.3. SWOT Analysis
- 11.2.11.4. Recent Developments
- 11.2.11.5. Financials (Based on Availability)
- 11.2.12 Shandong Zhongchan Paper
- 11.2.12.1. Overview
- 11.2.12.2. Products
- 11.2.12.3. SWOT Analysis
- 11.2.12.4. Recent Developments
- 11.2.12.5. Financials (Based on Availability)
- 11.2.13 Papertec
- 11.2.13.1. Overview
- 11.2.13.2. Products
- 11.2.13.3. SWOT Analysis
- 11.2.13.4. Recent Developments
- 11.2.13.5. Financials (Based on Availability)
- 11.2.14 Georgia-Pacific
- 11.2.14.1. Overview
- 11.2.14.2. Products
- 11.2.14.3. SWOT Analysis
- 11.2.14.4. Recent Developments
- 11.2.14.5. Financials (Based on Availability)
- 11.2.15 WestRock
- 11.2.15.1. Overview
- 11.2.15.2. Products
- 11.2.15.3. SWOT Analysis
- 11.2.15.4. Recent Developments
- 11.2.15.5. Financials (Based on Availability)
- 11.2.16 McNairn Packaging
- 11.2.16.1. Overview
- 11.2.16.2. Products
- 11.2.16.3. SWOT Analysis
- 11.2.16.4. Recent Developments
- 11.2.16.5. Financials (Based on Availability)
- 11.2.17 Ultra Paper
- 11.2.17.1. Overview
- 11.2.17.2. Products
- 11.2.17.3. SWOT Analysis
- 11.2.17.4. Recent Developments
- 11.2.17.5. Financials (Based on Availability)
- 11.2.18 Meat Hugger
- 11.2.18.1. Overview
- 11.2.18.2. Products
- 11.2.18.3. SWOT Analysis
- 11.2.18.4. Recent Developments
- 11.2.18.5. Financials (Based on Availability)
- 11.2.19 Oren International
- 11.2.19.1. Overview
- 11.2.19.2. Products
- 11.2.19.3. SWOT Analysis
- 11.2.19.4. Recent Developments
- 11.2.19.5. Financials (Based on Availability)
- 11.2.20 IDL Packaging
- 11.2.20.1. Overview
- 11.2.20.2. Products
- 11.2.20.3. SWOT Analysis
- 11.2.20.4. Recent Developments
- 11.2.20.5. Financials (Based on Availability)
- 11.2.21 Gordon Paper
- 11.2.21.1. Overview
- 11.2.21.2. Products
- 11.2.21.3. SWOT Analysis
- 11.2.21.4. Recent Developments
- 11.2.21.5. Financials (Based on Availability)
- 11.2.1 Reynolds
List of Figures
- Figure 1: Global Food Service Freezer Paper Revenue Breakdown (billion, %) by Region 2025 & 2033
- Figure 2: Global Food Service Freezer Paper Volume Breakdown (K, %) by Region 2025 & 2033
- Figure 3: North America Food Service Freezer Paper Revenue (billion), by Application 2025 & 2033
- Figure 4: North America Food Service Freezer Paper Volume (K), by Application 2025 & 2033
- Figure 5: North America Food Service Freezer Paper Revenue Share (%), by Application 2025 & 2033
- Figure 6: North America Food Service Freezer Paper Volume Share (%), by Application 2025 & 2033
- Figure 7: North America Food Service Freezer Paper Revenue (billion), by Types 2025 & 2033
- Figure 8: North America Food Service Freezer Paper Volume (K), by Types 2025 & 2033
- Figure 9: North America Food Service Freezer Paper Revenue Share (%), by Types 2025 & 2033
- Figure 10: North America Food Service Freezer Paper Volume Share (%), by Types 2025 & 2033
- Figure 11: North America Food Service Freezer Paper Revenue (billion), by Country 2025 & 2033
- Figure 12: North America Food Service Freezer Paper Volume (K), by Country 2025 & 2033
- Figure 13: North America Food Service Freezer Paper Revenue Share (%), by Country 2025 & 2033
- Figure 14: North America Food Service Freezer Paper Volume Share (%), by Country 2025 & 2033
- Figure 15: South America Food Service Freezer Paper Revenue (billion), by Application 2025 & 2033
- Figure 16: South America Food Service Freezer Paper Volume (K), by Application 2025 & 2033
- Figure 17: South America Food Service Freezer Paper Revenue Share (%), by Application 2025 & 2033
- Figure 18: South America Food Service Freezer Paper Volume Share (%), by Application 2025 & 2033
- Figure 19: South America Food Service Freezer Paper Revenue (billion), by Types 2025 & 2033
- Figure 20: South America Food Service Freezer Paper Volume (K), by Types 2025 & 2033
- Figure 21: South America Food Service Freezer Paper Revenue Share (%), by Types 2025 & 2033
- Figure 22: South America Food Service Freezer Paper Volume Share (%), by Types 2025 & 2033
- Figure 23: South America Food Service Freezer Paper Revenue (billion), by Country 2025 & 2033
- Figure 24: South America Food Service Freezer Paper Volume (K), by Country 2025 & 2033
- Figure 25: South America Food Service Freezer Paper Revenue Share (%), by Country 2025 & 2033
- Figure 26: South America Food Service Freezer Paper Volume Share (%), by Country 2025 & 2033
- Figure 27: Europe Food Service Freezer Paper Revenue (billion), by Application 2025 & 2033
- Figure 28: Europe Food Service Freezer Paper Volume (K), by Application 2025 & 2033
- Figure 29: Europe Food Service Freezer Paper Revenue Share (%), by Application 2025 & 2033
- Figure 30: Europe Food Service Freezer Paper Volume Share (%), by Application 2025 & 2033
- Figure 31: Europe Food Service Freezer Paper Revenue (billion), by Types 2025 & 2033
- Figure 32: Europe Food Service Freezer Paper Volume (K), by Types 2025 & 2033
- Figure 33: Europe Food Service Freezer Paper Revenue Share (%), by Types 2025 & 2033
- Figure 34: Europe Food Service Freezer Paper Volume Share (%), by Types 2025 & 2033
- Figure 35: Europe Food Service Freezer Paper Revenue (billion), by Country 2025 & 2033
- Figure 36: Europe Food Service Freezer Paper Volume (K), by Country 2025 & 2033
- Figure 37: Europe Food Service Freezer Paper Revenue Share (%), by Country 2025 & 2033
- Figure 38: Europe Food Service Freezer Paper Volume Share (%), by Country 2025 & 2033
- Figure 39: Middle East & Africa Food Service Freezer Paper Revenue (billion), by Application 2025 & 2033
- Figure 40: Middle East & Africa Food Service Freezer Paper Volume (K), by Application 2025 & 2033
- Figure 41: Middle East & Africa Food Service Freezer Paper Revenue Share (%), by Application 2025 & 2033
- Figure 42: Middle East & Africa Food Service Freezer Paper Volume Share (%), by Application 2025 & 2033
- Figure 43: Middle East & Africa Food Service Freezer Paper Revenue (billion), by Types 2025 & 2033
- Figure 44: Middle East & Africa Food Service Freezer Paper Volume (K), by Types 2025 & 2033
- Figure 45: Middle East & Africa Food Service Freezer Paper Revenue Share (%), by Types 2025 & 2033
- Figure 46: Middle East & Africa Food Service Freezer Paper Volume Share (%), by Types 2025 & 2033
- Figure 47: Middle East & Africa Food Service Freezer Paper Revenue (billion), by Country 2025 & 2033
- Figure 48: Middle East & Africa Food Service Freezer Paper Volume (K), by Country 2025 & 2033
- Figure 49: Middle East & Africa Food Service Freezer Paper Revenue Share (%), by Country 2025 & 2033
- Figure 50: Middle East & Africa Food Service Freezer Paper Volume Share (%), by Country 2025 & 2033
- Figure 51: Asia Pacific Food Service Freezer Paper Revenue (billion), by Application 2025 & 2033
- Figure 52: Asia Pacific Food Service Freezer Paper Volume (K), by Application 2025 & 2033
- Figure 53: Asia Pacific Food Service Freezer Paper Revenue Share (%), by Application 2025 & 2033
- Figure 54: Asia Pacific Food Service Freezer Paper Volume Share (%), by Application 2025 & 2033
- Figure 55: Asia Pacific Food Service Freezer Paper Revenue (billion), by Types 2025 & 2033
- Figure 56: Asia Pacific Food Service Freezer Paper Volume (K), by Types 2025 & 2033
- Figure 57: Asia Pacific Food Service Freezer Paper Revenue Share (%), by Types 2025 & 2033
- Figure 58: Asia Pacific Food Service Freezer Paper Volume Share (%), by Types 2025 & 2033
- Figure 59: Asia Pacific Food Service Freezer Paper Revenue (billion), by Country 2025 & 2033
- Figure 60: Asia Pacific Food Service Freezer Paper Volume (K), by Country 2025 & 2033
- Figure 61: Asia Pacific Food Service Freezer Paper Revenue Share (%), by Country 2025 & 2033
- Figure 62: Asia Pacific Food Service Freezer Paper Volume Share (%), by Country 2025 & 2033
List of Tables
- Table 1: Global Food Service Freezer Paper Revenue billion Forecast, by Application 2020 & 2033
- Table 2: Global Food Service Freezer Paper Volume K Forecast, by Application 2020 & 2033
- Table 3: Global Food Service Freezer Paper Revenue billion Forecast, by Types 2020 & 2033
- Table 4: Global Food Service Freezer Paper Volume K Forecast, by Types 2020 & 2033
- Table 5: Global Food Service Freezer Paper Revenue billion Forecast, by Region 2020 & 2033
- Table 6: Global Food Service Freezer Paper Volume K Forecast, by Region 2020 & 2033
- Table 7: Global Food Service Freezer Paper Revenue billion Forecast, by Application 2020 & 2033
- Table 8: Global Food Service Freezer Paper Volume K Forecast, by Application 2020 & 2033
- Table 9: Global Food Service Freezer Paper Revenue billion Forecast, by Types 2020 & 2033
- Table 10: Global Food Service Freezer Paper Volume K Forecast, by Types 2020 & 2033
- Table 11: Global Food Service Freezer Paper Revenue billion Forecast, by Country 2020 & 2033
- Table 12: Global Food Service Freezer Paper Volume K Forecast, by Country 2020 & 2033
- Table 13: United States Food Service Freezer Paper Revenue (billion) Forecast, by Application 2020 & 2033
- Table 14: United States Food Service Freezer Paper Volume (K) Forecast, by Application 2020 & 2033
- Table 15: Canada Food Service Freezer Paper Revenue (billion) Forecast, by Application 2020 & 2033
- Table 16: Canada Food Service Freezer Paper Volume (K) Forecast, by Application 2020 & 2033
- Table 17: Mexico Food Service Freezer Paper Revenue (billion) Forecast, by Application 2020 & 2033
- Table 18: Mexico Food Service Freezer Paper Volume (K) Forecast, by Application 2020 & 2033
- Table 19: Global Food Service Freezer Paper Revenue billion Forecast, by Application 2020 & 2033
- Table 20: Global Food Service Freezer Paper Volume K Forecast, by Application 2020 & 2033
- Table 21: Global Food Service Freezer Paper Revenue billion Forecast, by Types 2020 & 2033
- Table 22: Global Food Service Freezer Paper Volume K Forecast, by Types 2020 & 2033
- Table 23: Global Food Service Freezer Paper Revenue billion Forecast, by Country 2020 & 2033
- Table 24: Global Food Service Freezer Paper Volume K Forecast, by Country 2020 & 2033
- Table 25: Brazil Food Service Freezer Paper Revenue (billion) Forecast, by Application 2020 & 2033
- Table 26: Brazil Food Service Freezer Paper Volume (K) Forecast, by Application 2020 & 2033
- Table 27: Argentina Food Service Freezer Paper Revenue (billion) Forecast, by Application 2020 & 2033
- Table 28: Argentina Food Service Freezer Paper Volume (K) Forecast, by Application 2020 & 2033
- Table 29: Rest of South America Food Service Freezer Paper Revenue (billion) Forecast, by Application 2020 & 2033
- Table 30: Rest of South America Food Service Freezer Paper Volume (K) Forecast, by Application 2020 & 2033
- Table 31: Global Food Service Freezer Paper Revenue billion Forecast, by Application 2020 & 2033
- Table 32: Global Food Service Freezer Paper Volume K Forecast, by Application 2020 & 2033
- Table 33: Global Food Service Freezer Paper Revenue billion Forecast, by Types 2020 & 2033
- Table 34: Global Food Service Freezer Paper Volume K Forecast, by Types 2020 & 2033
- Table 35: Global Food Service Freezer Paper Revenue billion Forecast, by Country 2020 & 2033
- Table 36: Global Food Service Freezer Paper Volume K Forecast, by Country 2020 & 2033
- Table 37: United Kingdom Food Service Freezer Paper Revenue (billion) Forecast, by Application 2020 & 2033
- Table 38: United Kingdom Food Service Freezer Paper Volume (K) Forecast, by Application 2020 & 2033
- Table 39: Germany Food Service Freezer Paper Revenue (billion) Forecast, by Application 2020 & 2033
- Table 40: Germany Food Service Freezer Paper Volume (K) Forecast, by Application 2020 & 2033
- Table 41: France Food Service Freezer Paper Revenue (billion) Forecast, by Application 2020 & 2033
- Table 42: France Food Service Freezer Paper Volume (K) Forecast, by Application 2020 & 2033
- Table 43: Italy Food Service Freezer Paper Revenue (billion) Forecast, by Application 2020 & 2033
- Table 44: Italy Food Service Freezer Paper Volume (K) Forecast, by Application 2020 & 2033
- Table 45: Spain Food Service Freezer Paper Revenue (billion) Forecast, by Application 2020 & 2033
- Table 46: Spain Food Service Freezer Paper Volume (K) Forecast, by Application 2020 & 2033
- Table 47: Russia Food Service Freezer Paper Revenue (billion) Forecast, by Application 2020 & 2033
- Table 48: Russia Food Service Freezer Paper Volume (K) Forecast, by Application 2020 & 2033
- Table 49: Benelux Food Service Freezer Paper Revenue (billion) Forecast, by Application 2020 & 2033
- Table 50: Benelux Food Service Freezer Paper Volume (K) Forecast, by Application 2020 & 2033
- Table 51: Nordics Food Service Freezer Paper Revenue (billion) Forecast, by Application 2020 & 2033
- Table 52: Nordics Food Service Freezer Paper Volume (K) Forecast, by Application 2020 & 2033
- Table 53: Rest of Europe Food Service Freezer Paper Revenue (billion) Forecast, by Application 2020 & 2033
- Table 54: Rest of Europe Food Service Freezer Paper Volume (K) Forecast, by Application 2020 & 2033
- Table 55: Global Food Service Freezer Paper Revenue billion Forecast, by Application 2020 & 2033
- Table 56: Global Food Service Freezer Paper Volume K Forecast, by Application 2020 & 2033
- Table 57: Global Food Service Freezer Paper Revenue billion Forecast, by Types 2020 & 2033
- Table 58: Global Food Service Freezer Paper Volume K Forecast, by Types 2020 & 2033
- Table 59: Global Food Service Freezer Paper Revenue billion Forecast, by Country 2020 & 2033
- Table 60: Global Food Service Freezer Paper Volume K Forecast, by Country 2020 & 2033
- Table 61: Turkey Food Service Freezer Paper Revenue (billion) Forecast, by Application 2020 & 2033
- Table 62: Turkey Food Service Freezer Paper Volume (K) Forecast, by Application 2020 & 2033
- Table 63: Israel Food Service Freezer Paper Revenue (billion) Forecast, by Application 2020 & 2033
- Table 64: Israel Food Service Freezer Paper Volume (K) Forecast, by Application 2020 & 2033
- Table 65: GCC Food Service Freezer Paper Revenue (billion) Forecast, by Application 2020 & 2033
- Table 66: GCC Food Service Freezer Paper Volume (K) Forecast, by Application 2020 & 2033
- Table 67: North Africa Food Service Freezer Paper Revenue (billion) Forecast, by Application 2020 & 2033
- Table 68: North Africa Food Service Freezer Paper Volume (K) Forecast, by Application 2020 & 2033
- Table 69: South Africa Food Service Freezer Paper Revenue (billion) Forecast, by Application 2020 & 2033
- Table 70: South Africa Food Service Freezer Paper Volume (K) Forecast, by Application 2020 & 2033
- Table 71: Rest of Middle East & Africa Food Service Freezer Paper Revenue (billion) Forecast, by Application 2020 & 2033
- Table 72: Rest of Middle East & Africa Food Service Freezer Paper Volume (K) Forecast, by Application 2020 & 2033
- Table 73: Global Food Service Freezer Paper Revenue billion Forecast, by Application 2020 & 2033
- Table 74: Global Food Service Freezer Paper Volume K Forecast, by Application 2020 & 2033
- Table 75: Global Food Service Freezer Paper Revenue billion Forecast, by Types 2020 & 2033
- Table 76: Global Food Service Freezer Paper Volume K Forecast, by Types 2020 & 2033
- Table 77: Global Food Service Freezer Paper Revenue billion Forecast, by Country 2020 & 2033
- Table 78: Global Food Service Freezer Paper Volume K Forecast, by Country 2020 & 2033
- Table 79: China Food Service Freezer Paper Revenue (billion) Forecast, by Application 2020 & 2033
- Table 80: China Food Service Freezer Paper Volume (K) Forecast, by Application 2020 & 2033
- Table 81: India Food Service Freezer Paper Revenue (billion) Forecast, by Application 2020 & 2033
- Table 82: India Food Service Freezer Paper Volume (K) Forecast, by Application 2020 & 2033
- Table 83: Japan Food Service Freezer Paper Revenue (billion) Forecast, by Application 2020 & 2033
- Table 84: Japan Food Service Freezer Paper Volume (K) Forecast, by Application 2020 & 2033
- Table 85: South Korea Food Service Freezer Paper Revenue (billion) Forecast, by Application 2020 & 2033
- Table 86: South Korea Food Service Freezer Paper Volume (K) Forecast, by Application 2020 & 2033
- Table 87: ASEAN Food Service Freezer Paper Revenue (billion) Forecast, by Application 2020 & 2033
- Table 88: ASEAN Food Service Freezer Paper Volume (K) Forecast, by Application 2020 & 2033
- Table 89: Oceania Food Service Freezer Paper Revenue (billion) Forecast, by Application 2020 & 2033
- Table 90: Oceania Food Service Freezer Paper Volume (K) Forecast, by Application 2020 & 2033
- Table 91: Rest of Asia Pacific Food Service Freezer Paper Revenue (billion) Forecast, by Application 2020 & 2033
- Table 92: Rest of Asia Pacific Food Service Freezer Paper Volume (K) Forecast, by Application 2020 & 2033
Frequently Asked Questions
1. What is the projected Compound Annual Growth Rate (CAGR) of the Food Service Freezer Paper?
The projected CAGR is approximately 6.62%.
2. Which companies are prominent players in the Food Service Freezer Paper?
Key companies in the market include Reynolds, Fulton, Packaging Holdings, Komar Alliance, Imperial Dade, Hangzhou Hongchang Paper Products, Shandong Zhongrong Paper Products, Zhuji Fred Packaging, Zhejiang Heyi Tianze Industry and Trade, Xu Xiamen Kolysen Packaging Integration, Guangzhou Jieshen Paper, Shandong Zhongchan Paper, Papertec, Georgia-Pacific, WestRock, McNairn Packaging, Ultra Paper, Meat Hugger, Oren International, IDL Packaging, Gordon Paper.
3. What are the main segments of the Food Service Freezer Paper?
The market segments include Application, Types.
4. Can you provide details about the market size?
The market size is estimated to be USD 14.55 billion as of 2022.
5. What are some drivers contributing to market growth?
N/A
6. What are the notable trends driving market growth?
N/A
7. Are there any restraints impacting market growth?
N/A
8. Can you provide examples of recent developments in the market?
N/A
9. What pricing options are available for accessing the report?
Pricing options include single-user, multi-user, and enterprise licenses priced at USD 3350.00, USD 5025.00, and USD 6700.00 respectively.
10. Is the market size provided in terms of value or volume?
The market size is provided in terms of value, measured in billion and volume, measured in K.
11. Are there any specific market keywords associated with the report?
Yes, the market keyword associated with the report is "Food Service Freezer Paper," which aids in identifying and referencing the specific market segment covered.
12. How do I determine which pricing option suits my needs best?
The pricing options vary based on user requirements and access needs. Individual users may opt for single-user licenses, while businesses requiring broader access may choose multi-user or enterprise licenses for cost-effective access to the report.
13. Are there any additional resources or data provided in the Food Service Freezer Paper report?
While the report offers comprehensive insights, it's advisable to review the specific contents or supplementary materials provided to ascertain if additional resources or data are available.
14. How can I stay updated on further developments or reports in the Food Service Freezer Paper?
To stay informed about further developments, trends, and reports in the Food Service Freezer Paper, consider subscribing to industry newsletters, following relevant companies and organizations, or regularly checking reputable industry news sources and publications.
Methodology
Step 1 - Identification of Relevant Samples Size from Population Database


Step 2 - Approaches for Defining Global Market Size (Value, Volume* & Price*)

Note*: In applicable scenarios
Step 3 - Data Sources
Primary Research
- Web Analytics
- Survey Reports
- Research Institute
- Latest Research Reports
- Opinion Leaders
Secondary Research
- Annual Reports
- White Paper
- Latest Press Release
- Industry Association
- Paid Database
- Investor Presentations

Step 4 - Data Triangulation
Involves using different sources of information in order to increase the validity of a study
These sources are likely to be stakeholders in a program - participants, other researchers, program staff, other community members, and so on.
Then we put all data in single framework & apply various statistical tools to find out the dynamic on the market.
During the analysis stage, feedback from the stakeholder groups would be compared to determine areas of agreement as well as areas of divergence