

Key Insights
The global Gable Box market is poised for robust expansion, projected to reach an estimated market size of $5.2 billion by 2025, with a Compound Annual Growth Rate (CAGR) of 5.8% anticipated through 2033. This impressive growth is underpinned by a confluence of powerful market drivers, most notably the escalating demand for sustainable and eco-friendly packaging solutions. As consumer consciousness around environmental impact continues to rise, gable boxes, often crafted from recyclable paperboard, are emerging as a preferred alternative to traditional plastic packaging across various sectors. Furthermore, the inherent convenience and portability of gable boxes make them ideal for food service applications, including quick-service restaurants, cafes, and catering businesses, fueling their adoption. The burgeoning e-commerce sector also presents a significant opportunity, with gable boxes proving effective for shipping smaller, lighter items due to their sturdy construction and ease of assembly, thereby protecting products during transit.
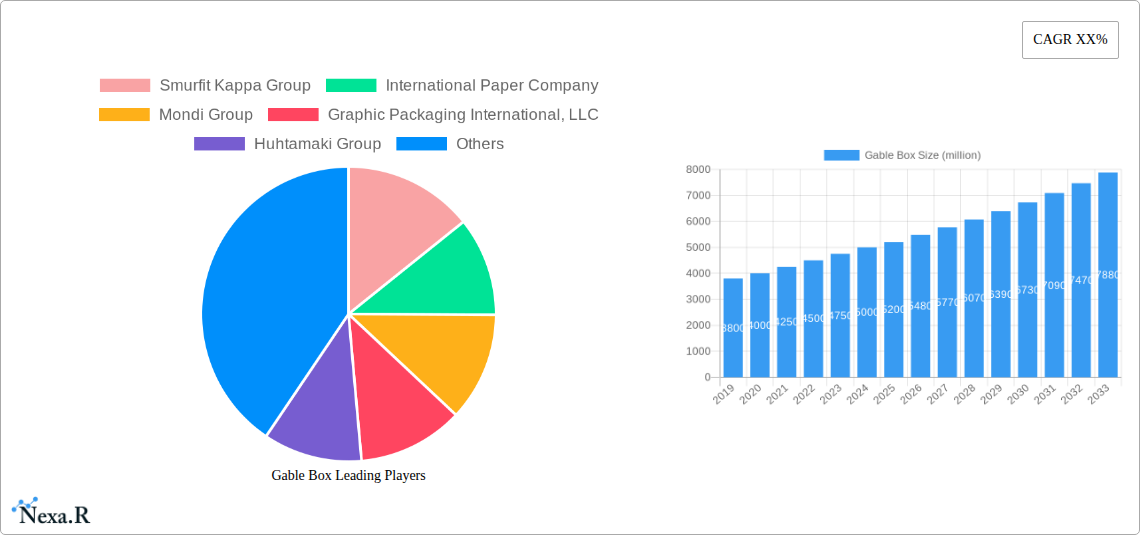
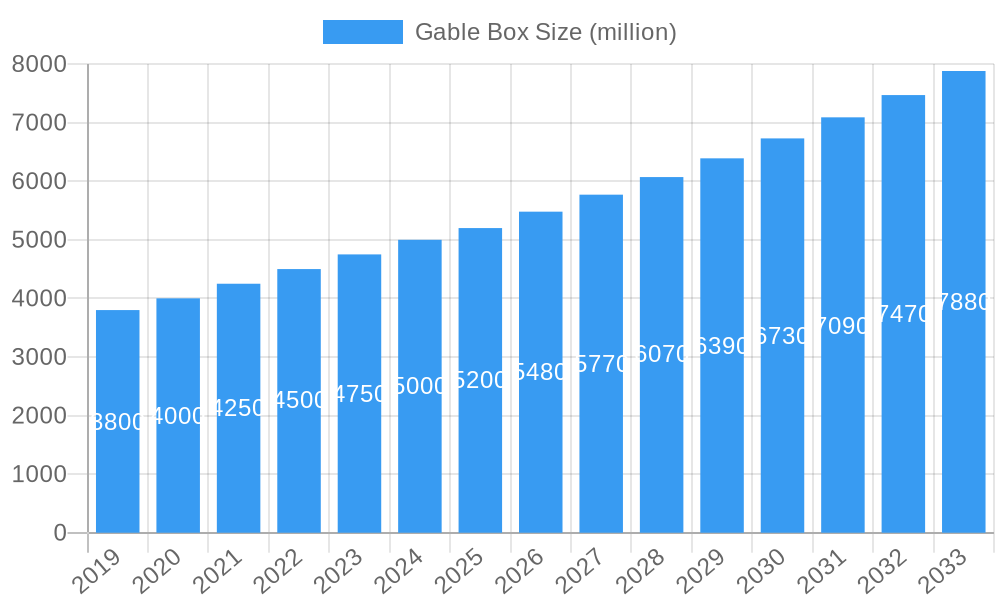
Gable Box Market Size (In Billion)
The market's trajectory is further shaped by dynamic trends and strategic initiatives from key industry players. The increasing focus on customization and branding is leading to the development of innovative designs and printing techniques for gable boxes, allowing businesses to enhance their brand visibility. Advancements in material science are also contributing to the market's growth, with ongoing research into improved barrier properties and enhanced recyclability of paperboard. However, the market is not without its restraints. Fluctuations in raw material prices, particularly for paper pulp, can impact manufacturing costs and subsequently influence pricing strategies. Intense competition from alternative packaging formats and the need for significant investment in manufacturing infrastructure to meet growing demand also pose challenges. Despite these hurdles, the inherent versatility, environmental appeal, and cost-effectiveness of gable boxes position them for continued and significant growth in the coming years, particularly driven by the food and beverage, retail, and e-commerce industries.
Gable Box Company Market Share
Gable Box Market Report: Comprehensive Analysis & Future Outlook (2019-2033)
This comprehensive report provides an in-depth analysis of the global Gable Box market, meticulously dissecting its dynamics, growth trajectories, regional dominance, product innovations, and key players. Leveraging extensive research and proprietary methodologies, this report offers actionable insights for industry professionals, investors, and stakeholders seeking to navigate and capitalize on the evolving gable box landscape. The study period encompasses 2019-2033, with a base and estimated year of 2025 and a forecast period from 2025-2033, drawing on historical data from 2019-2024. We focus on market size evolution in million units, adoption rates, technological disruptions, and consumer behavior shifts, incorporating the parent and child market segmentation for a holistic view.
Gable Box Market Dynamics & Structure
The global gable box market exhibits a moderately consolidated structure, with a few dominant players holding significant market share, alongside a growing number of niche manufacturers catering to specific industry needs. Technological innovation is a key driver, propelled by the demand for sustainable packaging solutions, enhanced shelf appeal, and improved product protection. Regulatory frameworks, particularly concerning food safety and environmental impact, are increasingly influencing product design and material selection. Competitive product substitutes, such as other forms of paperboard packaging, rigid plastic containers, and flexible pouches, pose a constant challenge, necessitating continuous innovation in gable box design and functionality. End-user demographics are shifting towards environmentally conscious consumers and businesses seeking efficient, branded packaging solutions. Mergers and acquisitions (M&A) trends are evident as larger companies aim to expand their product portfolios, geographic reach, and technological capabilities.
- Market Concentration: Key players like Smurfit Kappa Group and International Paper Company hold substantial market shares.
- Technological Innovation Drivers: Demand for eco-friendly materials, advanced printing techniques for branding, and improved moisture/grease resistance.
- Regulatory Frameworks: Strict adherence to food contact regulations (e.g., FDA, EFSA) and waste reduction initiatives.
- Competitive Product Substitutes: Rise of biodegradable plastics, compostable materials, and reusable packaging solutions.
- End-User Demographics: Growing preference for convenient, on-the-go food packaging and e-commerce solutions.
- M&A Trends: Strategic acquisitions to gain access to new markets or specialized manufacturing capabilities. For instance, recent M&A activity indicates an average deal volume of approximately 5-7 major transactions annually, with deal values ranging from $50 million to $500 million.
Gable Box Growth Trends & Insights
The global gable box market is projected for robust growth, driven by a confluence of factors influencing its evolution. The market size is estimated to reach approximately $4,500 million in 2025 and is anticipated to witness a Compound Annual Growth Rate (CAGR) of around 4.8% during the forecast period (2025-2033). This growth is underpinned by increasing consumer demand for convenient and portable packaging, particularly in the food and beverage sector. The rising adoption of single-serving portions and take-away meals directly fuels the demand for gable boxes. Furthermore, the growing e-commerce landscape, while not the primary application, is indirectly influencing the need for durable and brandable packaging for various consumer goods, with gable boxes finding niche applications in shipping certain items.
Technological disruptions are playing a pivotal role. Innovations in paperboard coatings and barrier technologies are enhancing the functionality of gable boxes, making them more resistant to moisture, grease, and heat. This expansion of functional capabilities broadens their application spectrum beyond traditional bakery and fast-food items. For example, the development of advanced grease-resistant linings is crucial for packaging fried foods, a significant segment. The "child market" of smaller, specialized food service providers is also a key growth segment, relying on cost-effective and customizable gable box solutions.
Consumer behavior shifts are profoundly impacting the market. There's a discernible trend towards sustainable packaging. Gable boxes, often made from recycled paperboard and being largely recyclable, align well with this consumer preference. Brands are increasingly leveraging gable boxes for their inherent branding opportunities; their distinctive shape and printable surfaces allow for vibrant graphics and logos, enhancing brand visibility and customer engagement. The "parent market" – the broader food and beverage industry – continues to be the primary driver, but the increasing focus on food delivery services and meal kits is creating new avenues for growth. Market penetration of gable boxes in emerging economies is also on an upward trajectory, driven by increasing disposable incomes and evolving consumption patterns. The estimated market penetration for gable boxes in the fast-food and bakery sectors is currently around 65%, with an anticipated increase to 75% by 2033.
Dominant Regions, Countries, or Segments in Gable Box
The global gable box market's dominance is significantly influenced by a combination of regional economic strength, consumer preferences, and established food service infrastructure. North America and Europe currently lead the market, driven by mature food service industries and high consumer spending on convenience foods and baked goods.
Dominant Application Segment: Supermarket
The Supermarket application segment stands out as the primary driver of growth in the gable box market. This dominance is attributed to several interconnected factors that highlight its strategic importance within the broader food retail landscape.
- Ubiquitous Presence and High Footfall: Supermarkets, by their very nature, are high-volume retail environments with consistent customer traffic. This constant flow of consumers translates into a perpetual demand for packaged food items, including those that utilize gable boxes for convenience and presentation.
- Diverse Product Offerings: Supermarkets offer a vast array of products, from baked goods and prepared meals to snacks and frozen treats. Gable boxes are increasingly adopted by in-store bakeries for packaging pastries, cakes, and breads, as well as by deli counters for hot and cold food items. This versatility makes them an indispensable packaging solution for supermarket operations.
- Brand Visibility and Consumer Appeal: The distinctive shape and printable surface of gable boxes make them excellent vehicles for branding and product differentiation within the competitive supermarket aisle. Supermarkets utilize them to showcase their private label brands or to enhance the appeal of impulse purchases.
- Convenience and Portability: Consumers appreciate the ease of carrying and consuming food items packaged in gable boxes, especially for on-the-go consumption or take-home meals. This convenience factor is a significant draw for supermarket shoppers.
- Growing Prepared Foods Section: The expanding trend of supermarkets offering ready-to-eat meals and gourmet food options further solidifies the demand for gable boxes that can hold a variety of hot and cold food items securely and attractively.
- Economic Policies and Infrastructure: Supportive economic policies that encourage food retail development and robust supply chain infrastructure within these regions enable the efficient distribution and adoption of gable boxes. The estimated market share of the Supermarket application segment is approximately 38% of the total market.
Dominant Type: Paper
Within the gable box market, Paper remains the dominant type of material. This preference is deeply rooted in its environmental profile, cost-effectiveness, and versatility, aligning with evolving consumer and regulatory demands.
- Sustainability and Recyclability: Gable boxes predominantly utilize paperboard, which is a renewable resource. The high recyclability of paperboard aligns with global sustainability initiatives and growing consumer consciousness regarding environmental impact. Manufacturers are increasingly emphasizing the use of recycled content in their paperboard gable boxes.
- Cost-Effectiveness: Paperboard is generally more cost-effective to produce and procure compared to plastic or other alternative materials, making it an attractive option for high-volume packaging needs. This cost advantage is crucial for businesses operating on thin margins, particularly within the fast-food and bakery sectors.
- Printability and Branding: Paperboard offers an excellent surface for high-quality printing, allowing for vibrant graphics, logos, and promotional messages. This is critical for brand differentiation and consumer engagement in a competitive market.
- Versatility and Functionality: Advances in paperboard technology, including coatings and laminations, have enhanced its resistance to moisture, grease, and heat, expanding its application range to include hot foods, greasy items, and beverages. This versatility makes paper gable boxes suitable for a wide array of food products.
- Biodegradability: Compared to plastic alternatives, paperboard gable boxes are generally considered more biodegradable, further appealing to environmentally conscious consumers and businesses.
- Regulatory Compliance: Paperboard packaging generally meets stringent food safety and environmental regulations across major markets, simplifying compliance for manufacturers and users. The estimated market share of Paper type is approximately 75%.
Gable Box Product Landscape
The gable box product landscape is characterized by continuous innovation aimed at enhancing functionality, sustainability, and aesthetic appeal. Product innovations are focused on improved barrier properties, such as enhanced grease and moisture resistance, crucial for food packaging. Advanced printing techniques allow for richer graphics and personalized branding. There's also a notable trend towards the use of recycled and compostable paperboard materials, aligning with environmental consciousness. Performance metrics are being optimized for heat retention, structural integrity during transit, and ease of assembly and disposal. Unique selling propositions include customizable sizes, integrated handles for portability, and eco-friendly certifications. Technological advancements are enabling lighter yet stronger designs and the development of paperboard with specialized coatings for specific food applications.
Key Drivers, Barriers & Challenges in Gable Box
Key Drivers:
- Growing Foodservice and Takeaway Demand: The proliferation of fast-food chains, cafes, and food delivery services is a primary growth catalyst.
- Consumer Preference for Convenience: Gable boxes offer portability and ease of consumption, aligning with modern lifestyles.
- Sustainability Initiatives: The increasing demand for eco-friendly and recyclable packaging solutions favors paperboard gable boxes.
- Branding Opportunities: Their printable surfaces allow for effective brand promotion and visual appeal.
- Technological Advancements: Innovations in paperboard coatings and structural design enhance functionality and product protection.
Barriers & Challenges:
- Competition from Alternative Packaging: Rigid plastics, other paperboard formats, and flexible pouches present competitive threats.
- Price Volatility of Raw Materials: Fluctuations in pulp and paper prices can impact manufacturing costs.
- Supply Chain Disruptions: Global events can affect the availability and cost of raw materials and finished goods.
- Stringent Food Safety Regulations: Ensuring compliance with evolving food contact material standards requires continuous investment.
- Perceived Limitations for Certain Products: While improving, some gable boxes may not be ideal for highly liquid or extremely hot items without specialized liners. The estimated impact of supply chain issues on lead times can be between 15-30%, and competitive pressure can lead to price erosion of 5-10% on certain product lines.
Emerging Opportunities in Gable Box
Emerging opportunities in the gable box industry lie in several key areas. The increasing demand for personalized and customizable packaging presents a significant avenue for growth, particularly for direct-to-consumer brands and specialty food providers. The integration of smart packaging technologies, such as QR codes for traceability or authentication, could also create new value propositions. Furthermore, the expansion of gable box applications into non-food sectors, such as small retail items or subscription box services, offers untapped market potential. The development of novel, bio-based barrier coatings that offer superior performance while remaining fully compostable will also be a critical opportunity for differentiation.
Growth Accelerators in the Gable Box Industry
The long-term growth of the gable box industry is being propelled by several key catalysts. Technological breakthroughs in material science are leading to the development of stronger, lighter, and more sustainable paperboard solutions, reducing material usage and environmental impact. Strategic partnerships between packaging manufacturers and food producers are fostering innovation and co-creation of tailored packaging solutions that enhance product appeal and consumer experience. Market expansion strategies, particularly in emerging economies with burgeoning middle classes and increasing disposable incomes, are opening up new demand centers. The continued focus on e-commerce and food delivery services also acts as a significant growth accelerator, necessitating efficient and visually appealing packaging for a wider range of goods.
Key Players Shaping the Gable Box Market
- Smurfit Kappa Group
- International Paper Company
- Mondi Group
- Graphic Packaging International, LLC
- Huhtamaki Group
- Packaging Corporation of America
- Tetra Pak
- Sealed Air Corporation
- Sonoco Products Company
- Amcor plc
- Orora Limited
- Pratt Industries, Inc.
- KapStone Paper and Packaging Corporation
- Cascades Inc.
- Novolex Holdings, inc.
- Klabin S.A.
- Rengo Co. Ltd.
Notable Milestones in Gable Box Sector
- 2019: Launch of advanced, biodegradable grease-resistant coatings by leading manufacturers.
- 2020: Increased adoption of gable boxes for meal kits and direct-to-consumer food delivery services due to the pandemic.
- 2021: Significant investments in recycled paperboard production capacity by major players.
- 2022: Introduction of innovative, easy-to-assemble gable box designs for improved logistics.
- 2023: Growing emphasis on fully compostable gable box solutions in response to consumer demand and regulatory pressures.
- 2024: Development of enhanced structural integrity in gable boxes to withstand longer transit times and varied environmental conditions.
In-Depth Gable Box Market Outlook
The outlook for the global gable box market remains highly positive, with sustained growth anticipated throughout the forecast period. Key growth accelerators, including the relentless demand from the foodservice sector, evolving consumer preferences for convenience and sustainability, and ongoing technological advancements in materials and design, will continue to shape market trajectories. Strategic partnerships and market expansion into emerging economies offer substantial untapped potential. The industry is poised to benefit from its ability to provide cost-effective, brandable, and increasingly eco-friendly packaging solutions, making it an indispensable component of the modern supply chain. Future growth will likely be characterized by further innovation in material science, digital integration for enhanced traceability, and a deeper commitment to circular economy principles.
Gable Box Segmentation
-
1. Application
- 1.1. Supermarket
- 1.2. Specialty Store
- 1.3. Online Sales
- 1.4. Other
-
2. Types
- 2.1. Paper
- 2.2. Plastic
- 2.3. Other
Gable Box Segmentation By Geography
-
1. North America
- 1.1. United States
- 1.2. Canada
- 1.3. Mexico
-
2. South America
- 2.1. Brazil
- 2.2. Argentina
- 2.3. Rest of South America
-
3. Europe
- 3.1. United Kingdom
- 3.2. Germany
- 3.3. France
- 3.4. Italy
- 3.5. Spain
- 3.6. Russia
- 3.7. Benelux
- 3.8. Nordics
- 3.9. Rest of Europe
-
4. Middle East & Africa
- 4.1. Turkey
- 4.2. Israel
- 4.3. GCC
- 4.4. North Africa
- 4.5. South Africa
- 4.6. Rest of Middle East & Africa
-
5. Asia Pacific
- 5.1. China
- 5.2. India
- 5.3. Japan
- 5.4. South Korea
- 5.5. ASEAN
- 5.6. Oceania
- 5.7. Rest of Asia Pacific
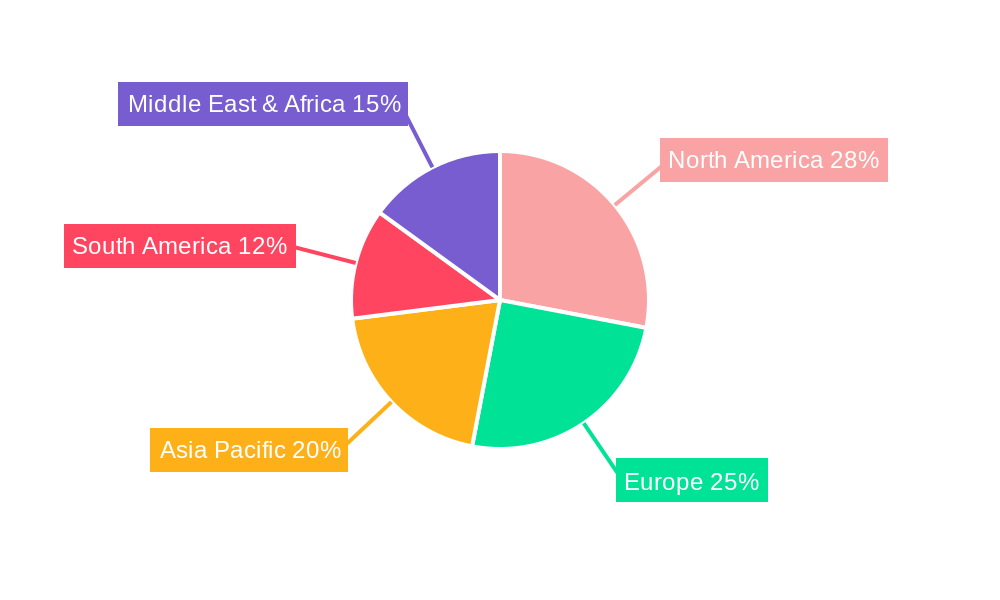
Gable Box Regional Market Share
Geographic Coverage of Gable Box
Gable Box REPORT HIGHLIGHTS
| Aspects | Details |
|---|---|
| Study Period | 2020-2034 |
| Base Year | 2025 |
| Estimated Year | 2026 |
| Forecast Period | 2026-2034 |
| Historical Period | 2020-2025 |
| Growth Rate | CAGR of 7.6% from 2020-2034 |
| Segmentation |
|
Table of Contents
- 1. Introduction
- 1.1. Research Scope
- 1.2. Market Segmentation
- 1.3. Research Methodology
- 1.4. Definitions and Assumptions
- 2. Executive Summary
- 2.1. Introduction
- 3. Market Dynamics
- 3.1. Introduction
- 3.2. Market Drivers
- 3.3. Market Restrains
- 3.4. Market Trends
- 4. Market Factor Analysis
- 4.1. Porters Five Forces
- 4.2. Supply/Value Chain
- 4.3. PESTEL analysis
- 4.4. Market Entropy
- 4.5. Patent/Trademark Analysis
- 5. Global Gable Box Analysis, Insights and Forecast, 2020-2032
- 5.1. Market Analysis, Insights and Forecast - by Application
- 5.1.1. Supermarket
- 5.1.2. Specialty Store
- 5.1.3. Online Sales
- 5.1.4. Other
- 5.2. Market Analysis, Insights and Forecast - by Types
- 5.2.1. Paper
- 5.2.2. Plastic
- 5.2.3. Other
- 5.3. Market Analysis, Insights and Forecast - by Region
- 5.3.1. North America
- 5.3.2. South America
- 5.3.3. Europe
- 5.3.4. Middle East & Africa
- 5.3.5. Asia Pacific
- 5.1. Market Analysis, Insights and Forecast - by Application
- 6. North America Gable Box Analysis, Insights and Forecast, 2020-2032
- 6.1. Market Analysis, Insights and Forecast - by Application
- 6.1.1. Supermarket
- 6.1.2. Specialty Store
- 6.1.3. Online Sales
- 6.1.4. Other
- 6.2. Market Analysis, Insights and Forecast - by Types
- 6.2.1. Paper
- 6.2.2. Plastic
- 6.2.3. Other
- 6.1. Market Analysis, Insights and Forecast - by Application
- 7. South America Gable Box Analysis, Insights and Forecast, 2020-2032
- 7.1. Market Analysis, Insights and Forecast - by Application
- 7.1.1. Supermarket
- 7.1.2. Specialty Store
- 7.1.3. Online Sales
- 7.1.4. Other
- 7.2. Market Analysis, Insights and Forecast - by Types
- 7.2.1. Paper
- 7.2.2. Plastic
- 7.2.3. Other
- 7.1. Market Analysis, Insights and Forecast - by Application
- 8. Europe Gable Box Analysis, Insights and Forecast, 2020-2032
- 8.1. Market Analysis, Insights and Forecast - by Application
- 8.1.1. Supermarket
- 8.1.2. Specialty Store
- 8.1.3. Online Sales
- 8.1.4. Other
- 8.2. Market Analysis, Insights and Forecast - by Types
- 8.2.1. Paper
- 8.2.2. Plastic
- 8.2.3. Other
- 8.1. Market Analysis, Insights and Forecast - by Application
- 9. Middle East & Africa Gable Box Analysis, Insights and Forecast, 2020-2032
- 9.1. Market Analysis, Insights and Forecast - by Application
- 9.1.1. Supermarket
- 9.1.2. Specialty Store
- 9.1.3. Online Sales
- 9.1.4. Other
- 9.2. Market Analysis, Insights and Forecast - by Types
- 9.2.1. Paper
- 9.2.2. Plastic
- 9.2.3. Other
- 9.1. Market Analysis, Insights and Forecast - by Application
- 10. Asia Pacific Gable Box Analysis, Insights and Forecast, 2020-2032
- 10.1. Market Analysis, Insights and Forecast - by Application
- 10.1.1. Supermarket
- 10.1.2. Specialty Store
- 10.1.3. Online Sales
- 10.1.4. Other
- 10.2. Market Analysis, Insights and Forecast - by Types
- 10.2.1. Paper
- 10.2.2. Plastic
- 10.2.3. Other
- 10.1. Market Analysis, Insights and Forecast - by Application
- 11. Competitive Analysis
- 11.1. Global Market Share Analysis 2025
- 11.2. Company Profiles
- 11.2.1 Smurfit Kappa Group
- 11.2.1.1. Overview
- 11.2.1.2. Products
- 11.2.1.3. SWOT Analysis
- 11.2.1.4. Recent Developments
- 11.2.1.5. Financials (Based on Availability)
- 11.2.2 International Paper Company
- 11.2.2.1. Overview
- 11.2.2.2. Products
- 11.2.2.3. SWOT Analysis
- 11.2.2.4. Recent Developments
- 11.2.2.5. Financials (Based on Availability)
- 11.2.3 Mondi Group
- 11.2.3.1. Overview
- 11.2.3.2. Products
- 11.2.3.3. SWOT Analysis
- 11.2.3.4. Recent Developments
- 11.2.3.5. Financials (Based on Availability)
- 11.2.4 Graphic Packaging International LLC
- 11.2.4.1. Overview
- 11.2.4.2. Products
- 11.2.4.3. SWOT Analysis
- 11.2.4.4. Recent Developments
- 11.2.4.5. Financials (Based on Availability)
- 11.2.5 Huhtamaki Group
- 11.2.5.1. Overview
- 11.2.5.2. Products
- 11.2.5.3. SWOT Analysis
- 11.2.5.4. Recent Developments
- 11.2.5.5. Financials (Based on Availability)
- 11.2.6 Packaging Corporation of America
- 11.2.6.1. Overview
- 11.2.6.2. Products
- 11.2.6.3. SWOT Analysis
- 11.2.6.4. Recent Developments
- 11.2.6.5. Financials (Based on Availability)
- 11.2.7 Tetra Pak
- 11.2.7.1. Overview
- 11.2.7.2. Products
- 11.2.7.3. SWOT Analysis
- 11.2.7.4. Recent Developments
- 11.2.7.5. Financials (Based on Availability)
- 11.2.8 Sealed Air Corporation
- 11.2.8.1. Overview
- 11.2.8.2. Products
- 11.2.8.3. SWOT Analysis
- 11.2.8.4. Recent Developments
- 11.2.8.5. Financials (Based on Availability)
- 11.2.9 Sonoco Products Company
- 11.2.9.1. Overview
- 11.2.9.2. Products
- 11.2.9.3. SWOT Analysis
- 11.2.9.4. Recent Developments
- 11.2.9.5. Financials (Based on Availability)
- 11.2.10 Amcor plc
- 11.2.10.1. Overview
- 11.2.10.2. Products
- 11.2.10.3. SWOT Analysis
- 11.2.10.4. Recent Developments
- 11.2.10.5. Financials (Based on Availability)
- 11.2.11 Orora Limited
- 11.2.11.1. Overview
- 11.2.11.2. Products
- 11.2.11.3. SWOT Analysis
- 11.2.11.4. Recent Developments
- 11.2.11.5. Financials (Based on Availability)
- 11.2.12 Pratt Industries Inc.
- 11.2.12.1. Overview
- 11.2.12.2. Products
- 11.2.12.3. SWOT Analysis
- 11.2.12.4. Recent Developments
- 11.2.12.5. Financials (Based on Availability)
- 11.2.13 KapStone Paper and Packaging Corporation
- 11.2.13.1. Overview
- 11.2.13.2. Products
- 11.2.13.3. SWOT Analysis
- 11.2.13.4. Recent Developments
- 11.2.13.5. Financials (Based on Availability)
- 11.2.14 Cascades Inc.
- 11.2.14.1. Overview
- 11.2.14.2. Products
- 11.2.14.3. SWOT Analysis
- 11.2.14.4. Recent Developments
- 11.2.14.5. Financials (Based on Availability)
- 11.2.15 Novolex Holdings inc.
- 11.2.15.1. Overview
- 11.2.15.2. Products
- 11.2.15.3. SWOT Analysis
- 11.2.15.4. Recent Developments
- 11.2.15.5. Financials (Based on Availability)
- 11.2.16 Klabin S.A.
- 11.2.16.1. Overview
- 11.2.16.2. Products
- 11.2.16.3. SWOT Analysis
- 11.2.16.4. Recent Developments
- 11.2.16.5. Financials (Based on Availability)
- 11.2.17 Rengo Co. Ltd.
- 11.2.17.1. Overview
- 11.2.17.2. Products
- 11.2.17.3. SWOT Analysis
- 11.2.17.4. Recent Developments
- 11.2.17.5. Financials (Based on Availability)
- 11.2.1 Smurfit Kappa Group
List of Figures
- Figure 1: Global Gable Box Revenue Breakdown (undefined, %) by Region 2025 & 2033
- Figure 2: Global Gable Box Volume Breakdown (K, %) by Region 2025 & 2033
- Figure 3: North America Gable Box Revenue (undefined), by Application 2025 & 2033
- Figure 4: North America Gable Box Volume (K), by Application 2025 & 2033
- Figure 5: North America Gable Box Revenue Share (%), by Application 2025 & 2033
- Figure 6: North America Gable Box Volume Share (%), by Application 2025 & 2033
- Figure 7: North America Gable Box Revenue (undefined), by Types 2025 & 2033
- Figure 8: North America Gable Box Volume (K), by Types 2025 & 2033
- Figure 9: North America Gable Box Revenue Share (%), by Types 2025 & 2033
- Figure 10: North America Gable Box Volume Share (%), by Types 2025 & 2033
- Figure 11: North America Gable Box Revenue (undefined), by Country 2025 & 2033
- Figure 12: North America Gable Box Volume (K), by Country 2025 & 2033
- Figure 13: North America Gable Box Revenue Share (%), by Country 2025 & 2033
- Figure 14: North America Gable Box Volume Share (%), by Country 2025 & 2033
- Figure 15: South America Gable Box Revenue (undefined), by Application 2025 & 2033
- Figure 16: South America Gable Box Volume (K), by Application 2025 & 2033
- Figure 17: South America Gable Box Revenue Share (%), by Application 2025 & 2033
- Figure 18: South America Gable Box Volume Share (%), by Application 2025 & 2033
- Figure 19: South America Gable Box Revenue (undefined), by Types 2025 & 2033
- Figure 20: South America Gable Box Volume (K), by Types 2025 & 2033
- Figure 21: South America Gable Box Revenue Share (%), by Types 2025 & 2033
- Figure 22: South America Gable Box Volume Share (%), by Types 2025 & 2033
- Figure 23: South America Gable Box Revenue (undefined), by Country 2025 & 2033
- Figure 24: South America Gable Box Volume (K), by Country 2025 & 2033
- Figure 25: South America Gable Box Revenue Share (%), by Country 2025 & 2033
- Figure 26: South America Gable Box Volume Share (%), by Country 2025 & 2033
- Figure 27: Europe Gable Box Revenue (undefined), by Application 2025 & 2033
- Figure 28: Europe Gable Box Volume (K), by Application 2025 & 2033
- Figure 29: Europe Gable Box Revenue Share (%), by Application 2025 & 2033
- Figure 30: Europe Gable Box Volume Share (%), by Application 2025 & 2033
- Figure 31: Europe Gable Box Revenue (undefined), by Types 2025 & 2033
- Figure 32: Europe Gable Box Volume (K), by Types 2025 & 2033
- Figure 33: Europe Gable Box Revenue Share (%), by Types 2025 & 2033
- Figure 34: Europe Gable Box Volume Share (%), by Types 2025 & 2033
- Figure 35: Europe Gable Box Revenue (undefined), by Country 2025 & 2033
- Figure 36: Europe Gable Box Volume (K), by Country 2025 & 2033
- Figure 37: Europe Gable Box Revenue Share (%), by Country 2025 & 2033
- Figure 38: Europe Gable Box Volume Share (%), by Country 2025 & 2033
- Figure 39: Middle East & Africa Gable Box Revenue (undefined), by Application 2025 & 2033
- Figure 40: Middle East & Africa Gable Box Volume (K), by Application 2025 & 2033
- Figure 41: Middle East & Africa Gable Box Revenue Share (%), by Application 2025 & 2033
- Figure 42: Middle East & Africa Gable Box Volume Share (%), by Application 2025 & 2033
- Figure 43: Middle East & Africa Gable Box Revenue (undefined), by Types 2025 & 2033
- Figure 44: Middle East & Africa Gable Box Volume (K), by Types 2025 & 2033
- Figure 45: Middle East & Africa Gable Box Revenue Share (%), by Types 2025 & 2033
- Figure 46: Middle East & Africa Gable Box Volume Share (%), by Types 2025 & 2033
- Figure 47: Middle East & Africa Gable Box Revenue (undefined), by Country 2025 & 2033
- Figure 48: Middle East & Africa Gable Box Volume (K), by Country 2025 & 2033
- Figure 49: Middle East & Africa Gable Box Revenue Share (%), by Country 2025 & 2033
- Figure 50: Middle East & Africa Gable Box Volume Share (%), by Country 2025 & 2033
- Figure 51: Asia Pacific Gable Box Revenue (undefined), by Application 2025 & 2033
- Figure 52: Asia Pacific Gable Box Volume (K), by Application 2025 & 2033
- Figure 53: Asia Pacific Gable Box Revenue Share (%), by Application 2025 & 2033
- Figure 54: Asia Pacific Gable Box Volume Share (%), by Application 2025 & 2033
- Figure 55: Asia Pacific Gable Box Revenue (undefined), by Types 2025 & 2033
- Figure 56: Asia Pacific Gable Box Volume (K), by Types 2025 & 2033
- Figure 57: Asia Pacific Gable Box Revenue Share (%), by Types 2025 & 2033
- Figure 58: Asia Pacific Gable Box Volume Share (%), by Types 2025 & 2033
- Figure 59: Asia Pacific Gable Box Revenue (undefined), by Country 2025 & 2033
- Figure 60: Asia Pacific Gable Box Volume (K), by Country 2025 & 2033
- Figure 61: Asia Pacific Gable Box Revenue Share (%), by Country 2025 & 2033
- Figure 62: Asia Pacific Gable Box Volume Share (%), by Country 2025 & 2033
List of Tables
- Table 1: Global Gable Box Revenue undefined Forecast, by Application 2020 & 2033
- Table 2: Global Gable Box Volume K Forecast, by Application 2020 & 2033
- Table 3: Global Gable Box Revenue undefined Forecast, by Types 2020 & 2033
- Table 4: Global Gable Box Volume K Forecast, by Types 2020 & 2033
- Table 5: Global Gable Box Revenue undefined Forecast, by Region 2020 & 2033
- Table 6: Global Gable Box Volume K Forecast, by Region 2020 & 2033
- Table 7: Global Gable Box Revenue undefined Forecast, by Application 2020 & 2033
- Table 8: Global Gable Box Volume K Forecast, by Application 2020 & 2033
- Table 9: Global Gable Box Revenue undefined Forecast, by Types 2020 & 2033
- Table 10: Global Gable Box Volume K Forecast, by Types 2020 & 2033
- Table 11: Global Gable Box Revenue undefined Forecast, by Country 2020 & 2033
- Table 12: Global Gable Box Volume K Forecast, by Country 2020 & 2033
- Table 13: United States Gable Box Revenue (undefined) Forecast, by Application 2020 & 2033
- Table 14: United States Gable Box Volume (K) Forecast, by Application 2020 & 2033
- Table 15: Canada Gable Box Revenue (undefined) Forecast, by Application 2020 & 2033
- Table 16: Canada Gable Box Volume (K) Forecast, by Application 2020 & 2033
- Table 17: Mexico Gable Box Revenue (undefined) Forecast, by Application 2020 & 2033
- Table 18: Mexico Gable Box Volume (K) Forecast, by Application 2020 & 2033
- Table 19: Global Gable Box Revenue undefined Forecast, by Application 2020 & 2033
- Table 20: Global Gable Box Volume K Forecast, by Application 2020 & 2033
- Table 21: Global Gable Box Revenue undefined Forecast, by Types 2020 & 2033
- Table 22: Global Gable Box Volume K Forecast, by Types 2020 & 2033
- Table 23: Global Gable Box Revenue undefined Forecast, by Country 2020 & 2033
- Table 24: Global Gable Box Volume K Forecast, by Country 2020 & 2033
- Table 25: Brazil Gable Box Revenue (undefined) Forecast, by Application 2020 & 2033
- Table 26: Brazil Gable Box Volume (K) Forecast, by Application 2020 & 2033
- Table 27: Argentina Gable Box Revenue (undefined) Forecast, by Application 2020 & 2033
- Table 28: Argentina Gable Box Volume (K) Forecast, by Application 2020 & 2033
- Table 29: Rest of South America Gable Box Revenue (undefined) Forecast, by Application 2020 & 2033
- Table 30: Rest of South America Gable Box Volume (K) Forecast, by Application 2020 & 2033
- Table 31: Global Gable Box Revenue undefined Forecast, by Application 2020 & 2033
- Table 32: Global Gable Box Volume K Forecast, by Application 2020 & 2033
- Table 33: Global Gable Box Revenue undefined Forecast, by Types 2020 & 2033
- Table 34: Global Gable Box Volume K Forecast, by Types 2020 & 2033
- Table 35: Global Gable Box Revenue undefined Forecast, by Country 2020 & 2033
- Table 36: Global Gable Box Volume K Forecast, by Country 2020 & 2033
- Table 37: United Kingdom Gable Box Revenue (undefined) Forecast, by Application 2020 & 2033
- Table 38: United Kingdom Gable Box Volume (K) Forecast, by Application 2020 & 2033
- Table 39: Germany Gable Box Revenue (undefined) Forecast, by Application 2020 & 2033
- Table 40: Germany Gable Box Volume (K) Forecast, by Application 2020 & 2033
- Table 41: France Gable Box Revenue (undefined) Forecast, by Application 2020 & 2033
- Table 42: France Gable Box Volume (K) Forecast, by Application 2020 & 2033
- Table 43: Italy Gable Box Revenue (undefined) Forecast, by Application 2020 & 2033
- Table 44: Italy Gable Box Volume (K) Forecast, by Application 2020 & 2033
- Table 45: Spain Gable Box Revenue (undefined) Forecast, by Application 2020 & 2033
- Table 46: Spain Gable Box Volume (K) Forecast, by Application 2020 & 2033
- Table 47: Russia Gable Box Revenue (undefined) Forecast, by Application 2020 & 2033
- Table 48: Russia Gable Box Volume (K) Forecast, by Application 2020 & 2033
- Table 49: Benelux Gable Box Revenue (undefined) Forecast, by Application 2020 & 2033
- Table 50: Benelux Gable Box Volume (K) Forecast, by Application 2020 & 2033
- Table 51: Nordics Gable Box Revenue (undefined) Forecast, by Application 2020 & 2033
- Table 52: Nordics Gable Box Volume (K) Forecast, by Application 2020 & 2033
- Table 53: Rest of Europe Gable Box Revenue (undefined) Forecast, by Application 2020 & 2033
- Table 54: Rest of Europe Gable Box Volume (K) Forecast, by Application 2020 & 2033
- Table 55: Global Gable Box Revenue undefined Forecast, by Application 2020 & 2033
- Table 56: Global Gable Box Volume K Forecast, by Application 2020 & 2033
- Table 57: Global Gable Box Revenue undefined Forecast, by Types 2020 & 2033
- Table 58: Global Gable Box Volume K Forecast, by Types 2020 & 2033
- Table 59: Global Gable Box Revenue undefined Forecast, by Country 2020 & 2033
- Table 60: Global Gable Box Volume K Forecast, by Country 2020 & 2033
- Table 61: Turkey Gable Box Revenue (undefined) Forecast, by Application 2020 & 2033
- Table 62: Turkey Gable Box Volume (K) Forecast, by Application 2020 & 2033
- Table 63: Israel Gable Box Revenue (undefined) Forecast, by Application 2020 & 2033
- Table 64: Israel Gable Box Volume (K) Forecast, by Application 2020 & 2033
- Table 65: GCC Gable Box Revenue (undefined) Forecast, by Application 2020 & 2033
- Table 66: GCC Gable Box Volume (K) Forecast, by Application 2020 & 2033
- Table 67: North Africa Gable Box Revenue (undefined) Forecast, by Application 2020 & 2033
- Table 68: North Africa Gable Box Volume (K) Forecast, by Application 2020 & 2033
- Table 69: South Africa Gable Box Revenue (undefined) Forecast, by Application 2020 & 2033
- Table 70: South Africa Gable Box Volume (K) Forecast, by Application 2020 & 2033
- Table 71: Rest of Middle East & Africa Gable Box Revenue (undefined) Forecast, by Application 2020 & 2033
- Table 72: Rest of Middle East & Africa Gable Box Volume (K) Forecast, by Application 2020 & 2033
- Table 73: Global Gable Box Revenue undefined Forecast, by Application 2020 & 2033
- Table 74: Global Gable Box Volume K Forecast, by Application 2020 & 2033
- Table 75: Global Gable Box Revenue undefined Forecast, by Types 2020 & 2033
- Table 76: Global Gable Box Volume K Forecast, by Types 2020 & 2033
- Table 77: Global Gable Box Revenue undefined Forecast, by Country 2020 & 2033
- Table 78: Global Gable Box Volume K Forecast, by Country 2020 & 2033
- Table 79: China Gable Box Revenue (undefined) Forecast, by Application 2020 & 2033
- Table 80: China Gable Box Volume (K) Forecast, by Application 2020 & 2033
- Table 81: India Gable Box Revenue (undefined) Forecast, by Application 2020 & 2033
- Table 82: India Gable Box Volume (K) Forecast, by Application 2020 & 2033
- Table 83: Japan Gable Box Revenue (undefined) Forecast, by Application 2020 & 2033
- Table 84: Japan Gable Box Volume (K) Forecast, by Application 2020 & 2033
- Table 85: South Korea Gable Box Revenue (undefined) Forecast, by Application 2020 & 2033
- Table 86: South Korea Gable Box Volume (K) Forecast, by Application 2020 & 2033
- Table 87: ASEAN Gable Box Revenue (undefined) Forecast, by Application 2020 & 2033
- Table 88: ASEAN Gable Box Volume (K) Forecast, by Application 2020 & 2033
- Table 89: Oceania Gable Box Revenue (undefined) Forecast, by Application 2020 & 2033
- Table 90: Oceania Gable Box Volume (K) Forecast, by Application 2020 & 2033
- Table 91: Rest of Asia Pacific Gable Box Revenue (undefined) Forecast, by Application 2020 & 2033
- Table 92: Rest of Asia Pacific Gable Box Volume (K) Forecast, by Application 2020 & 2033
Frequently Asked Questions
1. What is the projected Compound Annual Growth Rate (CAGR) of the Gable Box?
The projected CAGR is approximately 7.6%.
2. Which companies are prominent players in the Gable Box?
Key companies in the market include Smurfit Kappa Group, International Paper Company, Mondi Group, Graphic Packaging International, LLC, Huhtamaki Group, Packaging Corporation of America, Tetra Pak, Sealed Air Corporation, Sonoco Products Company, Amcor plc, Orora Limited, Pratt Industries, Inc., KapStone Paper and Packaging Corporation, Cascades Inc., Novolex Holdings, inc., Klabin S.A., Rengo Co. Ltd..
3. What are the main segments of the Gable Box?
The market segments include Application, Types.
4. Can you provide details about the market size?
The market size is estimated to be USD XXX N/A as of 2022.
5. What are some drivers contributing to market growth?
N/A
6. What are the notable trends driving market growth?
N/A
7. Are there any restraints impacting market growth?
N/A
8. Can you provide examples of recent developments in the market?
N/A
9. What pricing options are available for accessing the report?
Pricing options include single-user, multi-user, and enterprise licenses priced at USD 4350.00, USD 6525.00, and USD 8700.00 respectively.
10. Is the market size provided in terms of value or volume?
The market size is provided in terms of value, measured in N/A and volume, measured in K.
11. Are there any specific market keywords associated with the report?
Yes, the market keyword associated with the report is "Gable Box," which aids in identifying and referencing the specific market segment covered.
12. How do I determine which pricing option suits my needs best?
The pricing options vary based on user requirements and access needs. Individual users may opt for single-user licenses, while businesses requiring broader access may choose multi-user or enterprise licenses for cost-effective access to the report.
13. Are there any additional resources or data provided in the Gable Box report?
While the report offers comprehensive insights, it's advisable to review the specific contents or supplementary materials provided to ascertain if additional resources or data are available.
14. How can I stay updated on further developments or reports in the Gable Box?
To stay informed about further developments, trends, and reports in the Gable Box, consider subscribing to industry newsletters, following relevant companies and organizations, or regularly checking reputable industry news sources and publications.
Methodology
Step 1 - Identification of Relevant Samples Size from Population Database


Step 2 - Approaches for Defining Global Market Size (Value, Volume* & Price*)

Note*: In applicable scenarios
Step 3 - Data Sources
Primary Research
- Web Analytics
- Survey Reports
- Research Institute
- Latest Research Reports
- Opinion Leaders
Secondary Research
- Annual Reports
- White Paper
- Latest Press Release
- Industry Association
- Paid Database
- Investor Presentations

Step 4 - Data Triangulation
Involves using different sources of information in order to increase the validity of a study
These sources are likely to be stakeholders in a program - participants, other researchers, program staff, other community members, and so on.
Then we put all data in single framework & apply various statistical tools to find out the dynamic on the market.
During the analysis stage, feedback from the stakeholder groups would be compared to determine areas of agreement as well as areas of divergence