

Key Insights
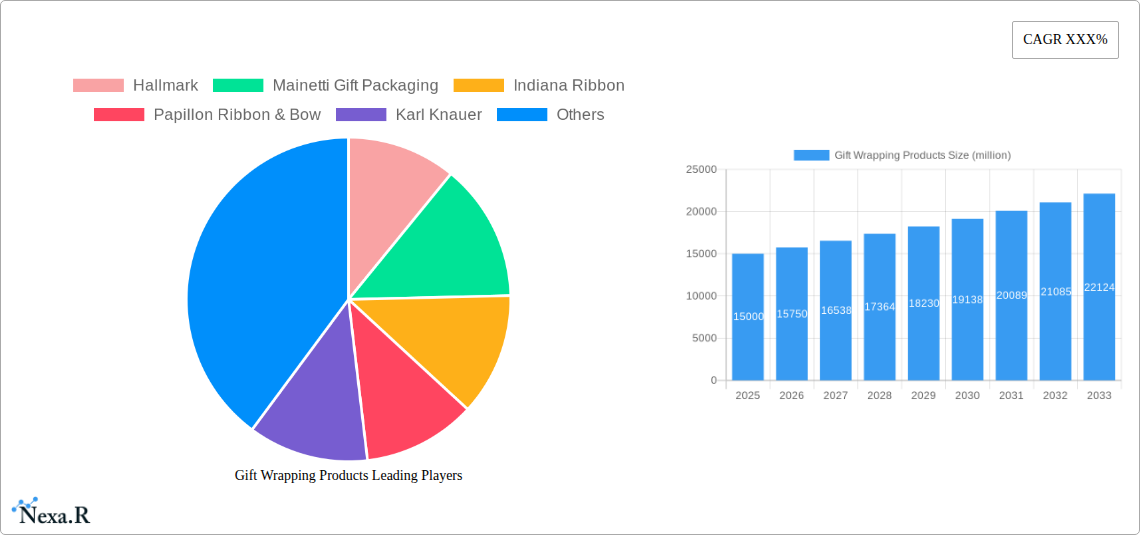
The global gift wrapping products market is poised for substantial expansion, driven by escalating consumer expenditure on celebratory occasions and a heightened demand for visually appealing and eco-conscious packaging. The market, valued at $21.77 billion in the base year of 2025, is projected to achieve a Compound Annual Growth Rate (CAGR) of 4.05% between 2025 and 2033. This growth trajectory is underpinned by several pivotal factors. The burgeoning e-commerce landscape necessitates sophisticated and resilient packaging solutions, while the increasing popularity of bespoke and personalized gift wrapping experiences fuels demand. Moreover, a growing imperative for environmentally friendly and recyclable materials, such as recycled paper and biodegradable embellishments, is a significant market stimulant. Leading industry participants are actively pursuing product innovation and expanding their global reach to leverage these evolving consumer preferences. The market is comprehensively segmented by product type, encompassing paper, ribbons, bows, bags, and boxes; by material, including paper, plastic, and fabric; and by distribution channel, covering both online and offline retail. The widespread adoption of sustainable packaging is anticipated to propel segment growth, though market dynamics are influenced by raw material price volatility and competitive pressures from cost-effective manufacturers.
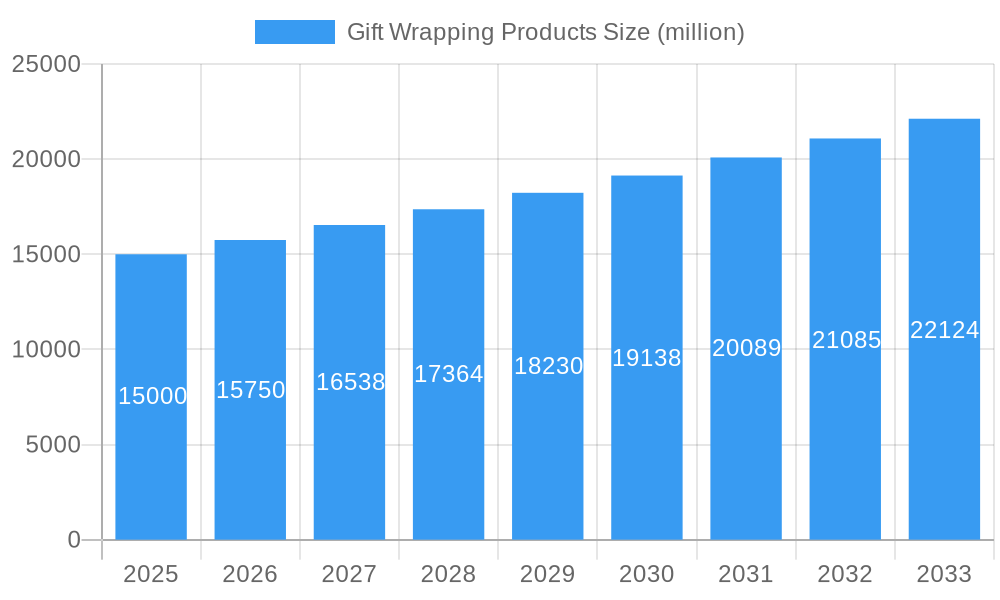
Gift Wrapping Products Market Size (In Billion)
Regional market dynamics are expected to exhibit divergence, with North America and Europe currently leading due to robust consumer spending and mature retail frameworks. Conversely, the Asia-Pacific region is forecast to experience accelerated growth, propelled by rising disposable incomes and an expanding middle-class demographic. Key market restraints include fluctuating raw material costs and intense competitive landscapes. Industry players are proactively addressing these challenges through strategic alliances, mergers, acquisitions, and a focused diversification into sustainable and avant-garde product offerings. Enterprises that adeptly address evolving consumer inclinations toward personalization, sustainability, and convenience in gift wrapping solutions will emerge as market leaders. The forecast period from 2025 to 2033 presents considerable opportunities for innovation and market advancement within the gift wrapping products sector.
Gift Wrapping Products Company Market Share
Gift Wrapping Products Market Report: 2019-2033
This comprehensive report provides a detailed analysis of the global gift wrapping products market, encompassing historical data (2019-2024), the base year (2025), and a forecast period (2025-2033). It delves into market dynamics, growth trends, regional dominance, product landscapes, and key players, offering invaluable insights for industry professionals, investors, and strategic decision-makers. The report specifically targets the parent market of packaging materials and the child market of gift wrapping supplies, providing a holistic view of the industry. The market size is presented in million units throughout the report.
Gift Wrapping Products Market Dynamics & Structure
The global gift wrapping products market is characterized by moderate concentration, with a few major players holding significant market share, alongside numerous smaller regional players. Technological innovation, particularly in sustainable materials and automated wrapping solutions, is a key driver. Regulatory frameworks concerning sustainability and material sourcing impact market dynamics, while increasing consumer demand for eco-friendly options presents both opportunities and challenges. Competitive product substitutes, such as digital gift cards, exert pressure on the traditional market. M&A activity remains relatively consistent, with xx deals recorded between 2019 and 2024, primarily focused on expanding product lines and geographical reach. End-user demographics, particularly among millennials and Gen Z, are shaping demand for unique and personalized gift wrapping solutions.
- Market Concentration: Moderately concentrated, with top 5 players holding approximately xx% market share in 2025.
- Technological Innovation: Focus on sustainable materials (recycled paper, biodegradable films), automation of wrapping processes.
- Regulatory Frameworks: Increasing regulations on plastic use driving demand for eco-friendly alternatives.
- Competitive Substitutes: Digital gift cards and experience-based gifts impacting growth.
- M&A Activity: xx deals between 2019-2024, with an average deal value of xx million units.
- End-User Demographics: Growing demand from millennials and Gen Z for personalized and sustainable options.
Gift Wrapping Products Growth Trends & Insights
The global gift wrapping products market experienced a CAGR of xx% during the historical period (2019-2024), reaching a market size of xx million units in 2024. This growth is attributed to factors such as rising disposable incomes, increasing consumer spending on gifts, and the growing popularity of online gifting and e-commerce. Technological advancements in printing and material science have further fueled market expansion. Shifting consumer preferences towards personalized and sustainable gift wrapping solutions are influencing market trends. The forecast period (2025-2033) projects a CAGR of xx%, driven by continued e-commerce growth and innovation in product design and materials. Market penetration is expected to reach xx% by 2033. The increasing adoption of eco-friendly gift wrapping materials is expected to contribute significantly to the market's growth trajectory during this period.
Dominant Regions, Countries, or Segments in Gift Wrapping Products
North America currently dominates the gift wrapping products market, holding approximately xx% of the global market share in 2025. This dominance is attributed to high consumer spending on gifts, robust e-commerce infrastructure, and a strong retail sector. Europe and Asia-Pacific are also significant markets, experiencing strong growth fueled by rising disposable incomes and changing consumer preferences.
- North America: High consumer spending, developed e-commerce infrastructure.
- Europe: Growing demand for sustainable packaging, strong retail sector.
- Asia-Pacific: Rapid economic growth, rising disposable incomes, increasing gift-giving culture.
- Market Share: North America (xx%), Europe (xx%), Asia-Pacific (xx%), Rest of World (xx%).
- Growth Potential: Asia-Pacific is projected to witness the fastest growth during the forecast period.
Gift Wrapping Products Product Landscape
The gift wrapping product landscape is diverse, encompassing a wide range of materials such as paper, ribbons, bows, bags, boxes, and tissue paper. Innovations focus on sustainable materials, unique designs, and improved functionality. For example, the introduction of recycled paper and biodegradable films cater to environmentally conscious consumers. Technological advancements in printing techniques enable highly customized and personalized gift wrapping solutions. Key performance indicators include material strength, aesthetic appeal, and ease of use. Unique selling propositions include eco-friendly certifications, customized designs, and innovative packaging formats.
Key Drivers, Barriers & Challenges in Gift Wrapping Products
Key Drivers:
- Rising disposable incomes and increased consumer spending on gifts.
- Growth of e-commerce and online gifting platforms.
- Increasing demand for personalized and customized gift wrapping.
- Technological innovations in materials and printing techniques.
Key Challenges:
- Fluctuations in raw material prices.
- Intense competition from substitute products.
- Environmental concerns and regulations impacting material sourcing.
- Supply chain disruptions impacting product availability and costs (estimated impact on market growth: xx%).
Emerging Opportunities in Gift Wrapping Products
- Growing demand for eco-friendly and sustainable gift wrapping solutions.
- Expansion into niche markets, such as luxury gift wrapping and personalized gift boxes.
- Development of innovative packaging designs and formats.
- Leveraging digital technologies for personalized gift wrapping experiences.
Growth Accelerators in the Gift Wrapping Products Industry
Technological breakthroughs in sustainable materials and automated packaging systems are key growth catalysts. Strategic partnerships between gift wrapping companies and e-commerce platforms are expanding market reach and enhancing customer experiences. Expansion into emerging markets with high growth potential, particularly in Asia-Pacific, will further drive market expansion.
Key Players Shaping the Gift Wrapping Products Market
- Hallmark
- Mainetti Gift Packaging
- Indiana Ribbon
- Papillon Ribbon & Bow
- Karl Knauer
- CSS Industries
- Shimojima
- amifa
- CBP Printing & Packaging
- Bolis SpA
- JiaYaoXing Packaging Product
- The Gift Wrap Company
- Noble Packaging
- Hedlunds Papper
- Shamrock Retail Packaging
- YAMA Ribbon
- R. Hochman Paper
- Kuny AG
Notable Milestones in Gift Wrapping Products Sector
- 2020: Increased demand for eco-friendly packaging due to growing environmental concerns.
- 2021: Several major players launched new product lines focused on sustainable materials.
- 2022: Significant investment in automation technologies by leading companies to increase efficiency.
- 2023: Several mergers and acquisitions within the sector aimed at expanding market share and product portfolios.
In-Depth Gift Wrapping Products Market Outlook
The future of the gift wrapping products market is bright, with continued growth fueled by technological innovation, sustainable materials, and expanding e-commerce. Strategic opportunities lie in developing innovative packaging solutions that cater to evolving consumer preferences, particularly the demand for personalization and sustainability. Focus on emerging markets and strategic partnerships will be crucial for sustained growth in the coming years.
Gift Wrapping Products Segmentation
-
1. Application
- 1.1. B To B
- 1.2. B To C
-
2. Type
- 2.1. Wrapping Paper
- 2.2. Bags
- 2.3. Decorative Boxes
- 2.4. Film & Foils
- 2.5. Ribbons
- 2.6. Other
Gift Wrapping Products Segmentation By Geography
-
1. North America
- 1.1. United States
- 1.2. Canada
- 1.3. Mexico
-
2. South America
- 2.1. Brazil
- 2.2. Argentina
- 2.3. Rest of South America
-
3. Europe
- 3.1. United Kingdom
- 3.2. Germany
- 3.3. France
- 3.4. Italy
- 3.5. Spain
- 3.6. Russia
- 3.7. Benelux
- 3.8. Nordics
- 3.9. Rest of Europe
-
4. Middle East & Africa
- 4.1. Turkey
- 4.2. Israel
- 4.3. GCC
- 4.4. North Africa
- 4.5. South Africa
- 4.6. Rest of Middle East & Africa
-
5. Asia Pacific
- 5.1. China
- 5.2. India
- 5.3. Japan
- 5.4. South Korea
- 5.5. ASEAN
- 5.6. Oceania
- 5.7. Rest of Asia Pacific

Gift Wrapping Products Regional Market Share
Geographic Coverage of Gift Wrapping Products
Gift Wrapping Products REPORT HIGHLIGHTS
| Aspects | Details |
|---|---|
| Study Period | 2020-2034 |
| Base Year | 2025 |
| Estimated Year | 2026 |
| Forecast Period | 2026-2034 |
| Historical Period | 2020-2025 |
| Growth Rate | CAGR of 4.05% from 2020-2034 |
| Segmentation |
|
Table of Contents
- 1. Introduction
- 1.1. Research Scope
- 1.2. Market Segmentation
- 1.3. Research Methodology
- 1.4. Definitions and Assumptions
- 2. Executive Summary
- 2.1. Introduction
- 3. Market Dynamics
- 3.1. Introduction
- 3.2. Market Drivers
- 3.3. Market Restrains
- 3.4. Market Trends
- 4. Market Factor Analysis
- 4.1. Porters Five Forces
- 4.2. Supply/Value Chain
- 4.3. PESTEL analysis
- 4.4. Market Entropy
- 4.5. Patent/Trademark Analysis
- 5. Global Gift Wrapping Products Analysis, Insights and Forecast, 2020-2032
- 5.1. Market Analysis, Insights and Forecast - by Application
- 5.1.1. B To B
- 5.1.2. B To C
- 5.2. Market Analysis, Insights and Forecast - by Type
- 5.2.1. Wrapping Paper
- 5.2.2. Bags
- 5.2.3. Decorative Boxes
- 5.2.4. Film & Foils
- 5.2.5. Ribbons
- 5.2.6. Other
- 5.3. Market Analysis, Insights and Forecast - by Region
- 5.3.1. North America
- 5.3.2. South America
- 5.3.3. Europe
- 5.3.4. Middle East & Africa
- 5.3.5. Asia Pacific
- 5.1. Market Analysis, Insights and Forecast - by Application
- 6. North America Gift Wrapping Products Analysis, Insights and Forecast, 2020-2032
- 6.1. Market Analysis, Insights and Forecast - by Application
- 6.1.1. B To B
- 6.1.2. B To C
- 6.2. Market Analysis, Insights and Forecast - by Type
- 6.2.1. Wrapping Paper
- 6.2.2. Bags
- 6.2.3. Decorative Boxes
- 6.2.4. Film & Foils
- 6.2.5. Ribbons
- 6.2.6. Other
- 6.1. Market Analysis, Insights and Forecast - by Application
- 7. South America Gift Wrapping Products Analysis, Insights and Forecast, 2020-2032
- 7.1. Market Analysis, Insights and Forecast - by Application
- 7.1.1. B To B
- 7.1.2. B To C
- 7.2. Market Analysis, Insights and Forecast - by Type
- 7.2.1. Wrapping Paper
- 7.2.2. Bags
- 7.2.3. Decorative Boxes
- 7.2.4. Film & Foils
- 7.2.5. Ribbons
- 7.2.6. Other
- 7.1. Market Analysis, Insights and Forecast - by Application
- 8. Europe Gift Wrapping Products Analysis, Insights and Forecast, 2020-2032
- 8.1. Market Analysis, Insights and Forecast - by Application
- 8.1.1. B To B
- 8.1.2. B To C
- 8.2. Market Analysis, Insights and Forecast - by Type
- 8.2.1. Wrapping Paper
- 8.2.2. Bags
- 8.2.3. Decorative Boxes
- 8.2.4. Film & Foils
- 8.2.5. Ribbons
- 8.2.6. Other
- 8.1. Market Analysis, Insights and Forecast - by Application
- 9. Middle East & Africa Gift Wrapping Products Analysis, Insights and Forecast, 2020-2032
- 9.1. Market Analysis, Insights and Forecast - by Application
- 9.1.1. B To B
- 9.1.2. B To C
- 9.2. Market Analysis, Insights and Forecast - by Type
- 9.2.1. Wrapping Paper
- 9.2.2. Bags
- 9.2.3. Decorative Boxes
- 9.2.4. Film & Foils
- 9.2.5. Ribbons
- 9.2.6. Other
- 9.1. Market Analysis, Insights and Forecast - by Application
- 10. Asia Pacific Gift Wrapping Products Analysis, Insights and Forecast, 2020-2032
- 10.1. Market Analysis, Insights and Forecast - by Application
- 10.1.1. B To B
- 10.1.2. B To C
- 10.2. Market Analysis, Insights and Forecast - by Type
- 10.2.1. Wrapping Paper
- 10.2.2. Bags
- 10.2.3. Decorative Boxes
- 10.2.4. Film & Foils
- 10.2.5. Ribbons
- 10.2.6. Other
- 10.1. Market Analysis, Insights and Forecast - by Application
- 11. Competitive Analysis
- 11.1. Global Market Share Analysis 2025
- 11.2. Company Profiles
- 11.2.1 Hallmark
- 11.2.1.1. Overview
- 11.2.1.2. Products
- 11.2.1.3. SWOT Analysis
- 11.2.1.4. Recent Developments
- 11.2.1.5. Financials (Based on Availability)
- 11.2.2 Mainetti Gift Packaging
- 11.2.2.1. Overview
- 11.2.2.2. Products
- 11.2.2.3. SWOT Analysis
- 11.2.2.4. Recent Developments
- 11.2.2.5. Financials (Based on Availability)
- 11.2.3 Indiana Ribbon
- 11.2.3.1. Overview
- 11.2.3.2. Products
- 11.2.3.3. SWOT Analysis
- 11.2.3.4. Recent Developments
- 11.2.3.5. Financials (Based on Availability)
- 11.2.4 Papillon Ribbon & Bow
- 11.2.4.1. Overview
- 11.2.4.2. Products
- 11.2.4.3. SWOT Analysis
- 11.2.4.4. Recent Developments
- 11.2.4.5. Financials (Based on Availability)
- 11.2.5 Karl Knauer
- 11.2.5.1. Overview
- 11.2.5.2. Products
- 11.2.5.3. SWOT Analysis
- 11.2.5.4. Recent Developments
- 11.2.5.5. Financials (Based on Availability)
- 11.2.6 CSS Industries
- 11.2.6.1. Overview
- 11.2.6.2. Products
- 11.2.6.3. SWOT Analysis
- 11.2.6.4. Recent Developments
- 11.2.6.5. Financials (Based on Availability)
- 11.2.7 Shimojima
- 11.2.7.1. Overview
- 11.2.7.2. Products
- 11.2.7.3. SWOT Analysis
- 11.2.7.4. Recent Developments
- 11.2.7.5. Financials (Based on Availability)
- 11.2.8 amifa
- 11.2.8.1. Overview
- 11.2.8.2. Products
- 11.2.8.3. SWOT Analysis
- 11.2.8.4. Recent Developments
- 11.2.8.5. Financials (Based on Availability)
- 11.2.9 CBP Printing & Packaging
- 11.2.9.1. Overview
- 11.2.9.2. Products
- 11.2.9.3. SWOT Analysis
- 11.2.9.4. Recent Developments
- 11.2.9.5. Financials (Based on Availability)
- 11.2.10 Bolis SpA
- 11.2.10.1. Overview
- 11.2.10.2. Products
- 11.2.10.3. SWOT Analysis
- 11.2.10.4. Recent Developments
- 11.2.10.5. Financials (Based on Availability)
- 11.2.11 JiaYaoXing Packaging Product
- 11.2.11.1. Overview
- 11.2.11.2. Products
- 11.2.11.3. SWOT Analysis
- 11.2.11.4. Recent Developments
- 11.2.11.5. Financials (Based on Availability)
- 11.2.12 The Gift Wrap Company
- 11.2.12.1. Overview
- 11.2.12.2. Products
- 11.2.12.3. SWOT Analysis
- 11.2.12.4. Recent Developments
- 11.2.12.5. Financials (Based on Availability)
- 11.2.13 Noble Packaging
- 11.2.13.1. Overview
- 11.2.13.2. Products
- 11.2.13.3. SWOT Analysis
- 11.2.13.4. Recent Developments
- 11.2.13.5. Financials (Based on Availability)
- 11.2.14 Hedlunds Papper
- 11.2.14.1. Overview
- 11.2.14.2. Products
- 11.2.14.3. SWOT Analysis
- 11.2.14.4. Recent Developments
- 11.2.14.5. Financials (Based on Availability)
- 11.2.15 Shamrock Retail Packaging
- 11.2.15.1. Overview
- 11.2.15.2. Products
- 11.2.15.3. SWOT Analysis
- 11.2.15.4. Recent Developments
- 11.2.15.5. Financials (Based on Availability)
- 11.2.16 YAMA Ribbon
- 11.2.16.1. Overview
- 11.2.16.2. Products
- 11.2.16.3. SWOT Analysis
- 11.2.16.4. Recent Developments
- 11.2.16.5. Financials (Based on Availability)
- 11.2.17 R. Hochman Paper
- 11.2.17.1. Overview
- 11.2.17.2. Products
- 11.2.17.3. SWOT Analysis
- 11.2.17.4. Recent Developments
- 11.2.17.5. Financials (Based on Availability)
- 11.2.18 Kuny AG
- 11.2.18.1. Overview
- 11.2.18.2. Products
- 11.2.18.3. SWOT Analysis
- 11.2.18.4. Recent Developments
- 11.2.18.5. Financials (Based on Availability)
- 11.2.1 Hallmark
List of Figures
- Figure 1: Global Gift Wrapping Products Revenue Breakdown (billion, %) by Region 2025 & 2033
- Figure 2: Global Gift Wrapping Products Volume Breakdown (K, %) by Region 2025 & 2033
- Figure 3: North America Gift Wrapping Products Revenue (billion), by Application 2025 & 2033
- Figure 4: North America Gift Wrapping Products Volume (K), by Application 2025 & 2033
- Figure 5: North America Gift Wrapping Products Revenue Share (%), by Application 2025 & 2033
- Figure 6: North America Gift Wrapping Products Volume Share (%), by Application 2025 & 2033
- Figure 7: North America Gift Wrapping Products Revenue (billion), by Type 2025 & 2033
- Figure 8: North America Gift Wrapping Products Volume (K), by Type 2025 & 2033
- Figure 9: North America Gift Wrapping Products Revenue Share (%), by Type 2025 & 2033
- Figure 10: North America Gift Wrapping Products Volume Share (%), by Type 2025 & 2033
- Figure 11: North America Gift Wrapping Products Revenue (billion), by Country 2025 & 2033
- Figure 12: North America Gift Wrapping Products Volume (K), by Country 2025 & 2033
- Figure 13: North America Gift Wrapping Products Revenue Share (%), by Country 2025 & 2033
- Figure 14: North America Gift Wrapping Products Volume Share (%), by Country 2025 & 2033
- Figure 15: South America Gift Wrapping Products Revenue (billion), by Application 2025 & 2033
- Figure 16: South America Gift Wrapping Products Volume (K), by Application 2025 & 2033
- Figure 17: South America Gift Wrapping Products Revenue Share (%), by Application 2025 & 2033
- Figure 18: South America Gift Wrapping Products Volume Share (%), by Application 2025 & 2033
- Figure 19: South America Gift Wrapping Products Revenue (billion), by Type 2025 & 2033
- Figure 20: South America Gift Wrapping Products Volume (K), by Type 2025 & 2033
- Figure 21: South America Gift Wrapping Products Revenue Share (%), by Type 2025 & 2033
- Figure 22: South America Gift Wrapping Products Volume Share (%), by Type 2025 & 2033
- Figure 23: South America Gift Wrapping Products Revenue (billion), by Country 2025 & 2033
- Figure 24: South America Gift Wrapping Products Volume (K), by Country 2025 & 2033
- Figure 25: South America Gift Wrapping Products Revenue Share (%), by Country 2025 & 2033
- Figure 26: South America Gift Wrapping Products Volume Share (%), by Country 2025 & 2033
- Figure 27: Europe Gift Wrapping Products Revenue (billion), by Application 2025 & 2033
- Figure 28: Europe Gift Wrapping Products Volume (K), by Application 2025 & 2033
- Figure 29: Europe Gift Wrapping Products Revenue Share (%), by Application 2025 & 2033
- Figure 30: Europe Gift Wrapping Products Volume Share (%), by Application 2025 & 2033
- Figure 31: Europe Gift Wrapping Products Revenue (billion), by Type 2025 & 2033
- Figure 32: Europe Gift Wrapping Products Volume (K), by Type 2025 & 2033
- Figure 33: Europe Gift Wrapping Products Revenue Share (%), by Type 2025 & 2033
- Figure 34: Europe Gift Wrapping Products Volume Share (%), by Type 2025 & 2033
- Figure 35: Europe Gift Wrapping Products Revenue (billion), by Country 2025 & 2033
- Figure 36: Europe Gift Wrapping Products Volume (K), by Country 2025 & 2033
- Figure 37: Europe Gift Wrapping Products Revenue Share (%), by Country 2025 & 2033
- Figure 38: Europe Gift Wrapping Products Volume Share (%), by Country 2025 & 2033
- Figure 39: Middle East & Africa Gift Wrapping Products Revenue (billion), by Application 2025 & 2033
- Figure 40: Middle East & Africa Gift Wrapping Products Volume (K), by Application 2025 & 2033
- Figure 41: Middle East & Africa Gift Wrapping Products Revenue Share (%), by Application 2025 & 2033
- Figure 42: Middle East & Africa Gift Wrapping Products Volume Share (%), by Application 2025 & 2033
- Figure 43: Middle East & Africa Gift Wrapping Products Revenue (billion), by Type 2025 & 2033
- Figure 44: Middle East & Africa Gift Wrapping Products Volume (K), by Type 2025 & 2033
- Figure 45: Middle East & Africa Gift Wrapping Products Revenue Share (%), by Type 2025 & 2033
- Figure 46: Middle East & Africa Gift Wrapping Products Volume Share (%), by Type 2025 & 2033
- Figure 47: Middle East & Africa Gift Wrapping Products Revenue (billion), by Country 2025 & 2033
- Figure 48: Middle East & Africa Gift Wrapping Products Volume (K), by Country 2025 & 2033
- Figure 49: Middle East & Africa Gift Wrapping Products Revenue Share (%), by Country 2025 & 2033
- Figure 50: Middle East & Africa Gift Wrapping Products Volume Share (%), by Country 2025 & 2033
- Figure 51: Asia Pacific Gift Wrapping Products Revenue (billion), by Application 2025 & 2033
- Figure 52: Asia Pacific Gift Wrapping Products Volume (K), by Application 2025 & 2033
- Figure 53: Asia Pacific Gift Wrapping Products Revenue Share (%), by Application 2025 & 2033
- Figure 54: Asia Pacific Gift Wrapping Products Volume Share (%), by Application 2025 & 2033
- Figure 55: Asia Pacific Gift Wrapping Products Revenue (billion), by Type 2025 & 2033
- Figure 56: Asia Pacific Gift Wrapping Products Volume (K), by Type 2025 & 2033
- Figure 57: Asia Pacific Gift Wrapping Products Revenue Share (%), by Type 2025 & 2033
- Figure 58: Asia Pacific Gift Wrapping Products Volume Share (%), by Type 2025 & 2033
- Figure 59: Asia Pacific Gift Wrapping Products Revenue (billion), by Country 2025 & 2033
- Figure 60: Asia Pacific Gift Wrapping Products Volume (K), by Country 2025 & 2033
- Figure 61: Asia Pacific Gift Wrapping Products Revenue Share (%), by Country 2025 & 2033
- Figure 62: Asia Pacific Gift Wrapping Products Volume Share (%), by Country 2025 & 2033
List of Tables
- Table 1: Global Gift Wrapping Products Revenue billion Forecast, by Application 2020 & 2033
- Table 2: Global Gift Wrapping Products Volume K Forecast, by Application 2020 & 2033
- Table 3: Global Gift Wrapping Products Revenue billion Forecast, by Type 2020 & 2033
- Table 4: Global Gift Wrapping Products Volume K Forecast, by Type 2020 & 2033
- Table 5: Global Gift Wrapping Products Revenue billion Forecast, by Region 2020 & 2033
- Table 6: Global Gift Wrapping Products Volume K Forecast, by Region 2020 & 2033
- Table 7: Global Gift Wrapping Products Revenue billion Forecast, by Application 2020 & 2033
- Table 8: Global Gift Wrapping Products Volume K Forecast, by Application 2020 & 2033
- Table 9: Global Gift Wrapping Products Revenue billion Forecast, by Type 2020 & 2033
- Table 10: Global Gift Wrapping Products Volume K Forecast, by Type 2020 & 2033
- Table 11: Global Gift Wrapping Products Revenue billion Forecast, by Country 2020 & 2033
- Table 12: Global Gift Wrapping Products Volume K Forecast, by Country 2020 & 2033
- Table 13: United States Gift Wrapping Products Revenue (billion) Forecast, by Application 2020 & 2033
- Table 14: United States Gift Wrapping Products Volume (K) Forecast, by Application 2020 & 2033
- Table 15: Canada Gift Wrapping Products Revenue (billion) Forecast, by Application 2020 & 2033
- Table 16: Canada Gift Wrapping Products Volume (K) Forecast, by Application 2020 & 2033
- Table 17: Mexico Gift Wrapping Products Revenue (billion) Forecast, by Application 2020 & 2033
- Table 18: Mexico Gift Wrapping Products Volume (K) Forecast, by Application 2020 & 2033
- Table 19: Global Gift Wrapping Products Revenue billion Forecast, by Application 2020 & 2033
- Table 20: Global Gift Wrapping Products Volume K Forecast, by Application 2020 & 2033
- Table 21: Global Gift Wrapping Products Revenue billion Forecast, by Type 2020 & 2033
- Table 22: Global Gift Wrapping Products Volume K Forecast, by Type 2020 & 2033
- Table 23: Global Gift Wrapping Products Revenue billion Forecast, by Country 2020 & 2033
- Table 24: Global Gift Wrapping Products Volume K Forecast, by Country 2020 & 2033
- Table 25: Brazil Gift Wrapping Products Revenue (billion) Forecast, by Application 2020 & 2033
- Table 26: Brazil Gift Wrapping Products Volume (K) Forecast, by Application 2020 & 2033
- Table 27: Argentina Gift Wrapping Products Revenue (billion) Forecast, by Application 2020 & 2033
- Table 28: Argentina Gift Wrapping Products Volume (K) Forecast, by Application 2020 & 2033
- Table 29: Rest of South America Gift Wrapping Products Revenue (billion) Forecast, by Application 2020 & 2033
- Table 30: Rest of South America Gift Wrapping Products Volume (K) Forecast, by Application 2020 & 2033
- Table 31: Global Gift Wrapping Products Revenue billion Forecast, by Application 2020 & 2033
- Table 32: Global Gift Wrapping Products Volume K Forecast, by Application 2020 & 2033
- Table 33: Global Gift Wrapping Products Revenue billion Forecast, by Type 2020 & 2033
- Table 34: Global Gift Wrapping Products Volume K Forecast, by Type 2020 & 2033
- Table 35: Global Gift Wrapping Products Revenue billion Forecast, by Country 2020 & 2033
- Table 36: Global Gift Wrapping Products Volume K Forecast, by Country 2020 & 2033
- Table 37: United Kingdom Gift Wrapping Products Revenue (billion) Forecast, by Application 2020 & 2033
- Table 38: United Kingdom Gift Wrapping Products Volume (K) Forecast, by Application 2020 & 2033
- Table 39: Germany Gift Wrapping Products Revenue (billion) Forecast, by Application 2020 & 2033
- Table 40: Germany Gift Wrapping Products Volume (K) Forecast, by Application 2020 & 2033
- Table 41: France Gift Wrapping Products Revenue (billion) Forecast, by Application 2020 & 2033
- Table 42: France Gift Wrapping Products Volume (K) Forecast, by Application 2020 & 2033
- Table 43: Italy Gift Wrapping Products Revenue (billion) Forecast, by Application 2020 & 2033
- Table 44: Italy Gift Wrapping Products Volume (K) Forecast, by Application 2020 & 2033
- Table 45: Spain Gift Wrapping Products Revenue (billion) Forecast, by Application 2020 & 2033
- Table 46: Spain Gift Wrapping Products Volume (K) Forecast, by Application 2020 & 2033
- Table 47: Russia Gift Wrapping Products Revenue (billion) Forecast, by Application 2020 & 2033
- Table 48: Russia Gift Wrapping Products Volume (K) Forecast, by Application 2020 & 2033
- Table 49: Benelux Gift Wrapping Products Revenue (billion) Forecast, by Application 2020 & 2033
- Table 50: Benelux Gift Wrapping Products Volume (K) Forecast, by Application 2020 & 2033
- Table 51: Nordics Gift Wrapping Products Revenue (billion) Forecast, by Application 2020 & 2033
- Table 52: Nordics Gift Wrapping Products Volume (K) Forecast, by Application 2020 & 2033
- Table 53: Rest of Europe Gift Wrapping Products Revenue (billion) Forecast, by Application 2020 & 2033
- Table 54: Rest of Europe Gift Wrapping Products Volume (K) Forecast, by Application 2020 & 2033
- Table 55: Global Gift Wrapping Products Revenue billion Forecast, by Application 2020 & 2033
- Table 56: Global Gift Wrapping Products Volume K Forecast, by Application 2020 & 2033
- Table 57: Global Gift Wrapping Products Revenue billion Forecast, by Type 2020 & 2033
- Table 58: Global Gift Wrapping Products Volume K Forecast, by Type 2020 & 2033
- Table 59: Global Gift Wrapping Products Revenue billion Forecast, by Country 2020 & 2033
- Table 60: Global Gift Wrapping Products Volume K Forecast, by Country 2020 & 2033
- Table 61: Turkey Gift Wrapping Products Revenue (billion) Forecast, by Application 2020 & 2033
- Table 62: Turkey Gift Wrapping Products Volume (K) Forecast, by Application 2020 & 2033
- Table 63: Israel Gift Wrapping Products Revenue (billion) Forecast, by Application 2020 & 2033
- Table 64: Israel Gift Wrapping Products Volume (K) Forecast, by Application 2020 & 2033
- Table 65: GCC Gift Wrapping Products Revenue (billion) Forecast, by Application 2020 & 2033
- Table 66: GCC Gift Wrapping Products Volume (K) Forecast, by Application 2020 & 2033
- Table 67: North Africa Gift Wrapping Products Revenue (billion) Forecast, by Application 2020 & 2033
- Table 68: North Africa Gift Wrapping Products Volume (K) Forecast, by Application 2020 & 2033
- Table 69: South Africa Gift Wrapping Products Revenue (billion) Forecast, by Application 2020 & 2033
- Table 70: South Africa Gift Wrapping Products Volume (K) Forecast, by Application 2020 & 2033
- Table 71: Rest of Middle East & Africa Gift Wrapping Products Revenue (billion) Forecast, by Application 2020 & 2033
- Table 72: Rest of Middle East & Africa Gift Wrapping Products Volume (K) Forecast, by Application 2020 & 2033
- Table 73: Global Gift Wrapping Products Revenue billion Forecast, by Application 2020 & 2033
- Table 74: Global Gift Wrapping Products Volume K Forecast, by Application 2020 & 2033
- Table 75: Global Gift Wrapping Products Revenue billion Forecast, by Type 2020 & 2033
- Table 76: Global Gift Wrapping Products Volume K Forecast, by Type 2020 & 2033
- Table 77: Global Gift Wrapping Products Revenue billion Forecast, by Country 2020 & 2033
- Table 78: Global Gift Wrapping Products Volume K Forecast, by Country 2020 & 2033
- Table 79: China Gift Wrapping Products Revenue (billion) Forecast, by Application 2020 & 2033
- Table 80: China Gift Wrapping Products Volume (K) Forecast, by Application 2020 & 2033
- Table 81: India Gift Wrapping Products Revenue (billion) Forecast, by Application 2020 & 2033
- Table 82: India Gift Wrapping Products Volume (K) Forecast, by Application 2020 & 2033
- Table 83: Japan Gift Wrapping Products Revenue (billion) Forecast, by Application 2020 & 2033
- Table 84: Japan Gift Wrapping Products Volume (K) Forecast, by Application 2020 & 2033
- Table 85: South Korea Gift Wrapping Products Revenue (billion) Forecast, by Application 2020 & 2033
- Table 86: South Korea Gift Wrapping Products Volume (K) Forecast, by Application 2020 & 2033
- Table 87: ASEAN Gift Wrapping Products Revenue (billion) Forecast, by Application 2020 & 2033
- Table 88: ASEAN Gift Wrapping Products Volume (K) Forecast, by Application 2020 & 2033
- Table 89: Oceania Gift Wrapping Products Revenue (billion) Forecast, by Application 2020 & 2033
- Table 90: Oceania Gift Wrapping Products Volume (K) Forecast, by Application 2020 & 2033
- Table 91: Rest of Asia Pacific Gift Wrapping Products Revenue (billion) Forecast, by Application 2020 & 2033
- Table 92: Rest of Asia Pacific Gift Wrapping Products Volume (K) Forecast, by Application 2020 & 2033
Frequently Asked Questions
1. What is the projected Compound Annual Growth Rate (CAGR) of the Gift Wrapping Products?
The projected CAGR is approximately 4.05%.
2. Which companies are prominent players in the Gift Wrapping Products?
Key companies in the market include Hallmark, Mainetti Gift Packaging, Indiana Ribbon, Papillon Ribbon & Bow, Karl Knauer, CSS Industries, Shimojima, amifa, CBP Printing & Packaging, Bolis SpA, JiaYaoXing Packaging Product, The Gift Wrap Company, Noble Packaging, Hedlunds Papper, Shamrock Retail Packaging, YAMA Ribbon, R. Hochman Paper, Kuny AG.
3. What are the main segments of the Gift Wrapping Products?
The market segments include Application, Type.
4. Can you provide details about the market size?
The market size is estimated to be USD 21.77 billion as of 2022.
5. What are some drivers contributing to market growth?
N/A
6. What are the notable trends driving market growth?
N/A
7. Are there any restraints impacting market growth?
N/A
8. Can you provide examples of recent developments in the market?
N/A
9. What pricing options are available for accessing the report?
Pricing options include single-user, multi-user, and enterprise licenses priced at USD 3950.00, USD 5925.00, and USD 7900.00 respectively.
10. Is the market size provided in terms of value or volume?
The market size is provided in terms of value, measured in billion and volume, measured in K.
11. Are there any specific market keywords associated with the report?
Yes, the market keyword associated with the report is "Gift Wrapping Products," which aids in identifying and referencing the specific market segment covered.
12. How do I determine which pricing option suits my needs best?
The pricing options vary based on user requirements and access needs. Individual users may opt for single-user licenses, while businesses requiring broader access may choose multi-user or enterprise licenses for cost-effective access to the report.
13. Are there any additional resources or data provided in the Gift Wrapping Products report?
While the report offers comprehensive insights, it's advisable to review the specific contents or supplementary materials provided to ascertain if additional resources or data are available.
14. How can I stay updated on further developments or reports in the Gift Wrapping Products?
To stay informed about further developments, trends, and reports in the Gift Wrapping Products, consider subscribing to industry newsletters, following relevant companies and organizations, or regularly checking reputable industry news sources and publications.
Methodology
Step 1 - Identification of Relevant Samples Size from Population Database


Step 2 - Approaches for Defining Global Market Size (Value, Volume* & Price*)

Note*: In applicable scenarios
Step 3 - Data Sources
Primary Research
- Web Analytics
- Survey Reports
- Research Institute
- Latest Research Reports
- Opinion Leaders
Secondary Research
- Annual Reports
- White Paper
- Latest Press Release
- Industry Association
- Paid Database
- Investor Presentations

Step 4 - Data Triangulation
Involves using different sources of information in order to increase the validity of a study
These sources are likely to be stakeholders in a program - participants, other researchers, program staff, other community members, and so on.
Then we put all data in single framework & apply various statistical tools to find out the dynamic on the market.
During the analysis stage, feedback from the stakeholder groups would be compared to determine areas of agreement as well as areas of divergence