

Key Insights
The greaseproof wrapping paper market is experiencing robust growth, driven by increasing demand from the food and beverage industry, particularly for packaging bakery goods, confectionery, and fast-food items. The inherent properties of greaseproof paper – its resistance to grease and moisture – make it an ideal packaging solution for maintaining product freshness and extending shelf life. Consumer preference for sustainable and eco-friendly packaging options is further boosting market demand, as greaseproof paper offers a biodegradable alternative to plastic films. The market is segmented by paper type (e.g., bleached, unbleached), application (food packaging, industrial applications), and region. Major players are actively investing in research and development to enhance the functionality and sustainability of their products, leading to the introduction of innovative greaseproof paper solutions with improved barrier properties and enhanced printability. The market faces challenges including price fluctuations in raw materials (wood pulp) and increasing competition from alternative packaging materials. However, the growing emphasis on food safety and hygiene, coupled with the rising popularity of online food delivery, is expected to offset these challenges, driving consistent market expansion.
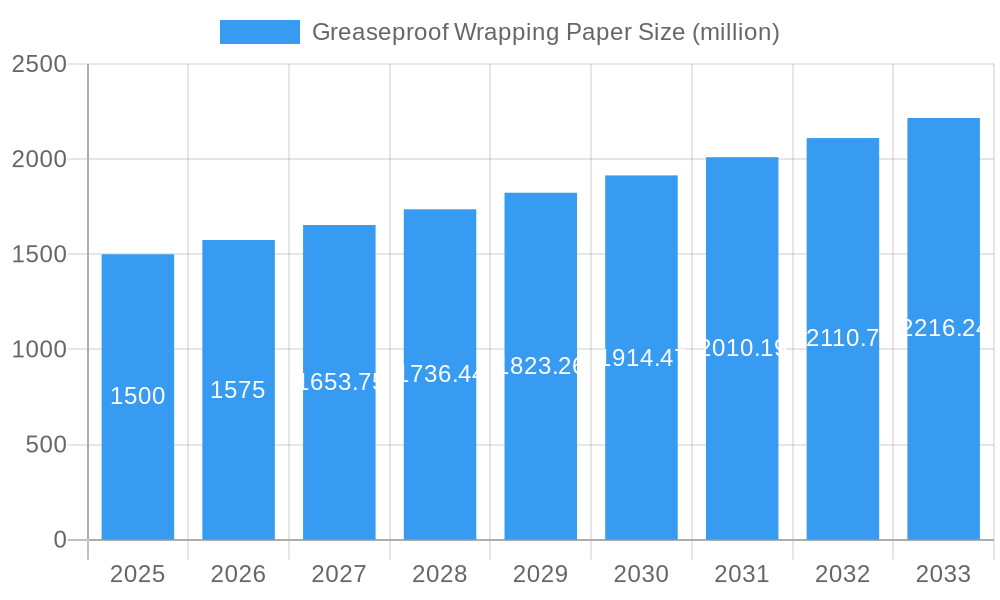
Greaseproof Wrapping Paper Market Size (In Billion)
Projected growth for the greaseproof wrapping paper market is estimated at a Compound Annual Growth Rate (CAGR) of 5% between 2025 and 2033. This growth trajectory is fueled by expanding global consumption of packaged food and the shift towards sustainable packaging. The market's regional distribution is likely skewed towards North America and Europe, reflecting established food processing and packaging industries in these regions. However, emerging economies in Asia-Pacific are expected to show significant growth potential, driven by rising disposable incomes and changing consumer preferences. Key players are focusing on strategic partnerships, mergers and acquisitions, and geographic expansion to capitalize on emerging opportunities and enhance market share. Continued innovation in paper technology, such as the development of functional coatings and improved barrier properties, will play a crucial role in shaping the market's future trajectory.
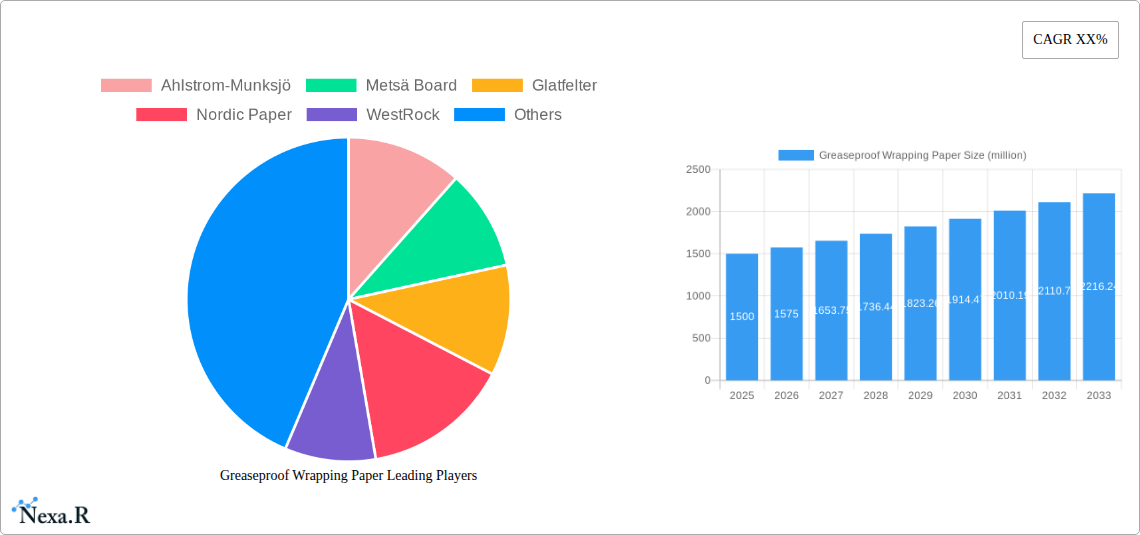
Greaseproof Wrapping Paper Company Market Share
Greaseproof Wrapping Paper Market Report: 2019-2033
This comprehensive report provides a detailed analysis of the greaseproof wrapping paper market, encompassing market dynamics, growth trends, regional analysis, product landscape, key players, and future outlook. The study covers the period 2019-2033, with 2025 as the base year and forecast extending to 2033. This report is invaluable for industry professionals, investors, and strategic decision-makers seeking to understand and capitalize on opportunities within this dynamic market segment. The market is valued at xx million units in 2025 and is projected to reach xx million units by 2033.
Greaseproof Wrapping Paper Market Dynamics & Structure
The greaseproof wrapping paper market is characterized by moderate concentration, with key players like Ahlstrom-Munksjö, Metsä Board, and Glatfelter holding significant market share. Technological innovation, particularly in sustainable and recyclable materials, is a major driver, alongside increasing demand from the food packaging and confectionery industries (parent market). The regulatory landscape, focusing on food safety and environmental regulations, influences production and material selection. Competitive substitutes include plastic films and other coated papers, posing a challenge to market growth. The market also experiences fluctuations due to raw material prices and global economic conditions. M&A activity within the industry remains relatively consistent, with an estimated xx deals per year in the historical period (2019-2024).
- Market Concentration: Moderately concentrated, with top 5 players holding xx% market share (2025).
- Technological Innovation: Focus on sustainable and recyclable materials, improved grease resistance, and barrier properties.
- Regulatory Framework: Stringent food safety and environmental regulations impacting material choices and production processes.
- Competitive Substitutes: Plastic films and other coated papers present challenges.
- End-User Demographics: Primarily driven by food and confectionery industries, with growth in specialized applications (e.g., pharmaceuticals, industrial).
- M&A Trends: Consistent M&A activity, with an average of xx deals annually (2019-2024).
Greaseproof Wrapping Paper Growth Trends & Insights
The greaseproof wrapping paper market experienced a CAGR of xx% during the historical period (2019-2024). This growth is fueled by rising demand from the food and beverage industry, particularly for packaged baked goods, confectionery, and fast food. The adoption rate of greaseproof paper in emerging economies is increasing due to rising disposable incomes and changing lifestyles. Technological advancements, such as improved barrier properties and biodegradable options, are driving market expansion. Consumer preference towards sustainable and eco-friendly packaging is also positively influencing market growth. Market penetration within the food packaging segment is expected to reach xx% by 2033.
Dominant Regions, Countries, or Segments in Greaseproof Wrapping Paper
The Asia-Pacific region dominates the greaseproof wrapping paper market, driven by robust economic growth, increasing consumption of processed food, and a large and expanding population. China, India, and other Southeast Asian nations are key contributors to this regional dominance. The growth is fueled by factors such as expanding food processing industries, favorable government policies supporting packaging innovation, and improving infrastructure. Europe and North America also hold significant market share, though growth rates are relatively slower compared to the Asia-Pacific region.
- Key Drivers in Asia-Pacific:
- Rapid economic growth and rising disposable incomes.
- Increasing consumption of processed foods and packaged goods.
- Favorable government policies promoting sustainable packaging.
- Growing food processing and packaging industries.
- Dominance Factors: High population density, increasing demand for convenience foods, and supportive regulatory environment.
- Growth Potential: Significant potential for growth in developing countries within the Asia-Pacific region due to rising urbanization and changing consumer preferences.
Greaseproof Wrapping Paper Product Landscape
Greaseproof wrapping paper is available in various grades, ranging from standard to high-barrier options. Innovations focus on enhancing grease resistance, barrier properties against moisture and oxygen, and incorporating sustainable materials like recycled fibers and biodegradable polymers. These advancements cater to the increasing demand for eco-friendly and high-performance packaging solutions within diverse applications. Unique selling propositions often emphasize improved printability, recyclability, and cost-effectiveness compared to plastic alternatives.
Key Drivers, Barriers & Challenges in Greaseproof Wrapping Paper
Key Drivers: Increasing demand from the food and confectionery industries, consumer preference for sustainable packaging, advancements in barrier properties and functionality, and favorable government policies are key drivers.
Challenges & Restraints: Fluctuations in raw material prices (e.g., pulp), intense competition from plastic films, environmental regulations impacting production, and supply chain disruptions are major challenges.
Emerging Opportunities in Greaseproof Wrapping Paper
Emerging opportunities include the growing demand for sustainable and compostable greaseproof wrapping paper, expanding applications in specialized sectors (e.g., pharmaceuticals, industrial), and increasing penetration in emerging markets with rising disposable incomes. The potential for innovative designs and value-added features also presents growth opportunities.
Growth Accelerators in the Greaseproof Wrapping Paper Industry
Technological breakthroughs in sustainable materials, strategic collaborations between packaging producers and food manufacturers, and expansion into niche market segments are key growth accelerators. This includes the development of compostable and recyclable greaseproof papers that reduce environmental impact and meet consumer demands.
Key Players Shaping the Greaseproof Wrapping Paper Market
- Ahlstrom-Munksjö
- Metsä Board
- Glatfelter
- Nordic Paper
- WestRock
- Pudumjee Paper Products
- Twin Rivers Paper Company
- UPM Specialty Papers
- Papeteries de Vizille
- Detpak
- Diamond Asia Enterprises
- Zhejiang Fulai New Materials
- Zhuhai Hongta Renheng Packaging
- Wenzhou Xinfeng Composite Materials
- Hangzhou Hongchang Paper
- Winbon Schoeller New Materials
- Guangdong Kaicheng Paper
Notable Milestones in Greaseproof Wrapping Paper Sector
- 2020: Ahlstrom-Munksjö launched a new range of sustainable greaseproof papers.
- 2022: Metsä Board invested in a new production line for enhanced barrier papers.
- 2023: A major merger between two key players resulted in increased market consolidation. (Specific details unavailable - xx)
In-Depth Greaseproof Wrapping Paper Market Outlook
The greaseproof wrapping paper market is poised for continued growth, driven by increasing demand from the food and beverage sector, technological advancements in sustainable materials, and expansion into new applications. Strategic partnerships and investments in innovative solutions will shape future market dynamics, creating opportunities for both established players and new entrants. The focus on sustainability and eco-friendly packaging solutions will further drive market expansion in the coming years.
Greaseproof Wrapping Paper Segmentation
-
1. Application
- 1.1. Commercial
- 1.2. Household
-
2. Types
- 2.1. Unbleached Greaseproof Paper
- 2.2. Printed Greaseproof Paper
- 2.3. Others
Greaseproof Wrapping Paper Segmentation By Geography
-
1. North America
- 1.1. United States
- 1.2. Canada
- 1.3. Mexico
-
2. South America
- 2.1. Brazil
- 2.2. Argentina
- 2.3. Rest of South America
-
3. Europe
- 3.1. United Kingdom
- 3.2. Germany
- 3.3. France
- 3.4. Italy
- 3.5. Spain
- 3.6. Russia
- 3.7. Benelux
- 3.8. Nordics
- 3.9. Rest of Europe
-
4. Middle East & Africa
- 4.1. Turkey
- 4.2. Israel
- 4.3. GCC
- 4.4. North Africa
- 4.5. South Africa
- 4.6. Rest of Middle East & Africa
-
5. Asia Pacific
- 5.1. China
- 5.2. India
- 5.3. Japan
- 5.4. South Korea
- 5.5. ASEAN
- 5.6. Oceania
- 5.7. Rest of Asia Pacific

Greaseproof Wrapping Paper Regional Market Share
Geographic Coverage of Greaseproof Wrapping Paper
Greaseproof Wrapping Paper REPORT HIGHLIGHTS
| Aspects | Details |
|---|---|
| Study Period | 2020-2034 |
| Base Year | 2025 |
| Estimated Year | 2026 |
| Forecast Period | 2026-2034 |
| Historical Period | 2020-2025 |
| Growth Rate | CAGR of 5.53% from 2020-2034 |
| Segmentation |
|
Table of Contents
- 1. Introduction
- 1.1. Research Scope
- 1.2. Market Segmentation
- 1.3. Research Methodology
- 1.4. Definitions and Assumptions
- 2. Executive Summary
- 2.1. Introduction
- 3. Market Dynamics
- 3.1. Introduction
- 3.2. Market Drivers
- 3.3. Market Restrains
- 3.4. Market Trends
- 4. Market Factor Analysis
- 4.1. Porters Five Forces
- 4.2. Supply/Value Chain
- 4.3. PESTEL analysis
- 4.4. Market Entropy
- 4.5. Patent/Trademark Analysis
- 5. Global Greaseproof Wrapping Paper Analysis, Insights and Forecast, 2020-2032
- 5.1. Market Analysis, Insights and Forecast - by Application
- 5.1.1. Commercial
- 5.1.2. Household
- 5.2. Market Analysis, Insights and Forecast - by Types
- 5.2.1. Unbleached Greaseproof Paper
- 5.2.2. Printed Greaseproof Paper
- 5.2.3. Others
- 5.3. Market Analysis, Insights and Forecast - by Region
- 5.3.1. North America
- 5.3.2. South America
- 5.3.3. Europe
- 5.3.4. Middle East & Africa
- 5.3.5. Asia Pacific
- 5.1. Market Analysis, Insights and Forecast - by Application
- 6. North America Greaseproof Wrapping Paper Analysis, Insights and Forecast, 2020-2032
- 6.1. Market Analysis, Insights and Forecast - by Application
- 6.1.1. Commercial
- 6.1.2. Household
- 6.2. Market Analysis, Insights and Forecast - by Types
- 6.2.1. Unbleached Greaseproof Paper
- 6.2.2. Printed Greaseproof Paper
- 6.2.3. Others
- 6.1. Market Analysis, Insights and Forecast - by Application
- 7. South America Greaseproof Wrapping Paper Analysis, Insights and Forecast, 2020-2032
- 7.1. Market Analysis, Insights and Forecast - by Application
- 7.1.1. Commercial
- 7.1.2. Household
- 7.2. Market Analysis, Insights and Forecast - by Types
- 7.2.1. Unbleached Greaseproof Paper
- 7.2.2. Printed Greaseproof Paper
- 7.2.3. Others
- 7.1. Market Analysis, Insights and Forecast - by Application
- 8. Europe Greaseproof Wrapping Paper Analysis, Insights and Forecast, 2020-2032
- 8.1. Market Analysis, Insights and Forecast - by Application
- 8.1.1. Commercial
- 8.1.2. Household
- 8.2. Market Analysis, Insights and Forecast - by Types
- 8.2.1. Unbleached Greaseproof Paper
- 8.2.2. Printed Greaseproof Paper
- 8.2.3. Others
- 8.1. Market Analysis, Insights and Forecast - by Application
- 9. Middle East & Africa Greaseproof Wrapping Paper Analysis, Insights and Forecast, 2020-2032
- 9.1. Market Analysis, Insights and Forecast - by Application
- 9.1.1. Commercial
- 9.1.2. Household
- 9.2. Market Analysis, Insights and Forecast - by Types
- 9.2.1. Unbleached Greaseproof Paper
- 9.2.2. Printed Greaseproof Paper
- 9.2.3. Others
- 9.1. Market Analysis, Insights and Forecast - by Application
- 10. Asia Pacific Greaseproof Wrapping Paper Analysis, Insights and Forecast, 2020-2032
- 10.1. Market Analysis, Insights and Forecast - by Application
- 10.1.1. Commercial
- 10.1.2. Household
- 10.2. Market Analysis, Insights and Forecast - by Types
- 10.2.1. Unbleached Greaseproof Paper
- 10.2.2. Printed Greaseproof Paper
- 10.2.3. Others
- 10.1. Market Analysis, Insights and Forecast - by Application
- 11. Competitive Analysis
- 11.1. Global Market Share Analysis 2025
- 11.2. Company Profiles
- 11.2.1 Ahlstrom-Munksjö
- 11.2.1.1. Overview
- 11.2.1.2. Products
- 11.2.1.3. SWOT Analysis
- 11.2.1.4. Recent Developments
- 11.2.1.5. Financials (Based on Availability)
- 11.2.2 Metsä Board
- 11.2.2.1. Overview
- 11.2.2.2. Products
- 11.2.2.3. SWOT Analysis
- 11.2.2.4. Recent Developments
- 11.2.2.5. Financials (Based on Availability)
- 11.2.3 Glatfelter
- 11.2.3.1. Overview
- 11.2.3.2. Products
- 11.2.3.3. SWOT Analysis
- 11.2.3.4. Recent Developments
- 11.2.3.5. Financials (Based on Availability)
- 11.2.4 Nordic Paper
- 11.2.4.1. Overview
- 11.2.4.2. Products
- 11.2.4.3. SWOT Analysis
- 11.2.4.4. Recent Developments
- 11.2.4.5. Financials (Based on Availability)
- 11.2.5 WestRock
- 11.2.5.1. Overview
- 11.2.5.2. Products
- 11.2.5.3. SWOT Analysis
- 11.2.5.4. Recent Developments
- 11.2.5.5. Financials (Based on Availability)
- 11.2.6 Pudumjee Paper Products
- 11.2.6.1. Overview
- 11.2.6.2. Products
- 11.2.6.3. SWOT Analysis
- 11.2.6.4. Recent Developments
- 11.2.6.5. Financials (Based on Availability)
- 11.2.7 Twin Rivers Paper Company
- 11.2.7.1. Overview
- 11.2.7.2. Products
- 11.2.7.3. SWOT Analysis
- 11.2.7.4. Recent Developments
- 11.2.7.5. Financials (Based on Availability)
- 11.2.8 UPM Specialty Papers
- 11.2.8.1. Overview
- 11.2.8.2. Products
- 11.2.8.3. SWOT Analysis
- 11.2.8.4. Recent Developments
- 11.2.8.5. Financials (Based on Availability)
- 11.2.9 Papeteries de Vizille
- 11.2.9.1. Overview
- 11.2.9.2. Products
- 11.2.9.3. SWOT Analysis
- 11.2.9.4. Recent Developments
- 11.2.9.5. Financials (Based on Availability)
- 11.2.10 Detpak
- 11.2.10.1. Overview
- 11.2.10.2. Products
- 11.2.10.3. SWOT Analysis
- 11.2.10.4. Recent Developments
- 11.2.10.5. Financials (Based on Availability)
- 11.2.11 Diamond Asia Enterprises
- 11.2.11.1. Overview
- 11.2.11.2. Products
- 11.2.11.3. SWOT Analysis
- 11.2.11.4. Recent Developments
- 11.2.11.5. Financials (Based on Availability)
- 11.2.12 Zhejiang Fulai New Materials
- 11.2.12.1. Overview
- 11.2.12.2. Products
- 11.2.12.3. SWOT Analysis
- 11.2.12.4. Recent Developments
- 11.2.12.5. Financials (Based on Availability)
- 11.2.13 Zhuhai Hongta Renheng Packaging
- 11.2.13.1. Overview
- 11.2.13.2. Products
- 11.2.13.3. SWOT Analysis
- 11.2.13.4. Recent Developments
- 11.2.13.5. Financials (Based on Availability)
- 11.2.14 Wenzhou Xinfeng Composite Materials
- 11.2.14.1. Overview
- 11.2.14.2. Products
- 11.2.14.3. SWOT Analysis
- 11.2.14.4. Recent Developments
- 11.2.14.5. Financials (Based on Availability)
- 11.2.15 Hangzhou Hongchang Paper
- 11.2.15.1. Overview
- 11.2.15.2. Products
- 11.2.15.3. SWOT Analysis
- 11.2.15.4. Recent Developments
- 11.2.15.5. Financials (Based on Availability)
- 11.2.16 Winbon Schoeller New Materials
- 11.2.16.1. Overview
- 11.2.16.2. Products
- 11.2.16.3. SWOT Analysis
- 11.2.16.4. Recent Developments
- 11.2.16.5. Financials (Based on Availability)
- 11.2.17 Guangdong Kaicheng Paper
- 11.2.17.1. Overview
- 11.2.17.2. Products
- 11.2.17.3. SWOT Analysis
- 11.2.17.4. Recent Developments
- 11.2.17.5. Financials (Based on Availability)
- 11.2.1 Ahlstrom-Munksjö
List of Figures
- Figure 1: Global Greaseproof Wrapping Paper Revenue Breakdown (undefined, %) by Region 2025 & 2033
- Figure 2: Global Greaseproof Wrapping Paper Volume Breakdown (K, %) by Region 2025 & 2033
- Figure 3: North America Greaseproof Wrapping Paper Revenue (undefined), by Application 2025 & 2033
- Figure 4: North America Greaseproof Wrapping Paper Volume (K), by Application 2025 & 2033
- Figure 5: North America Greaseproof Wrapping Paper Revenue Share (%), by Application 2025 & 2033
- Figure 6: North America Greaseproof Wrapping Paper Volume Share (%), by Application 2025 & 2033
- Figure 7: North America Greaseproof Wrapping Paper Revenue (undefined), by Types 2025 & 2033
- Figure 8: North America Greaseproof Wrapping Paper Volume (K), by Types 2025 & 2033
- Figure 9: North America Greaseproof Wrapping Paper Revenue Share (%), by Types 2025 & 2033
- Figure 10: North America Greaseproof Wrapping Paper Volume Share (%), by Types 2025 & 2033
- Figure 11: North America Greaseproof Wrapping Paper Revenue (undefined), by Country 2025 & 2033
- Figure 12: North America Greaseproof Wrapping Paper Volume (K), by Country 2025 & 2033
- Figure 13: North America Greaseproof Wrapping Paper Revenue Share (%), by Country 2025 & 2033
- Figure 14: North America Greaseproof Wrapping Paper Volume Share (%), by Country 2025 & 2033
- Figure 15: South America Greaseproof Wrapping Paper Revenue (undefined), by Application 2025 & 2033
- Figure 16: South America Greaseproof Wrapping Paper Volume (K), by Application 2025 & 2033
- Figure 17: South America Greaseproof Wrapping Paper Revenue Share (%), by Application 2025 & 2033
- Figure 18: South America Greaseproof Wrapping Paper Volume Share (%), by Application 2025 & 2033
- Figure 19: South America Greaseproof Wrapping Paper Revenue (undefined), by Types 2025 & 2033
- Figure 20: South America Greaseproof Wrapping Paper Volume (K), by Types 2025 & 2033
- Figure 21: South America Greaseproof Wrapping Paper Revenue Share (%), by Types 2025 & 2033
- Figure 22: South America Greaseproof Wrapping Paper Volume Share (%), by Types 2025 & 2033
- Figure 23: South America Greaseproof Wrapping Paper Revenue (undefined), by Country 2025 & 2033
- Figure 24: South America Greaseproof Wrapping Paper Volume (K), by Country 2025 & 2033
- Figure 25: South America Greaseproof Wrapping Paper Revenue Share (%), by Country 2025 & 2033
- Figure 26: South America Greaseproof Wrapping Paper Volume Share (%), by Country 2025 & 2033
- Figure 27: Europe Greaseproof Wrapping Paper Revenue (undefined), by Application 2025 & 2033
- Figure 28: Europe Greaseproof Wrapping Paper Volume (K), by Application 2025 & 2033
- Figure 29: Europe Greaseproof Wrapping Paper Revenue Share (%), by Application 2025 & 2033
- Figure 30: Europe Greaseproof Wrapping Paper Volume Share (%), by Application 2025 & 2033
- Figure 31: Europe Greaseproof Wrapping Paper Revenue (undefined), by Types 2025 & 2033
- Figure 32: Europe Greaseproof Wrapping Paper Volume (K), by Types 2025 & 2033
- Figure 33: Europe Greaseproof Wrapping Paper Revenue Share (%), by Types 2025 & 2033
- Figure 34: Europe Greaseproof Wrapping Paper Volume Share (%), by Types 2025 & 2033
- Figure 35: Europe Greaseproof Wrapping Paper Revenue (undefined), by Country 2025 & 2033
- Figure 36: Europe Greaseproof Wrapping Paper Volume (K), by Country 2025 & 2033
- Figure 37: Europe Greaseproof Wrapping Paper Revenue Share (%), by Country 2025 & 2033
- Figure 38: Europe Greaseproof Wrapping Paper Volume Share (%), by Country 2025 & 2033
- Figure 39: Middle East & Africa Greaseproof Wrapping Paper Revenue (undefined), by Application 2025 & 2033
- Figure 40: Middle East & Africa Greaseproof Wrapping Paper Volume (K), by Application 2025 & 2033
- Figure 41: Middle East & Africa Greaseproof Wrapping Paper Revenue Share (%), by Application 2025 & 2033
- Figure 42: Middle East & Africa Greaseproof Wrapping Paper Volume Share (%), by Application 2025 & 2033
- Figure 43: Middle East & Africa Greaseproof Wrapping Paper Revenue (undefined), by Types 2025 & 2033
- Figure 44: Middle East & Africa Greaseproof Wrapping Paper Volume (K), by Types 2025 & 2033
- Figure 45: Middle East & Africa Greaseproof Wrapping Paper Revenue Share (%), by Types 2025 & 2033
- Figure 46: Middle East & Africa Greaseproof Wrapping Paper Volume Share (%), by Types 2025 & 2033
- Figure 47: Middle East & Africa Greaseproof Wrapping Paper Revenue (undefined), by Country 2025 & 2033
- Figure 48: Middle East & Africa Greaseproof Wrapping Paper Volume (K), by Country 2025 & 2033
- Figure 49: Middle East & Africa Greaseproof Wrapping Paper Revenue Share (%), by Country 2025 & 2033
- Figure 50: Middle East & Africa Greaseproof Wrapping Paper Volume Share (%), by Country 2025 & 2033
- Figure 51: Asia Pacific Greaseproof Wrapping Paper Revenue (undefined), by Application 2025 & 2033
- Figure 52: Asia Pacific Greaseproof Wrapping Paper Volume (K), by Application 2025 & 2033
- Figure 53: Asia Pacific Greaseproof Wrapping Paper Revenue Share (%), by Application 2025 & 2033
- Figure 54: Asia Pacific Greaseproof Wrapping Paper Volume Share (%), by Application 2025 & 2033
- Figure 55: Asia Pacific Greaseproof Wrapping Paper Revenue (undefined), by Types 2025 & 2033
- Figure 56: Asia Pacific Greaseproof Wrapping Paper Volume (K), by Types 2025 & 2033
- Figure 57: Asia Pacific Greaseproof Wrapping Paper Revenue Share (%), by Types 2025 & 2033
- Figure 58: Asia Pacific Greaseproof Wrapping Paper Volume Share (%), by Types 2025 & 2033
- Figure 59: Asia Pacific Greaseproof Wrapping Paper Revenue (undefined), by Country 2025 & 2033
- Figure 60: Asia Pacific Greaseproof Wrapping Paper Volume (K), by Country 2025 & 2033
- Figure 61: Asia Pacific Greaseproof Wrapping Paper Revenue Share (%), by Country 2025 & 2033
- Figure 62: Asia Pacific Greaseproof Wrapping Paper Volume Share (%), by Country 2025 & 2033
List of Tables
- Table 1: Global Greaseproof Wrapping Paper Revenue undefined Forecast, by Application 2020 & 2033
- Table 2: Global Greaseproof Wrapping Paper Volume K Forecast, by Application 2020 & 2033
- Table 3: Global Greaseproof Wrapping Paper Revenue undefined Forecast, by Types 2020 & 2033
- Table 4: Global Greaseproof Wrapping Paper Volume K Forecast, by Types 2020 & 2033
- Table 5: Global Greaseproof Wrapping Paper Revenue undefined Forecast, by Region 2020 & 2033
- Table 6: Global Greaseproof Wrapping Paper Volume K Forecast, by Region 2020 & 2033
- Table 7: Global Greaseproof Wrapping Paper Revenue undefined Forecast, by Application 2020 & 2033
- Table 8: Global Greaseproof Wrapping Paper Volume K Forecast, by Application 2020 & 2033
- Table 9: Global Greaseproof Wrapping Paper Revenue undefined Forecast, by Types 2020 & 2033
- Table 10: Global Greaseproof Wrapping Paper Volume K Forecast, by Types 2020 & 2033
- Table 11: Global Greaseproof Wrapping Paper Revenue undefined Forecast, by Country 2020 & 2033
- Table 12: Global Greaseproof Wrapping Paper Volume K Forecast, by Country 2020 & 2033
- Table 13: United States Greaseproof Wrapping Paper Revenue (undefined) Forecast, by Application 2020 & 2033
- Table 14: United States Greaseproof Wrapping Paper Volume (K) Forecast, by Application 2020 & 2033
- Table 15: Canada Greaseproof Wrapping Paper Revenue (undefined) Forecast, by Application 2020 & 2033
- Table 16: Canada Greaseproof Wrapping Paper Volume (K) Forecast, by Application 2020 & 2033
- Table 17: Mexico Greaseproof Wrapping Paper Revenue (undefined) Forecast, by Application 2020 & 2033
- Table 18: Mexico Greaseproof Wrapping Paper Volume (K) Forecast, by Application 2020 & 2033
- Table 19: Global Greaseproof Wrapping Paper Revenue undefined Forecast, by Application 2020 & 2033
- Table 20: Global Greaseproof Wrapping Paper Volume K Forecast, by Application 2020 & 2033
- Table 21: Global Greaseproof Wrapping Paper Revenue undefined Forecast, by Types 2020 & 2033
- Table 22: Global Greaseproof Wrapping Paper Volume K Forecast, by Types 2020 & 2033
- Table 23: Global Greaseproof Wrapping Paper Revenue undefined Forecast, by Country 2020 & 2033
- Table 24: Global Greaseproof Wrapping Paper Volume K Forecast, by Country 2020 & 2033
- Table 25: Brazil Greaseproof Wrapping Paper Revenue (undefined) Forecast, by Application 2020 & 2033
- Table 26: Brazil Greaseproof Wrapping Paper Volume (K) Forecast, by Application 2020 & 2033
- Table 27: Argentina Greaseproof Wrapping Paper Revenue (undefined) Forecast, by Application 2020 & 2033
- Table 28: Argentina Greaseproof Wrapping Paper Volume (K) Forecast, by Application 2020 & 2033
- Table 29: Rest of South America Greaseproof Wrapping Paper Revenue (undefined) Forecast, by Application 2020 & 2033
- Table 30: Rest of South America Greaseproof Wrapping Paper Volume (K) Forecast, by Application 2020 & 2033
- Table 31: Global Greaseproof Wrapping Paper Revenue undefined Forecast, by Application 2020 & 2033
- Table 32: Global Greaseproof Wrapping Paper Volume K Forecast, by Application 2020 & 2033
- Table 33: Global Greaseproof Wrapping Paper Revenue undefined Forecast, by Types 2020 & 2033
- Table 34: Global Greaseproof Wrapping Paper Volume K Forecast, by Types 2020 & 2033
- Table 35: Global Greaseproof Wrapping Paper Revenue undefined Forecast, by Country 2020 & 2033
- Table 36: Global Greaseproof Wrapping Paper Volume K Forecast, by Country 2020 & 2033
- Table 37: United Kingdom Greaseproof Wrapping Paper Revenue (undefined) Forecast, by Application 2020 & 2033
- Table 38: United Kingdom Greaseproof Wrapping Paper Volume (K) Forecast, by Application 2020 & 2033
- Table 39: Germany Greaseproof Wrapping Paper Revenue (undefined) Forecast, by Application 2020 & 2033
- Table 40: Germany Greaseproof Wrapping Paper Volume (K) Forecast, by Application 2020 & 2033
- Table 41: France Greaseproof Wrapping Paper Revenue (undefined) Forecast, by Application 2020 & 2033
- Table 42: France Greaseproof Wrapping Paper Volume (K) Forecast, by Application 2020 & 2033
- Table 43: Italy Greaseproof Wrapping Paper Revenue (undefined) Forecast, by Application 2020 & 2033
- Table 44: Italy Greaseproof Wrapping Paper Volume (K) Forecast, by Application 2020 & 2033
- Table 45: Spain Greaseproof Wrapping Paper Revenue (undefined) Forecast, by Application 2020 & 2033
- Table 46: Spain Greaseproof Wrapping Paper Volume (K) Forecast, by Application 2020 & 2033
- Table 47: Russia Greaseproof Wrapping Paper Revenue (undefined) Forecast, by Application 2020 & 2033
- Table 48: Russia Greaseproof Wrapping Paper Volume (K) Forecast, by Application 2020 & 2033
- Table 49: Benelux Greaseproof Wrapping Paper Revenue (undefined) Forecast, by Application 2020 & 2033
- Table 50: Benelux Greaseproof Wrapping Paper Volume (K) Forecast, by Application 2020 & 2033
- Table 51: Nordics Greaseproof Wrapping Paper Revenue (undefined) Forecast, by Application 2020 & 2033
- Table 52: Nordics Greaseproof Wrapping Paper Volume (K) Forecast, by Application 2020 & 2033
- Table 53: Rest of Europe Greaseproof Wrapping Paper Revenue (undefined) Forecast, by Application 2020 & 2033
- Table 54: Rest of Europe Greaseproof Wrapping Paper Volume (K) Forecast, by Application 2020 & 2033
- Table 55: Global Greaseproof Wrapping Paper Revenue undefined Forecast, by Application 2020 & 2033
- Table 56: Global Greaseproof Wrapping Paper Volume K Forecast, by Application 2020 & 2033
- Table 57: Global Greaseproof Wrapping Paper Revenue undefined Forecast, by Types 2020 & 2033
- Table 58: Global Greaseproof Wrapping Paper Volume K Forecast, by Types 2020 & 2033
- Table 59: Global Greaseproof Wrapping Paper Revenue undefined Forecast, by Country 2020 & 2033
- Table 60: Global Greaseproof Wrapping Paper Volume K Forecast, by Country 2020 & 2033
- Table 61: Turkey Greaseproof Wrapping Paper Revenue (undefined) Forecast, by Application 2020 & 2033
- Table 62: Turkey Greaseproof Wrapping Paper Volume (K) Forecast, by Application 2020 & 2033
- Table 63: Israel Greaseproof Wrapping Paper Revenue (undefined) Forecast, by Application 2020 & 2033
- Table 64: Israel Greaseproof Wrapping Paper Volume (K) Forecast, by Application 2020 & 2033
- Table 65: GCC Greaseproof Wrapping Paper Revenue (undefined) Forecast, by Application 2020 & 2033
- Table 66: GCC Greaseproof Wrapping Paper Volume (K) Forecast, by Application 2020 & 2033
- Table 67: North Africa Greaseproof Wrapping Paper Revenue (undefined) Forecast, by Application 2020 & 2033
- Table 68: North Africa Greaseproof Wrapping Paper Volume (K) Forecast, by Application 2020 & 2033
- Table 69: South Africa Greaseproof Wrapping Paper Revenue (undefined) Forecast, by Application 2020 & 2033
- Table 70: South Africa Greaseproof Wrapping Paper Volume (K) Forecast, by Application 2020 & 2033
- Table 71: Rest of Middle East & Africa Greaseproof Wrapping Paper Revenue (undefined) Forecast, by Application 2020 & 2033
- Table 72: Rest of Middle East & Africa Greaseproof Wrapping Paper Volume (K) Forecast, by Application 2020 & 2033
- Table 73: Global Greaseproof Wrapping Paper Revenue undefined Forecast, by Application 2020 & 2033
- Table 74: Global Greaseproof Wrapping Paper Volume K Forecast, by Application 2020 & 2033
- Table 75: Global Greaseproof Wrapping Paper Revenue undefined Forecast, by Types 2020 & 2033
- Table 76: Global Greaseproof Wrapping Paper Volume K Forecast, by Types 2020 & 2033
- Table 77: Global Greaseproof Wrapping Paper Revenue undefined Forecast, by Country 2020 & 2033
- Table 78: Global Greaseproof Wrapping Paper Volume K Forecast, by Country 2020 & 2033
- Table 79: China Greaseproof Wrapping Paper Revenue (undefined) Forecast, by Application 2020 & 2033
- Table 80: China Greaseproof Wrapping Paper Volume (K) Forecast, by Application 2020 & 2033
- Table 81: India Greaseproof Wrapping Paper Revenue (undefined) Forecast, by Application 2020 & 2033
- Table 82: India Greaseproof Wrapping Paper Volume (K) Forecast, by Application 2020 & 2033
- Table 83: Japan Greaseproof Wrapping Paper Revenue (undefined) Forecast, by Application 2020 & 2033
- Table 84: Japan Greaseproof Wrapping Paper Volume (K) Forecast, by Application 2020 & 2033
- Table 85: South Korea Greaseproof Wrapping Paper Revenue (undefined) Forecast, by Application 2020 & 2033
- Table 86: South Korea Greaseproof Wrapping Paper Volume (K) Forecast, by Application 2020 & 2033
- Table 87: ASEAN Greaseproof Wrapping Paper Revenue (undefined) Forecast, by Application 2020 & 2033
- Table 88: ASEAN Greaseproof Wrapping Paper Volume (K) Forecast, by Application 2020 & 2033
- Table 89: Oceania Greaseproof Wrapping Paper Revenue (undefined) Forecast, by Application 2020 & 2033
- Table 90: Oceania Greaseproof Wrapping Paper Volume (K) Forecast, by Application 2020 & 2033
- Table 91: Rest of Asia Pacific Greaseproof Wrapping Paper Revenue (undefined) Forecast, by Application 2020 & 2033
- Table 92: Rest of Asia Pacific Greaseproof Wrapping Paper Volume (K) Forecast, by Application 2020 & 2033
Frequently Asked Questions
1. What is the projected Compound Annual Growth Rate (CAGR) of the Greaseproof Wrapping Paper?
The projected CAGR is approximately 5.53%.
2. Which companies are prominent players in the Greaseproof Wrapping Paper?
Key companies in the market include Ahlstrom-Munksjö, Metsä Board, Glatfelter, Nordic Paper, WestRock, Pudumjee Paper Products, Twin Rivers Paper Company, UPM Specialty Papers, Papeteries de Vizille, Detpak, Diamond Asia Enterprises, Zhejiang Fulai New Materials, Zhuhai Hongta Renheng Packaging, Wenzhou Xinfeng Composite Materials, Hangzhou Hongchang Paper, Winbon Schoeller New Materials, Guangdong Kaicheng Paper.
3. What are the main segments of the Greaseproof Wrapping Paper?
The market segments include Application, Types.
4. Can you provide details about the market size?
The market size is estimated to be USD XXX N/A as of 2022.
5. What are some drivers contributing to market growth?
N/A
6. What are the notable trends driving market growth?
N/A
7. Are there any restraints impacting market growth?
N/A
8. Can you provide examples of recent developments in the market?
N/A
9. What pricing options are available for accessing the report?
Pricing options include single-user, multi-user, and enterprise licenses priced at USD 4350.00, USD 6525.00, and USD 8700.00 respectively.
10. Is the market size provided in terms of value or volume?
The market size is provided in terms of value, measured in N/A and volume, measured in K.
11. Are there any specific market keywords associated with the report?
Yes, the market keyword associated with the report is "Greaseproof Wrapping Paper," which aids in identifying and referencing the specific market segment covered.
12. How do I determine which pricing option suits my needs best?
The pricing options vary based on user requirements and access needs. Individual users may opt for single-user licenses, while businesses requiring broader access may choose multi-user or enterprise licenses for cost-effective access to the report.
13. Are there any additional resources or data provided in the Greaseproof Wrapping Paper report?
While the report offers comprehensive insights, it's advisable to review the specific contents or supplementary materials provided to ascertain if additional resources or data are available.
14. How can I stay updated on further developments or reports in the Greaseproof Wrapping Paper?
To stay informed about further developments, trends, and reports in the Greaseproof Wrapping Paper, consider subscribing to industry newsletters, following relevant companies and organizations, or regularly checking reputable industry news sources and publications.
Methodology
Step 1 - Identification of Relevant Samples Size from Population Database


Step 2 - Approaches for Defining Global Market Size (Value, Volume* & Price*)

Note*: In applicable scenarios
Step 3 - Data Sources
Primary Research
- Web Analytics
- Survey Reports
- Research Institute
- Latest Research Reports
- Opinion Leaders
Secondary Research
- Annual Reports
- White Paper
- Latest Press Release
- Industry Association
- Paid Database
- Investor Presentations

Step 4 - Data Triangulation
Involves using different sources of information in order to increase the validity of a study
These sources are likely to be stakeholders in a program - participants, other researchers, program staff, other community members, and so on.
Then we put all data in single framework & apply various statistical tools to find out the dynamic on the market.
During the analysis stage, feedback from the stakeholder groups would be compared to determine areas of agreement as well as areas of divergence