

Key Insights
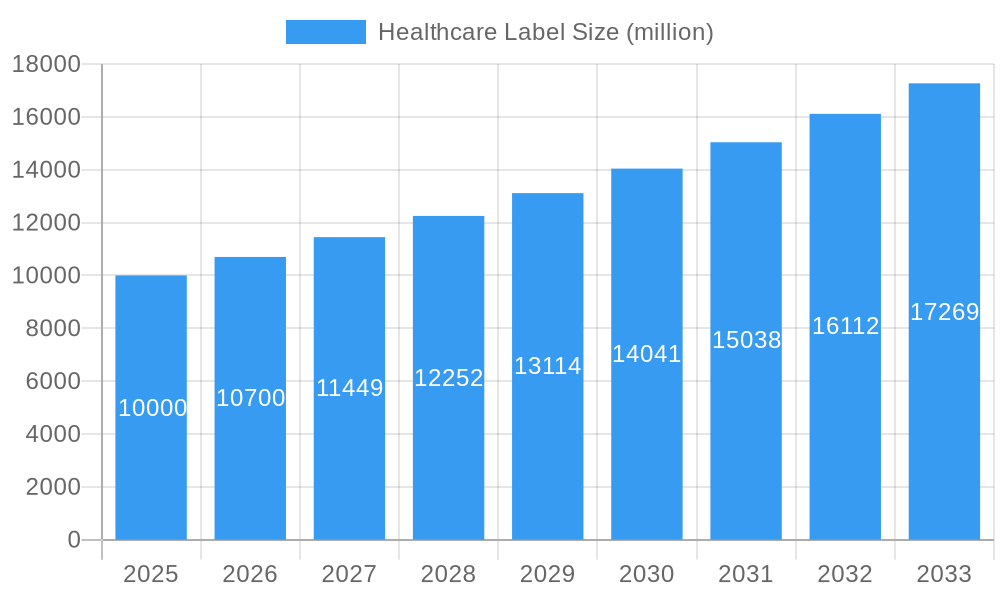
The healthcare label market is experiencing robust growth, driven by increasing demand for pharmaceutical and medical device labeling, stringent regulatory requirements, and the expanding global healthcare sector. The market's value is estimated at $10 billion in 2025, projected to grow at a Compound Annual Growth Rate (CAGR) of 7% from 2025 to 2033, reaching approximately $17 billion by 2033. This growth is fueled by several key trends, including the rise of personalized medicine, the increasing adoption of sophisticated labeling technologies (such as RFID and smart labels) for enhanced traceability and supply chain management, and a growing preference for tamper-evident and durable labels to ensure product integrity and patient safety. Major players such as Brady, 3M, and Avery Dennison are driving innovation and market expansion through strategic acquisitions, technological advancements, and geographic expansion.
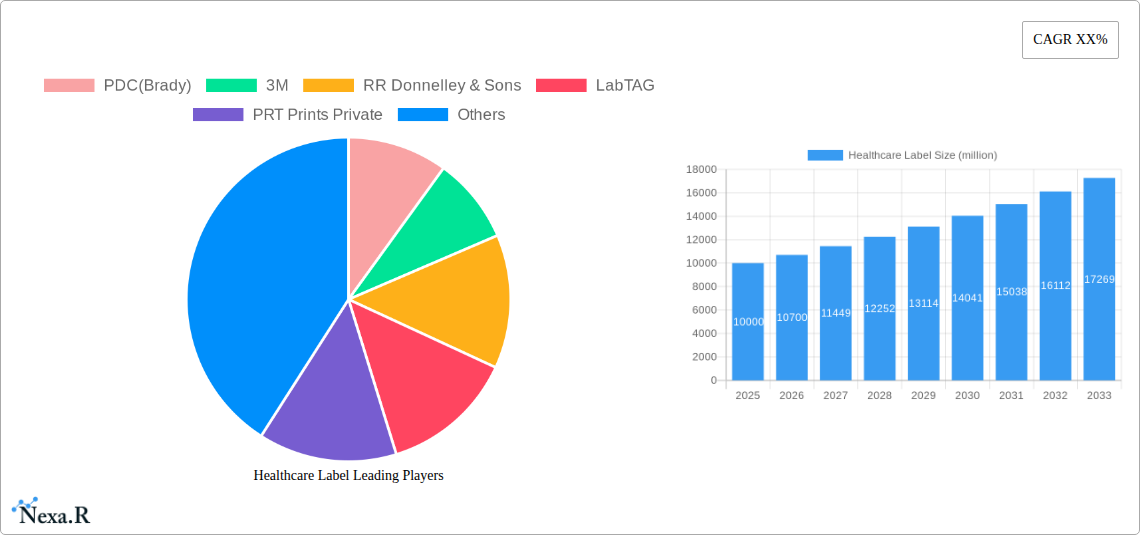
Healthcare Label Market Size (In Billion)
However, the market faces certain restraints, including fluctuating raw material prices, stringent regulatory compliance requirements demanding substantial investment, and intense competition among established players. The market is segmented by label type (e.g., pressure-sensitive, thermal transfer), application (e.g., pharmaceutical, medical devices, blood bags), and geography. North America and Europe currently hold a significant market share, but emerging economies in Asia-Pacific are witnessing rapid growth due to increasing healthcare infrastructure development and rising disposable incomes. The competitive landscape is characterized by both large multinational corporations and smaller specialized label manufacturers. Successful strategies for companies in this market involve focusing on product innovation, meeting stringent regulatory standards, and building strong distribution networks.
Healthcare Label Company Market Share
Healthcare Label Market Report: 2019-2033
This comprehensive report provides an in-depth analysis of the global Healthcare Label market, encompassing market dynamics, growth trends, regional dominance, product landscape, key players, and future outlook. The study period covers 2019-2033, with 2025 as the base and estimated year, and a forecast period of 2025-2033. The report leverages extensive primary and secondary research to deliver actionable insights for industry professionals, investors, and strategic decision-makers. The market size is projected to reach xx million units by 2033.
Healthcare Label Market Dynamics & Structure
The Healthcare Label market is characterized by a moderately consolidated structure, with key players like 3M, Avery Dennison, and CCL Industries holding significant market share. Market concentration is expected to remain relatively stable throughout the forecast period, though strategic acquisitions and partnerships could reshape the competitive landscape. Technological innovation, particularly in material science and printing technologies, is a key driver of growth. Stringent regulatory frameworks, including FDA guidelines and ISO standards, impact product development and market access. The market faces competition from alternative labeling methods, but the demand for specialized labeling solutions for pharmaceuticals, medical devices, and diagnostics continues to drive growth. The increasing adoption of smart labels and digital printing technologies are further contributing to market expansion. M&A activity in the sector has been robust in the recent past with xx million units worth of deals closed in 2024.
- Market Concentration: Moderately Consolidated (Top 5 players hold xx% market share in 2025)
- Technological Innovation: Advancements in material science, printing, and smart label technologies
- Regulatory Landscape: Stringent FDA, ISO, and other regional regulations
- Competitive Substitutes: Digital printing, alternative marking technologies
- M&A Activity: xx million units worth of deals in 2024 (Projected)
- Innovation Barriers: High regulatory hurdles, cost of R&D, and intellectual property protection
Healthcare Label Growth Trends & Insights
The global Healthcare Label market experienced steady growth during the historical period (2019-2024), driven by factors such as increasing healthcare expenditure, rising demand for pharmaceuticals and medical devices, and the growing adoption of advanced labeling technologies. The market is projected to witness a CAGR of xx% during the forecast period (2025-2033), reaching xx million units by 2033. This growth is fueled by the increasing prevalence of chronic diseases, expansion of healthcare infrastructure in emerging economies, and the growing adoption of personalized medicine. Technological disruptions, particularly the integration of digital technologies, are transforming the market, leading to the development of smart labels with enhanced functionalities. Consumer behavior shifts, including a growing preference for eco-friendly labels, are also influencing market trends. Market penetration in developing economies is anticipated to significantly contribute to overall market expansion.
Dominant Regions, Countries, or Segments in Healthcare Label
North America currently dominates the Healthcare Label market, holding the largest market share due to advanced healthcare infrastructure, high pharmaceutical consumption, and stringent regulatory compliance. Europe follows as a significant market, driven by a strong regulatory framework and a large pharmaceutical sector. Asia-Pacific is poised for rapid growth, fueled by increasing healthcare expenditure, rising disposable incomes, and expanding healthcare infrastructure.
- North America: Strong regulatory environment, high pharmaceutical consumption.
- Europe: Well-established healthcare infrastructure, stringent regulations.
- Asia-Pacific: High growth potential, rising healthcare expenditure, and expanding middle class.
- Market Share (2025): North America (xx%), Europe (xx%), Asia-Pacific (xx%), Rest of World (xx%)
Healthcare Label Product Landscape
The Healthcare Label market offers a diverse range of products, including tamper-evident labels, pharmaceutical labels, medical device labels, and barcode labels. Recent innovations include smart labels incorporating RFID technology for improved traceability and counterfeit prevention. These labels offer enhanced security features, improved durability, and the ability to track products throughout the supply chain. Key performance metrics include adhesion strength, durability, and readability. Unique selling propositions include ease of application, customization options, and compliance with industry regulations.
Key Drivers, Barriers & Challenges in Healthcare Label
Key Drivers:
- Increasing healthcare expenditure globally.
- Stringent regulatory compliance necessitating specialized labels.
- Rising demand for pharmaceuticals and medical devices.
- Adoption of advanced labeling technologies like RFID and smart labels.
Challenges & Restraints:
- Fluctuations in raw material prices.
- Stringent regulatory compliance and obtaining necessary approvals.
- Intense competition from existing players and the emergence of new entrants.
- Supply chain disruptions impacting production and distribution. (Estimated impact on market growth: xx% in 2024)
Emerging Opportunities in Healthcare Label
- Growing demand for sustainable and eco-friendly labels.
- Expansion into emerging markets with high growth potential.
- Development of specialized labels for emerging applications like personalized medicine and diagnostics.
- Integration of digital technologies and data analytics to improve traceability and efficiency.
Growth Accelerators in the Healthcare Label Industry
Technological breakthroughs in printing and material science are driving innovation and enhancing product performance. Strategic partnerships between label manufacturers and healthcare companies are fostering the development of customized solutions. Market expansion into emerging economies is providing new growth opportunities. These factors are expected to fuel long-term growth in the Healthcare Label market.
Key Players Shaping the Healthcare Label Market
- PDC (Brady)
- 3M
- RR Donnelley & Sons
- LabTAG
- PRT Prints Private
- DYMO Corporation
- Tapecon
- Arden Label
- Avery Dennison
- ATL
- CCL Industries
- First Products
- CCL Healthcare
- Multi-Color
- UPM Raflatac
- Mondi Group
- Ahlstrom
- Autajon Group
- WestRock
- Cardinal Health
- Justdial
- Xerafy Singapore
- Cymmetrik
Notable Milestones in Healthcare Label Sector
- 2021: 3M launched a new line of tamper-evident labels for pharmaceutical packaging.
- 2022: Avery Dennison acquired a smaller label manufacturer, expanding its market reach.
- 2023: CCL Industries invested in advanced printing technology to improve production efficiency.
- 2024: Several companies announced partnerships focusing on sustainable label materials.
In-Depth Healthcare Label Market Outlook
The Healthcare Label market is poised for continued growth, driven by technological advancements, increasing healthcare expenditure, and the expanding use of specialized labeling solutions. Strategic partnerships, investments in R&D, and expansion into untapped markets will be crucial for success in the coming years. The development of innovative labels with enhanced security features and improved traceability will continue to shape the market's future. The market's long-term growth is expected to remain robust, presenting significant opportunities for market participants.
Healthcare Label Segmentation
-
1. Application
- 1.1. Drug Management
- 1.2. Medical Device Management
- 1.3. Patient Identification
- 1.4. Product Identification and Tracing
- 1.5. Other
-
2. Types
- 2.1. Paper Label
- 2.2. Plastic Label
- 2.3. Medical Tape Label
- 2.4. Composite Material Label
- 2.5. Special Material Label
Healthcare Label Segmentation By Geography
-
1. North America
- 1.1. United States
- 1.2. Canada
- 1.3. Mexico
-
2. South America
- 2.1. Brazil
- 2.2. Argentina
- 2.3. Rest of South America
-
3. Europe
- 3.1. United Kingdom
- 3.2. Germany
- 3.3. France
- 3.4. Italy
- 3.5. Spain
- 3.6. Russia
- 3.7. Benelux
- 3.8. Nordics
- 3.9. Rest of Europe
-
4. Middle East & Africa
- 4.1. Turkey
- 4.2. Israel
- 4.3. GCC
- 4.4. North Africa
- 4.5. South Africa
- 4.6. Rest of Middle East & Africa
-
5. Asia Pacific
- 5.1. China
- 5.2. India
- 5.3. Japan
- 5.4. South Korea
- 5.5. ASEAN
- 5.6. Oceania
- 5.7. Rest of Asia Pacific

Healthcare Label Regional Market Share
Geographic Coverage of Healthcare Label
Healthcare Label REPORT HIGHLIGHTS
| Aspects | Details |
|---|---|
| Study Period | 2020-2034 |
| Base Year | 2025 |
| Estimated Year | 2026 |
| Forecast Period | 2026-2034 |
| Historical Period | 2020-2025 |
| Growth Rate | CAGR of 5.5% from 2020-2034 |
| Segmentation |
|
Table of Contents
- 1. Introduction
- 1.1. Research Scope
- 1.2. Market Segmentation
- 1.3. Research Methodology
- 1.4. Definitions and Assumptions
- 2. Executive Summary
- 2.1. Introduction
- 3. Market Dynamics
- 3.1. Introduction
- 3.2. Market Drivers
- 3.3. Market Restrains
- 3.4. Market Trends
- 4. Market Factor Analysis
- 4.1. Porters Five Forces
- 4.2. Supply/Value Chain
- 4.3. PESTEL analysis
- 4.4. Market Entropy
- 4.5. Patent/Trademark Analysis
- 5. Global Healthcare Label Analysis, Insights and Forecast, 2020-2032
- 5.1. Market Analysis, Insights and Forecast - by Application
- 5.1.1. Drug Management
- 5.1.2. Medical Device Management
- 5.1.3. Patient Identification
- 5.1.4. Product Identification and Tracing
- 5.1.5. Other
- 5.2. Market Analysis, Insights and Forecast - by Types
- 5.2.1. Paper Label
- 5.2.2. Plastic Label
- 5.2.3. Medical Tape Label
- 5.2.4. Composite Material Label
- 5.2.5. Special Material Label
- 5.3. Market Analysis, Insights and Forecast - by Region
- 5.3.1. North America
- 5.3.2. South America
- 5.3.3. Europe
- 5.3.4. Middle East & Africa
- 5.3.5. Asia Pacific
- 5.1. Market Analysis, Insights and Forecast - by Application
- 6. North America Healthcare Label Analysis, Insights and Forecast, 2020-2032
- 6.1. Market Analysis, Insights and Forecast - by Application
- 6.1.1. Drug Management
- 6.1.2. Medical Device Management
- 6.1.3. Patient Identification
- 6.1.4. Product Identification and Tracing
- 6.1.5. Other
- 6.2. Market Analysis, Insights and Forecast - by Types
- 6.2.1. Paper Label
- 6.2.2. Plastic Label
- 6.2.3. Medical Tape Label
- 6.2.4. Composite Material Label
- 6.2.5. Special Material Label
- 6.1. Market Analysis, Insights and Forecast - by Application
- 7. South America Healthcare Label Analysis, Insights and Forecast, 2020-2032
- 7.1. Market Analysis, Insights and Forecast - by Application
- 7.1.1. Drug Management
- 7.1.2. Medical Device Management
- 7.1.3. Patient Identification
- 7.1.4. Product Identification and Tracing
- 7.1.5. Other
- 7.2. Market Analysis, Insights and Forecast - by Types
- 7.2.1. Paper Label
- 7.2.2. Plastic Label
- 7.2.3. Medical Tape Label
- 7.2.4. Composite Material Label
- 7.2.5. Special Material Label
- 7.1. Market Analysis, Insights and Forecast - by Application
- 8. Europe Healthcare Label Analysis, Insights and Forecast, 2020-2032
- 8.1. Market Analysis, Insights and Forecast - by Application
- 8.1.1. Drug Management
- 8.1.2. Medical Device Management
- 8.1.3. Patient Identification
- 8.1.4. Product Identification and Tracing
- 8.1.5. Other
- 8.2. Market Analysis, Insights and Forecast - by Types
- 8.2.1. Paper Label
- 8.2.2. Plastic Label
- 8.2.3. Medical Tape Label
- 8.2.4. Composite Material Label
- 8.2.5. Special Material Label
- 8.1. Market Analysis, Insights and Forecast - by Application
- 9. Middle East & Africa Healthcare Label Analysis, Insights and Forecast, 2020-2032
- 9.1. Market Analysis, Insights and Forecast - by Application
- 9.1.1. Drug Management
- 9.1.2. Medical Device Management
- 9.1.3. Patient Identification
- 9.1.4. Product Identification and Tracing
- 9.1.5. Other
- 9.2. Market Analysis, Insights and Forecast - by Types
- 9.2.1. Paper Label
- 9.2.2. Plastic Label
- 9.2.3. Medical Tape Label
- 9.2.4. Composite Material Label
- 9.2.5. Special Material Label
- 9.1. Market Analysis, Insights and Forecast - by Application
- 10. Asia Pacific Healthcare Label Analysis, Insights and Forecast, 2020-2032
- 10.1. Market Analysis, Insights and Forecast - by Application
- 10.1.1. Drug Management
- 10.1.2. Medical Device Management
- 10.1.3. Patient Identification
- 10.1.4. Product Identification and Tracing
- 10.1.5. Other
- 10.2. Market Analysis, Insights and Forecast - by Types
- 10.2.1. Paper Label
- 10.2.2. Plastic Label
- 10.2.3. Medical Tape Label
- 10.2.4. Composite Material Label
- 10.2.5. Special Material Label
- 10.1. Market Analysis, Insights and Forecast - by Application
- 11. Competitive Analysis
- 11.1. Global Market Share Analysis 2025
- 11.2. Company Profiles
- 11.2.1 PDC(Brady)
- 11.2.1.1. Overview
- 11.2.1.2. Products
- 11.2.1.3. SWOT Analysis
- 11.2.1.4. Recent Developments
- 11.2.1.5. Financials (Based on Availability)
- 11.2.2 3M
- 11.2.2.1. Overview
- 11.2.2.2. Products
- 11.2.2.3. SWOT Analysis
- 11.2.2.4. Recent Developments
- 11.2.2.5. Financials (Based on Availability)
- 11.2.3 RR Donnelley & Sons
- 11.2.3.1. Overview
- 11.2.3.2. Products
- 11.2.3.3. SWOT Analysis
- 11.2.3.4. Recent Developments
- 11.2.3.5. Financials (Based on Availability)
- 11.2.4 LabTAG
- 11.2.4.1. Overview
- 11.2.4.2. Products
- 11.2.4.3. SWOT Analysis
- 11.2.4.4. Recent Developments
- 11.2.4.5. Financials (Based on Availability)
- 11.2.5 PRT Prints Private
- 11.2.5.1. Overview
- 11.2.5.2. Products
- 11.2.5.3. SWOT Analysis
- 11.2.5.4. Recent Developments
- 11.2.5.5. Financials (Based on Availability)
- 11.2.6 DYMO Corporation
- 11.2.6.1. Overview
- 11.2.6.2. Products
- 11.2.6.3. SWOT Analysis
- 11.2.6.4. Recent Developments
- 11.2.6.5. Financials (Based on Availability)
- 11.2.7 Tapecon
- 11.2.7.1. Overview
- 11.2.7.2. Products
- 11.2.7.3. SWOT Analysis
- 11.2.7.4. Recent Developments
- 11.2.7.5. Financials (Based on Availability)
- 11.2.8 Arden Label
- 11.2.8.1. Overview
- 11.2.8.2. Products
- 11.2.8.3. SWOT Analysis
- 11.2.8.4. Recent Developments
- 11.2.8.5. Financials (Based on Availability)
- 11.2.9 Avery Dennison
- 11.2.9.1. Overview
- 11.2.9.2. Products
- 11.2.9.3. SWOT Analysis
- 11.2.9.4. Recent Developments
- 11.2.9.5. Financials (Based on Availability)
- 11.2.10 ATL
- 11.2.10.1. Overview
- 11.2.10.2. Products
- 11.2.10.3. SWOT Analysis
- 11.2.10.4. Recent Developments
- 11.2.10.5. Financials (Based on Availability)
- 11.2.11 CCL Industries
- 11.2.11.1. Overview
- 11.2.11.2. Products
- 11.2.11.3. SWOT Analysis
- 11.2.11.4. Recent Developments
- 11.2.11.5. Financials (Based on Availability)
- 11.2.12 First Products
- 11.2.12.1. Overview
- 11.2.12.2. Products
- 11.2.12.3. SWOT Analysis
- 11.2.12.4. Recent Developments
- 11.2.12.5. Financials (Based on Availability)
- 11.2.13 CCL Healthcare
- 11.2.13.1. Overview
- 11.2.13.2. Products
- 11.2.13.3. SWOT Analysis
- 11.2.13.4. Recent Developments
- 11.2.13.5. Financials (Based on Availability)
- 11.2.14 Multi-Color
- 11.2.14.1. Overview
- 11.2.14.2. Products
- 11.2.14.3. SWOT Analysis
- 11.2.14.4. Recent Developments
- 11.2.14.5. Financials (Based on Availability)
- 11.2.15 UPM Raflatac
- 11.2.15.1. Overview
- 11.2.15.2. Products
- 11.2.15.3. SWOT Analysis
- 11.2.15.4. Recent Developments
- 11.2.15.5. Financials (Based on Availability)
- 11.2.16 Mondi Group
- 11.2.16.1. Overview
- 11.2.16.2. Products
- 11.2.16.3. SWOT Analysis
- 11.2.16.4. Recent Developments
- 11.2.16.5. Financials (Based on Availability)
- 11.2.17 Ahlstrom
- 11.2.17.1. Overview
- 11.2.17.2. Products
- 11.2.17.3. SWOT Analysis
- 11.2.17.4. Recent Developments
- 11.2.17.5. Financials (Based on Availability)
- 11.2.18 Autajon Group
- 11.2.18.1. Overview
- 11.2.18.2. Products
- 11.2.18.3. SWOT Analysis
- 11.2.18.4. Recent Developments
- 11.2.18.5. Financials (Based on Availability)
- 11.2.19 WestRock
- 11.2.19.1. Overview
- 11.2.19.2. Products
- 11.2.19.3. SWOT Analysis
- 11.2.19.4. Recent Developments
- 11.2.19.5. Financials (Based on Availability)
- 11.2.20 Cardinal Health
- 11.2.20.1. Overview
- 11.2.20.2. Products
- 11.2.20.3. SWOT Analysis
- 11.2.20.4. Recent Developments
- 11.2.20.5. Financials (Based on Availability)
- 11.2.21 Justdial
- 11.2.21.1. Overview
- 11.2.21.2. Products
- 11.2.21.3. SWOT Analysis
- 11.2.21.4. Recent Developments
- 11.2.21.5. Financials (Based on Availability)
- 11.2.22 Xerafy Singapore
- 11.2.22.1. Overview
- 11.2.22.2. Products
- 11.2.22.3. SWOT Analysis
- 11.2.22.4. Recent Developments
- 11.2.22.5. Financials (Based on Availability)
- 11.2.23 Cymmetrik
- 11.2.23.1. Overview
- 11.2.23.2. Products
- 11.2.23.3. SWOT Analysis
- 11.2.23.4. Recent Developments
- 11.2.23.5. Financials (Based on Availability)
- 11.2.1 PDC(Brady)
List of Figures
- Figure 1: Global Healthcare Label Revenue Breakdown (undefined, %) by Region 2025 & 2033
- Figure 2: Global Healthcare Label Volume Breakdown (K, %) by Region 2025 & 2033
- Figure 3: North America Healthcare Label Revenue (undefined), by Application 2025 & 2033
- Figure 4: North America Healthcare Label Volume (K), by Application 2025 & 2033
- Figure 5: North America Healthcare Label Revenue Share (%), by Application 2025 & 2033
- Figure 6: North America Healthcare Label Volume Share (%), by Application 2025 & 2033
- Figure 7: North America Healthcare Label Revenue (undefined), by Types 2025 & 2033
- Figure 8: North America Healthcare Label Volume (K), by Types 2025 & 2033
- Figure 9: North America Healthcare Label Revenue Share (%), by Types 2025 & 2033
- Figure 10: North America Healthcare Label Volume Share (%), by Types 2025 & 2033
- Figure 11: North America Healthcare Label Revenue (undefined), by Country 2025 & 2033
- Figure 12: North America Healthcare Label Volume (K), by Country 2025 & 2033
- Figure 13: North America Healthcare Label Revenue Share (%), by Country 2025 & 2033
- Figure 14: North America Healthcare Label Volume Share (%), by Country 2025 & 2033
- Figure 15: South America Healthcare Label Revenue (undefined), by Application 2025 & 2033
- Figure 16: South America Healthcare Label Volume (K), by Application 2025 & 2033
- Figure 17: South America Healthcare Label Revenue Share (%), by Application 2025 & 2033
- Figure 18: South America Healthcare Label Volume Share (%), by Application 2025 & 2033
- Figure 19: South America Healthcare Label Revenue (undefined), by Types 2025 & 2033
- Figure 20: South America Healthcare Label Volume (K), by Types 2025 & 2033
- Figure 21: South America Healthcare Label Revenue Share (%), by Types 2025 & 2033
- Figure 22: South America Healthcare Label Volume Share (%), by Types 2025 & 2033
- Figure 23: South America Healthcare Label Revenue (undefined), by Country 2025 & 2033
- Figure 24: South America Healthcare Label Volume (K), by Country 2025 & 2033
- Figure 25: South America Healthcare Label Revenue Share (%), by Country 2025 & 2033
- Figure 26: South America Healthcare Label Volume Share (%), by Country 2025 & 2033
- Figure 27: Europe Healthcare Label Revenue (undefined), by Application 2025 & 2033
- Figure 28: Europe Healthcare Label Volume (K), by Application 2025 & 2033
- Figure 29: Europe Healthcare Label Revenue Share (%), by Application 2025 & 2033
- Figure 30: Europe Healthcare Label Volume Share (%), by Application 2025 & 2033
- Figure 31: Europe Healthcare Label Revenue (undefined), by Types 2025 & 2033
- Figure 32: Europe Healthcare Label Volume (K), by Types 2025 & 2033
- Figure 33: Europe Healthcare Label Revenue Share (%), by Types 2025 & 2033
- Figure 34: Europe Healthcare Label Volume Share (%), by Types 2025 & 2033
- Figure 35: Europe Healthcare Label Revenue (undefined), by Country 2025 & 2033
- Figure 36: Europe Healthcare Label Volume (K), by Country 2025 & 2033
- Figure 37: Europe Healthcare Label Revenue Share (%), by Country 2025 & 2033
- Figure 38: Europe Healthcare Label Volume Share (%), by Country 2025 & 2033
- Figure 39: Middle East & Africa Healthcare Label Revenue (undefined), by Application 2025 & 2033
- Figure 40: Middle East & Africa Healthcare Label Volume (K), by Application 2025 & 2033
- Figure 41: Middle East & Africa Healthcare Label Revenue Share (%), by Application 2025 & 2033
- Figure 42: Middle East & Africa Healthcare Label Volume Share (%), by Application 2025 & 2033
- Figure 43: Middle East & Africa Healthcare Label Revenue (undefined), by Types 2025 & 2033
- Figure 44: Middle East & Africa Healthcare Label Volume (K), by Types 2025 & 2033
- Figure 45: Middle East & Africa Healthcare Label Revenue Share (%), by Types 2025 & 2033
- Figure 46: Middle East & Africa Healthcare Label Volume Share (%), by Types 2025 & 2033
- Figure 47: Middle East & Africa Healthcare Label Revenue (undefined), by Country 2025 & 2033
- Figure 48: Middle East & Africa Healthcare Label Volume (K), by Country 2025 & 2033
- Figure 49: Middle East & Africa Healthcare Label Revenue Share (%), by Country 2025 & 2033
- Figure 50: Middle East & Africa Healthcare Label Volume Share (%), by Country 2025 & 2033
- Figure 51: Asia Pacific Healthcare Label Revenue (undefined), by Application 2025 & 2033
- Figure 52: Asia Pacific Healthcare Label Volume (K), by Application 2025 & 2033
- Figure 53: Asia Pacific Healthcare Label Revenue Share (%), by Application 2025 & 2033
- Figure 54: Asia Pacific Healthcare Label Volume Share (%), by Application 2025 & 2033
- Figure 55: Asia Pacific Healthcare Label Revenue (undefined), by Types 2025 & 2033
- Figure 56: Asia Pacific Healthcare Label Volume (K), by Types 2025 & 2033
- Figure 57: Asia Pacific Healthcare Label Revenue Share (%), by Types 2025 & 2033
- Figure 58: Asia Pacific Healthcare Label Volume Share (%), by Types 2025 & 2033
- Figure 59: Asia Pacific Healthcare Label Revenue (undefined), by Country 2025 & 2033
- Figure 60: Asia Pacific Healthcare Label Volume (K), by Country 2025 & 2033
- Figure 61: Asia Pacific Healthcare Label Revenue Share (%), by Country 2025 & 2033
- Figure 62: Asia Pacific Healthcare Label Volume Share (%), by Country 2025 & 2033
List of Tables
- Table 1: Global Healthcare Label Revenue undefined Forecast, by Application 2020 & 2033
- Table 2: Global Healthcare Label Volume K Forecast, by Application 2020 & 2033
- Table 3: Global Healthcare Label Revenue undefined Forecast, by Types 2020 & 2033
- Table 4: Global Healthcare Label Volume K Forecast, by Types 2020 & 2033
- Table 5: Global Healthcare Label Revenue undefined Forecast, by Region 2020 & 2033
- Table 6: Global Healthcare Label Volume K Forecast, by Region 2020 & 2033
- Table 7: Global Healthcare Label Revenue undefined Forecast, by Application 2020 & 2033
- Table 8: Global Healthcare Label Volume K Forecast, by Application 2020 & 2033
- Table 9: Global Healthcare Label Revenue undefined Forecast, by Types 2020 & 2033
- Table 10: Global Healthcare Label Volume K Forecast, by Types 2020 & 2033
- Table 11: Global Healthcare Label Revenue undefined Forecast, by Country 2020 & 2033
- Table 12: Global Healthcare Label Volume K Forecast, by Country 2020 & 2033
- Table 13: United States Healthcare Label Revenue (undefined) Forecast, by Application 2020 & 2033
- Table 14: United States Healthcare Label Volume (K) Forecast, by Application 2020 & 2033
- Table 15: Canada Healthcare Label Revenue (undefined) Forecast, by Application 2020 & 2033
- Table 16: Canada Healthcare Label Volume (K) Forecast, by Application 2020 & 2033
- Table 17: Mexico Healthcare Label Revenue (undefined) Forecast, by Application 2020 & 2033
- Table 18: Mexico Healthcare Label Volume (K) Forecast, by Application 2020 & 2033
- Table 19: Global Healthcare Label Revenue undefined Forecast, by Application 2020 & 2033
- Table 20: Global Healthcare Label Volume K Forecast, by Application 2020 & 2033
- Table 21: Global Healthcare Label Revenue undefined Forecast, by Types 2020 & 2033
- Table 22: Global Healthcare Label Volume K Forecast, by Types 2020 & 2033
- Table 23: Global Healthcare Label Revenue undefined Forecast, by Country 2020 & 2033
- Table 24: Global Healthcare Label Volume K Forecast, by Country 2020 & 2033
- Table 25: Brazil Healthcare Label Revenue (undefined) Forecast, by Application 2020 & 2033
- Table 26: Brazil Healthcare Label Volume (K) Forecast, by Application 2020 & 2033
- Table 27: Argentina Healthcare Label Revenue (undefined) Forecast, by Application 2020 & 2033
- Table 28: Argentina Healthcare Label Volume (K) Forecast, by Application 2020 & 2033
- Table 29: Rest of South America Healthcare Label Revenue (undefined) Forecast, by Application 2020 & 2033
- Table 30: Rest of South America Healthcare Label Volume (K) Forecast, by Application 2020 & 2033
- Table 31: Global Healthcare Label Revenue undefined Forecast, by Application 2020 & 2033
- Table 32: Global Healthcare Label Volume K Forecast, by Application 2020 & 2033
- Table 33: Global Healthcare Label Revenue undefined Forecast, by Types 2020 & 2033
- Table 34: Global Healthcare Label Volume K Forecast, by Types 2020 & 2033
- Table 35: Global Healthcare Label Revenue undefined Forecast, by Country 2020 & 2033
- Table 36: Global Healthcare Label Volume K Forecast, by Country 2020 & 2033
- Table 37: United Kingdom Healthcare Label Revenue (undefined) Forecast, by Application 2020 & 2033
- Table 38: United Kingdom Healthcare Label Volume (K) Forecast, by Application 2020 & 2033
- Table 39: Germany Healthcare Label Revenue (undefined) Forecast, by Application 2020 & 2033
- Table 40: Germany Healthcare Label Volume (K) Forecast, by Application 2020 & 2033
- Table 41: France Healthcare Label Revenue (undefined) Forecast, by Application 2020 & 2033
- Table 42: France Healthcare Label Volume (K) Forecast, by Application 2020 & 2033
- Table 43: Italy Healthcare Label Revenue (undefined) Forecast, by Application 2020 & 2033
- Table 44: Italy Healthcare Label Volume (K) Forecast, by Application 2020 & 2033
- Table 45: Spain Healthcare Label Revenue (undefined) Forecast, by Application 2020 & 2033
- Table 46: Spain Healthcare Label Volume (K) Forecast, by Application 2020 & 2033
- Table 47: Russia Healthcare Label Revenue (undefined) Forecast, by Application 2020 & 2033
- Table 48: Russia Healthcare Label Volume (K) Forecast, by Application 2020 & 2033
- Table 49: Benelux Healthcare Label Revenue (undefined) Forecast, by Application 2020 & 2033
- Table 50: Benelux Healthcare Label Volume (K) Forecast, by Application 2020 & 2033
- Table 51: Nordics Healthcare Label Revenue (undefined) Forecast, by Application 2020 & 2033
- Table 52: Nordics Healthcare Label Volume (K) Forecast, by Application 2020 & 2033
- Table 53: Rest of Europe Healthcare Label Revenue (undefined) Forecast, by Application 2020 & 2033
- Table 54: Rest of Europe Healthcare Label Volume (K) Forecast, by Application 2020 & 2033
- Table 55: Global Healthcare Label Revenue undefined Forecast, by Application 2020 & 2033
- Table 56: Global Healthcare Label Volume K Forecast, by Application 2020 & 2033
- Table 57: Global Healthcare Label Revenue undefined Forecast, by Types 2020 & 2033
- Table 58: Global Healthcare Label Volume K Forecast, by Types 2020 & 2033
- Table 59: Global Healthcare Label Revenue undefined Forecast, by Country 2020 & 2033
- Table 60: Global Healthcare Label Volume K Forecast, by Country 2020 & 2033
- Table 61: Turkey Healthcare Label Revenue (undefined) Forecast, by Application 2020 & 2033
- Table 62: Turkey Healthcare Label Volume (K) Forecast, by Application 2020 & 2033
- Table 63: Israel Healthcare Label Revenue (undefined) Forecast, by Application 2020 & 2033
- Table 64: Israel Healthcare Label Volume (K) Forecast, by Application 2020 & 2033
- Table 65: GCC Healthcare Label Revenue (undefined) Forecast, by Application 2020 & 2033
- Table 66: GCC Healthcare Label Volume (K) Forecast, by Application 2020 & 2033
- Table 67: North Africa Healthcare Label Revenue (undefined) Forecast, by Application 2020 & 2033
- Table 68: North Africa Healthcare Label Volume (K) Forecast, by Application 2020 & 2033
- Table 69: South Africa Healthcare Label Revenue (undefined) Forecast, by Application 2020 & 2033
- Table 70: South Africa Healthcare Label Volume (K) Forecast, by Application 2020 & 2033
- Table 71: Rest of Middle East & Africa Healthcare Label Revenue (undefined) Forecast, by Application 2020 & 2033
- Table 72: Rest of Middle East & Africa Healthcare Label Volume (K) Forecast, by Application 2020 & 2033
- Table 73: Global Healthcare Label Revenue undefined Forecast, by Application 2020 & 2033
- Table 74: Global Healthcare Label Volume K Forecast, by Application 2020 & 2033
- Table 75: Global Healthcare Label Revenue undefined Forecast, by Types 2020 & 2033
- Table 76: Global Healthcare Label Volume K Forecast, by Types 2020 & 2033
- Table 77: Global Healthcare Label Revenue undefined Forecast, by Country 2020 & 2033
- Table 78: Global Healthcare Label Volume K Forecast, by Country 2020 & 2033
- Table 79: China Healthcare Label Revenue (undefined) Forecast, by Application 2020 & 2033
- Table 80: China Healthcare Label Volume (K) Forecast, by Application 2020 & 2033
- Table 81: India Healthcare Label Revenue (undefined) Forecast, by Application 2020 & 2033
- Table 82: India Healthcare Label Volume (K) Forecast, by Application 2020 & 2033
- Table 83: Japan Healthcare Label Revenue (undefined) Forecast, by Application 2020 & 2033
- Table 84: Japan Healthcare Label Volume (K) Forecast, by Application 2020 & 2033
- Table 85: South Korea Healthcare Label Revenue (undefined) Forecast, by Application 2020 & 2033
- Table 86: South Korea Healthcare Label Volume (K) Forecast, by Application 2020 & 2033
- Table 87: ASEAN Healthcare Label Revenue (undefined) Forecast, by Application 2020 & 2033
- Table 88: ASEAN Healthcare Label Volume (K) Forecast, by Application 2020 & 2033
- Table 89: Oceania Healthcare Label Revenue (undefined) Forecast, by Application 2020 & 2033
- Table 90: Oceania Healthcare Label Volume (K) Forecast, by Application 2020 & 2033
- Table 91: Rest of Asia Pacific Healthcare Label Revenue (undefined) Forecast, by Application 2020 & 2033
- Table 92: Rest of Asia Pacific Healthcare Label Volume (K) Forecast, by Application 2020 & 2033
Frequently Asked Questions
1. What is the projected Compound Annual Growth Rate (CAGR) of the Healthcare Label?
The projected CAGR is approximately 5.5%.
2. Which companies are prominent players in the Healthcare Label?
Key companies in the market include PDC(Brady), 3M, RR Donnelley & Sons, LabTAG, PRT Prints Private, DYMO Corporation, Tapecon, Arden Label, Avery Dennison, ATL, CCL Industries, First Products, CCL Healthcare, Multi-Color, UPM Raflatac, Mondi Group, Ahlstrom, Autajon Group, WestRock, Cardinal Health, Justdial, Xerafy Singapore, Cymmetrik.
3. What are the main segments of the Healthcare Label?
The market segments include Application, Types.
4. Can you provide details about the market size?
The market size is estimated to be USD XXX N/A as of 2022.
5. What are some drivers contributing to market growth?
N/A
6. What are the notable trends driving market growth?
N/A
7. Are there any restraints impacting market growth?
N/A
8. Can you provide examples of recent developments in the market?
N/A
9. What pricing options are available for accessing the report?
Pricing options include single-user, multi-user, and enterprise licenses priced at USD 3950.00, USD 5925.00, and USD 7900.00 respectively.
10. Is the market size provided in terms of value or volume?
The market size is provided in terms of value, measured in N/A and volume, measured in K.
11. Are there any specific market keywords associated with the report?
Yes, the market keyword associated with the report is "Healthcare Label," which aids in identifying and referencing the specific market segment covered.
12. How do I determine which pricing option suits my needs best?
The pricing options vary based on user requirements and access needs. Individual users may opt for single-user licenses, while businesses requiring broader access may choose multi-user or enterprise licenses for cost-effective access to the report.
13. Are there any additional resources or data provided in the Healthcare Label report?
While the report offers comprehensive insights, it's advisable to review the specific contents or supplementary materials provided to ascertain if additional resources or data are available.
14. How can I stay updated on further developments or reports in the Healthcare Label?
To stay informed about further developments, trends, and reports in the Healthcare Label, consider subscribing to industry newsletters, following relevant companies and organizations, or regularly checking reputable industry news sources and publications.
Methodology
Step 1 - Identification of Relevant Samples Size from Population Database


Step 2 - Approaches for Defining Global Market Size (Value, Volume* & Price*)

Note*: In applicable scenarios
Step 3 - Data Sources
Primary Research
- Web Analytics
- Survey Reports
- Research Institute
- Latest Research Reports
- Opinion Leaders
Secondary Research
- Annual Reports
- White Paper
- Latest Press Release
- Industry Association
- Paid Database
- Investor Presentations

Step 4 - Data Triangulation
Involves using different sources of information in order to increase the validity of a study
These sources are likely to be stakeholders in a program - participants, other researchers, program staff, other community members, and so on.
Then we put all data in single framework & apply various statistical tools to find out the dynamic on the market.
During the analysis stage, feedback from the stakeholder groups would be compared to determine areas of agreement as well as areas of divergence