

Key Insights
The holographic foil market is experiencing robust growth, driven by increasing demand across diverse sectors. The market size in 2025 is estimated at $2.5 billion, with a Compound Annual Growth Rate (CAGR) of approximately 7% projected from 2025 to 2033. This expansion is fueled by several key factors. The burgeoning packaging industry, particularly in cosmetics, pharmaceuticals, and luxury goods, is a major driver, as holographic foils offer enhanced brand security and aesthetic appeal. Furthermore, the rise of counterfeiting and brand protection concerns are prompting wider adoption of holographic security features. Technological advancements in foil production, including the development of more sustainable and eco-friendly materials, are also contributing to market growth. Key players such as K Laser Technology, Kurz, and Uflex Limited are investing significantly in research and development, introducing innovative products with improved durability, color variations, and design capabilities. The market is segmented by application (packaging, security, decoration) and geography, with North America and Europe currently holding significant market share. However, Asia-Pacific is expected to witness substantial growth in the coming years due to rising disposable incomes and expanding manufacturing sectors.
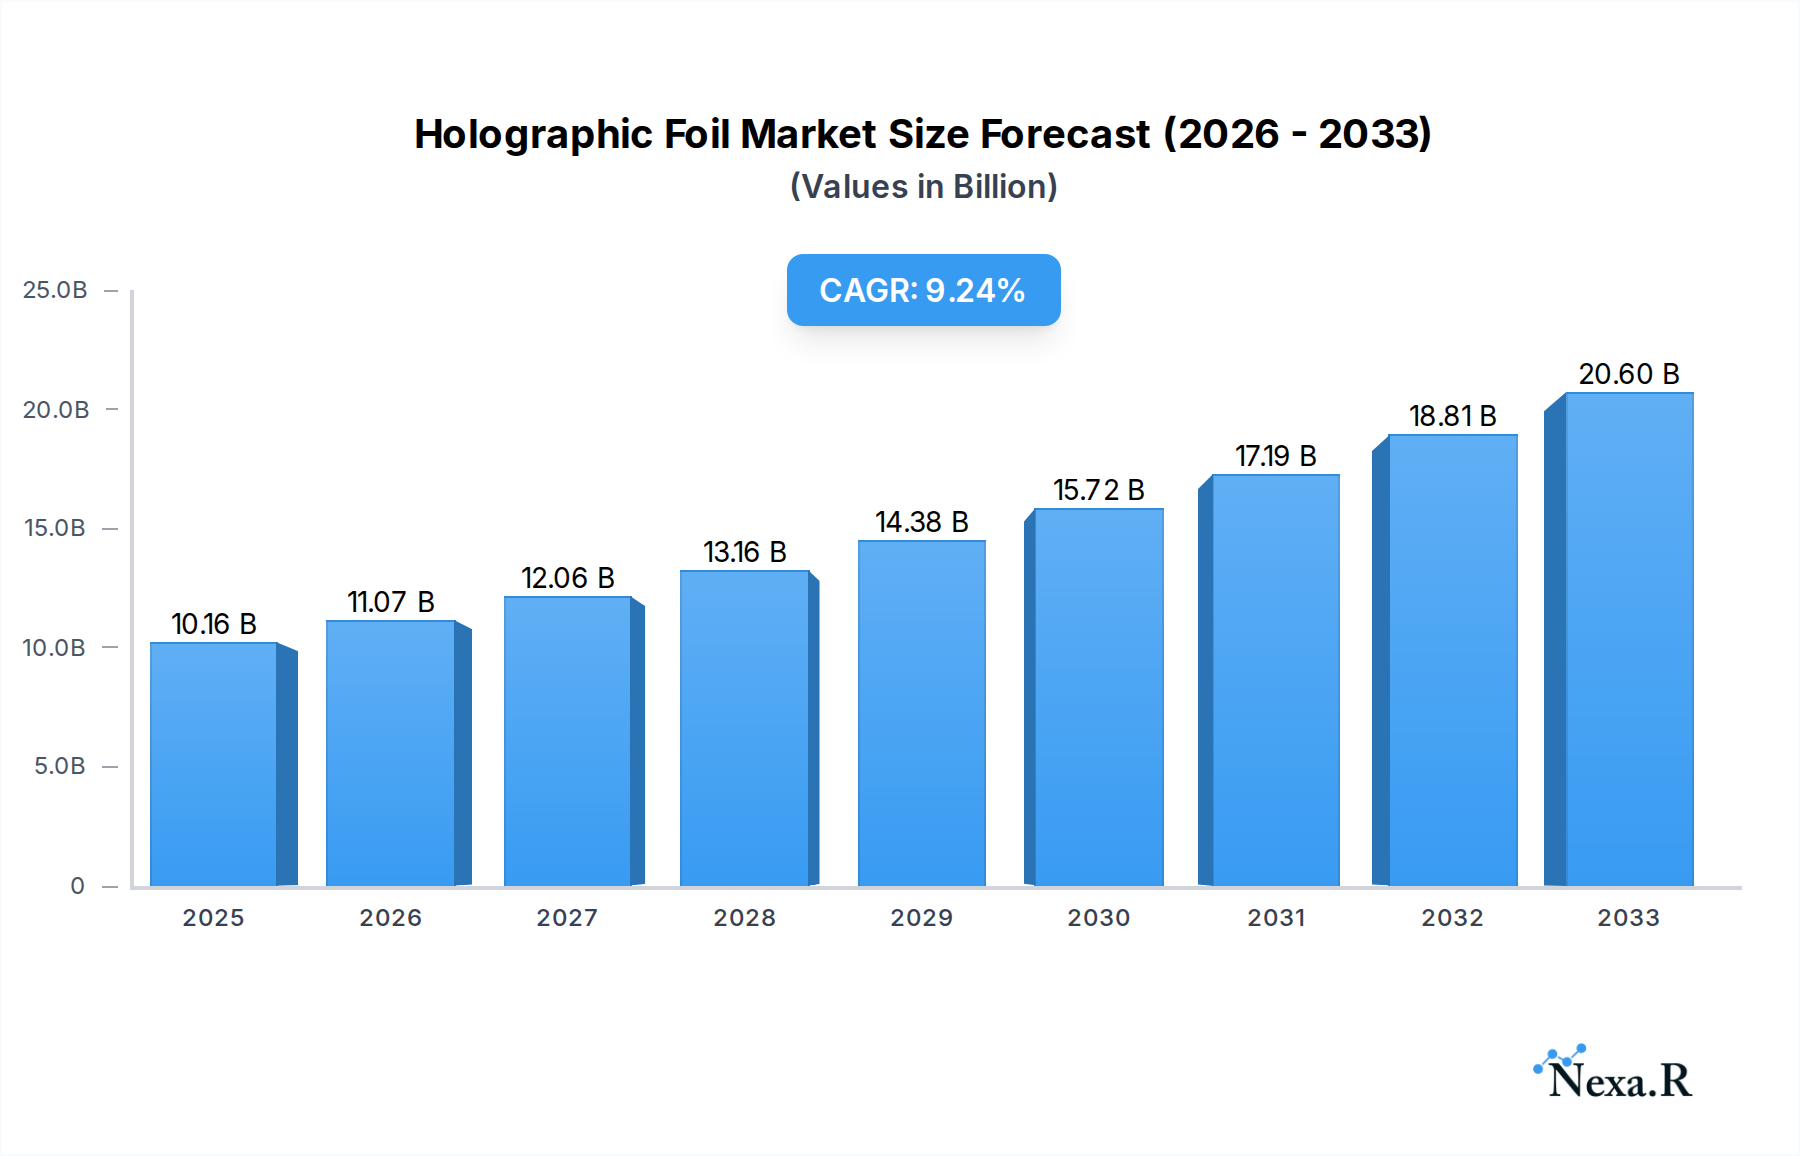
Holographic Foil Market Size (In Billion)
While the market presents significant opportunities, certain restraints exist. Fluctuations in raw material prices, particularly for metals and polymers, can impact profitability. Moreover, the increasing competition from alternative security technologies, such as digital watermarking and RFID tags, poses a challenge. However, the unique aesthetic and security features of holographic foils, coupled with ongoing innovation, position this market for sustained growth. The strategic partnerships and mergers and acquisitions within the industry further solidify its competitive landscape and foster future growth. The forecast for 2033 projects a market valuation exceeding $4 billion, demonstrating the considerable potential for this technology.

Holographic Foil Company Market Share
Holographic Foil Market Report: 2019-2033
This comprehensive report provides a detailed analysis of the holographic foil market, encompassing market dynamics, growth trends, regional dominance, product landscape, key players, and future outlook. The study period spans 2019-2033, with 2025 as the base and estimated year. The forecast period covers 2025-2033, and the historical period encompasses 2019-2024. This report is invaluable for industry professionals, investors, and strategic decision-makers seeking to navigate this dynamic market.
Holographic Foil Market Dynamics & Structure
The holographic foil market, valued at $XX million in 2025, exhibits a moderately concentrated structure with several major players holding significant market share. Technological innovation, particularly in laser-based manufacturing and material science, is a key driver. Stringent regulatory frameworks concerning material safety and environmental impact influence production processes. Competitive substitutes, such as digitally printed foils and conventional printing methods, pose a challenge. The end-user demographics are diverse, spanning packaging, security, and decorative applications. M&A activity has been moderate in recent years, with approximately XX deals recorded between 2019 and 2024, primarily focused on expanding product portfolios and geographical reach.
- Market Concentration: Moderately concentrated, with top 5 players holding approximately XX% market share in 2025.
- Technological Innovation: Advancements in laser technology, nanomaterials, and printing techniques drive product differentiation and cost reduction.
- Regulatory Landscape: Compliance with environmental and safety regulations (e.g., REACH, RoHS) presents both challenges and opportunities for innovation.
- Competitive Substitutes: Digital printing and conventional printing techniques offer cost-effective alternatives in specific applications.
- End-User Demographics: Packaging (XX%), Security (XX%), Decorative applications (XX%), others (XX%).
- M&A Activity: XX deals recorded between 2019 and 2024, resulting in an average deal value of $XX million.
Holographic Foil Growth Trends & Insights
The holographic foil market is projected to experience robust growth, with a CAGR of XX% during the forecast period (2025-2033). This growth is fueled by increasing demand from the packaging industry, driven by the rising popularity of consumer goods and e-commerce. The adoption rate of holographic foils is steadily increasing across various sectors, particularly in high-value products requiring enhanced security features. Technological disruptions, such as the development of more sustainable and cost-effective manufacturing processes, are further accelerating market expansion. Shifting consumer preferences towards aesthetically appealing and secure products also contribute to this growth. Market penetration is expected to reach XX% by 2033, signifying significant growth potential in untapped markets.
Dominant Regions, Countries, or Segments in Holographic Foil
Asia-Pacific dominates the holographic foil market, accounting for approximately XX% of the global market share in 2025. This dominance is primarily attributed to the region's robust manufacturing base, substantial consumer goods production, and rapid economic growth. China, in particular, emerges as a key market driver due to its large and expanding packaging industry. Other regions like North America and Europe also show significant growth potential due to increasing demand from the security and luxury goods sectors.
- Key Drivers in Asia-Pacific:
- Strong manufacturing base and large consumer goods market.
- Rapid economic growth and increasing disposable incomes.
- Favorable government policies promoting industrial development.
- Dominance Factors:
- Cost-competitive manufacturing capabilities.
- Established supply chains and raw material availability.
- High demand from diverse end-use sectors.
Holographic Foil Product Landscape
Holographic foils are available in various forms, including hot-stamping foils, cold-stamping foils, and transfer foils, each offering unique properties and applications. Recent innovations focus on enhancing durability, developing environmentally friendly materials, and expanding color palettes. Unique selling propositions include enhanced security features, improved scratch resistance, and customizable designs to meet specific branding needs. Technological advancements such as nanotechnology-enhanced foils are improving visual appeal and security features.
Key Drivers, Barriers & Challenges in Holographic Foil
Key Drivers:
- Increasing demand for sophisticated packaging solutions across various industries.
- Growing need for enhanced security features in documents and products.
- Rising consumer preference for aesthetically appealing and innovative packaging.
- Technological advancements leading to cost reduction and improved product performance.
Challenges and Restraints:
- Fluctuations in raw material prices impact production costs.
- Intense competition from substitute materials and technologies.
- Stringent environmental regulations pose manufacturing challenges.
- Supply chain disruptions can cause delays and increase costs. The impact of this is estimated to have reduced market growth by approximately XX% in 2024.
Emerging Opportunities in Holographic Foil
Emerging opportunities lie in expanding into untapped markets, such as personalized packaging and smart labels. Innovative applications in areas like anti-counterfeiting technologies and brand authentication are also creating new avenues for growth. Evolving consumer preferences towards sustainable and eco-friendly products are driving demand for biodegradable and recyclable holographic foils.
Growth Accelerators in the Holographic Foil Industry
Technological breakthroughs in material science and manufacturing processes are expected to drive long-term growth. Strategic partnerships between foil manufacturers and packaging companies are facilitating product development and market penetration. Expansion into new geographical regions, particularly in developing economies, presents substantial growth opportunities.
Key Players Shaping the Holographic Foil Market
- K Laser Technology
- Kurz
- ITW ShineMark
- Uflex Limited
- Zhejiang Jinghua Laser Technology
- Shenzhen Jinjia Group
- Holostik
- SVG Tech Group
- Hazen Paper
- Crown Roll Leaf
- API
- Giusto Manetti Battiloro
- Foilco
- UNIVACCO
- Shantou Wanshun New Material Group
- Light Logics
- AFC Hologram
- Katani co.,ltd
- NAKAJIMA METAL
- Everest Holovisions Limited
Notable Milestones in Holographic Foil Sector
- 2020, Q4: Introduction of a new biodegradable holographic foil by X company.
- 2022, Q2: Merger between two major holographic foil manufacturers resulting in a market share increase of XX%.
- 2023, Q1: Launch of a new high-security holographic foil with advanced anti-counterfeiting features.
In-Depth Holographic Foil Market Outlook
The holographic foil market is poised for continued growth, driven by technological advancements, rising demand from various sectors, and expansion into new markets. Strategic partnerships, sustainable product development, and focused R&D initiatives are crucial for capturing significant market share. The market is expected to reach $XX million by 2033, presenting lucrative opportunities for both established players and new entrants.
Holographic Foil Segmentation
-
1. Application
- 1.1. Cigarette
- 1.2. Personal Care and Cosmetics
- 1.3. Food and Drinks
- 1.4. Others
-
2. Types
- 2.1. Holographic Hot Stamping Foil
- 2.2. Holographic Cold Foil
- 2.3. Holographic Laminated Foil
Holographic Foil Segmentation By Geography
-
1. North America
- 1.1. United States
- 1.2. Canada
- 1.3. Mexico
-
2. South America
- 2.1. Brazil
- 2.2. Argentina
- 2.3. Rest of South America
-
3. Europe
- 3.1. United Kingdom
- 3.2. Germany
- 3.3. France
- 3.4. Italy
- 3.5. Spain
- 3.6. Russia
- 3.7. Benelux
- 3.8. Nordics
- 3.9. Rest of Europe
-
4. Middle East & Africa
- 4.1. Turkey
- 4.2. Israel
- 4.3. GCC
- 4.4. North Africa
- 4.5. South Africa
- 4.6. Rest of Middle East & Africa
-
5. Asia Pacific
- 5.1. China
- 5.2. India
- 5.3. Japan
- 5.4. South Korea
- 5.5. ASEAN
- 5.6. Oceania
- 5.7. Rest of Asia Pacific
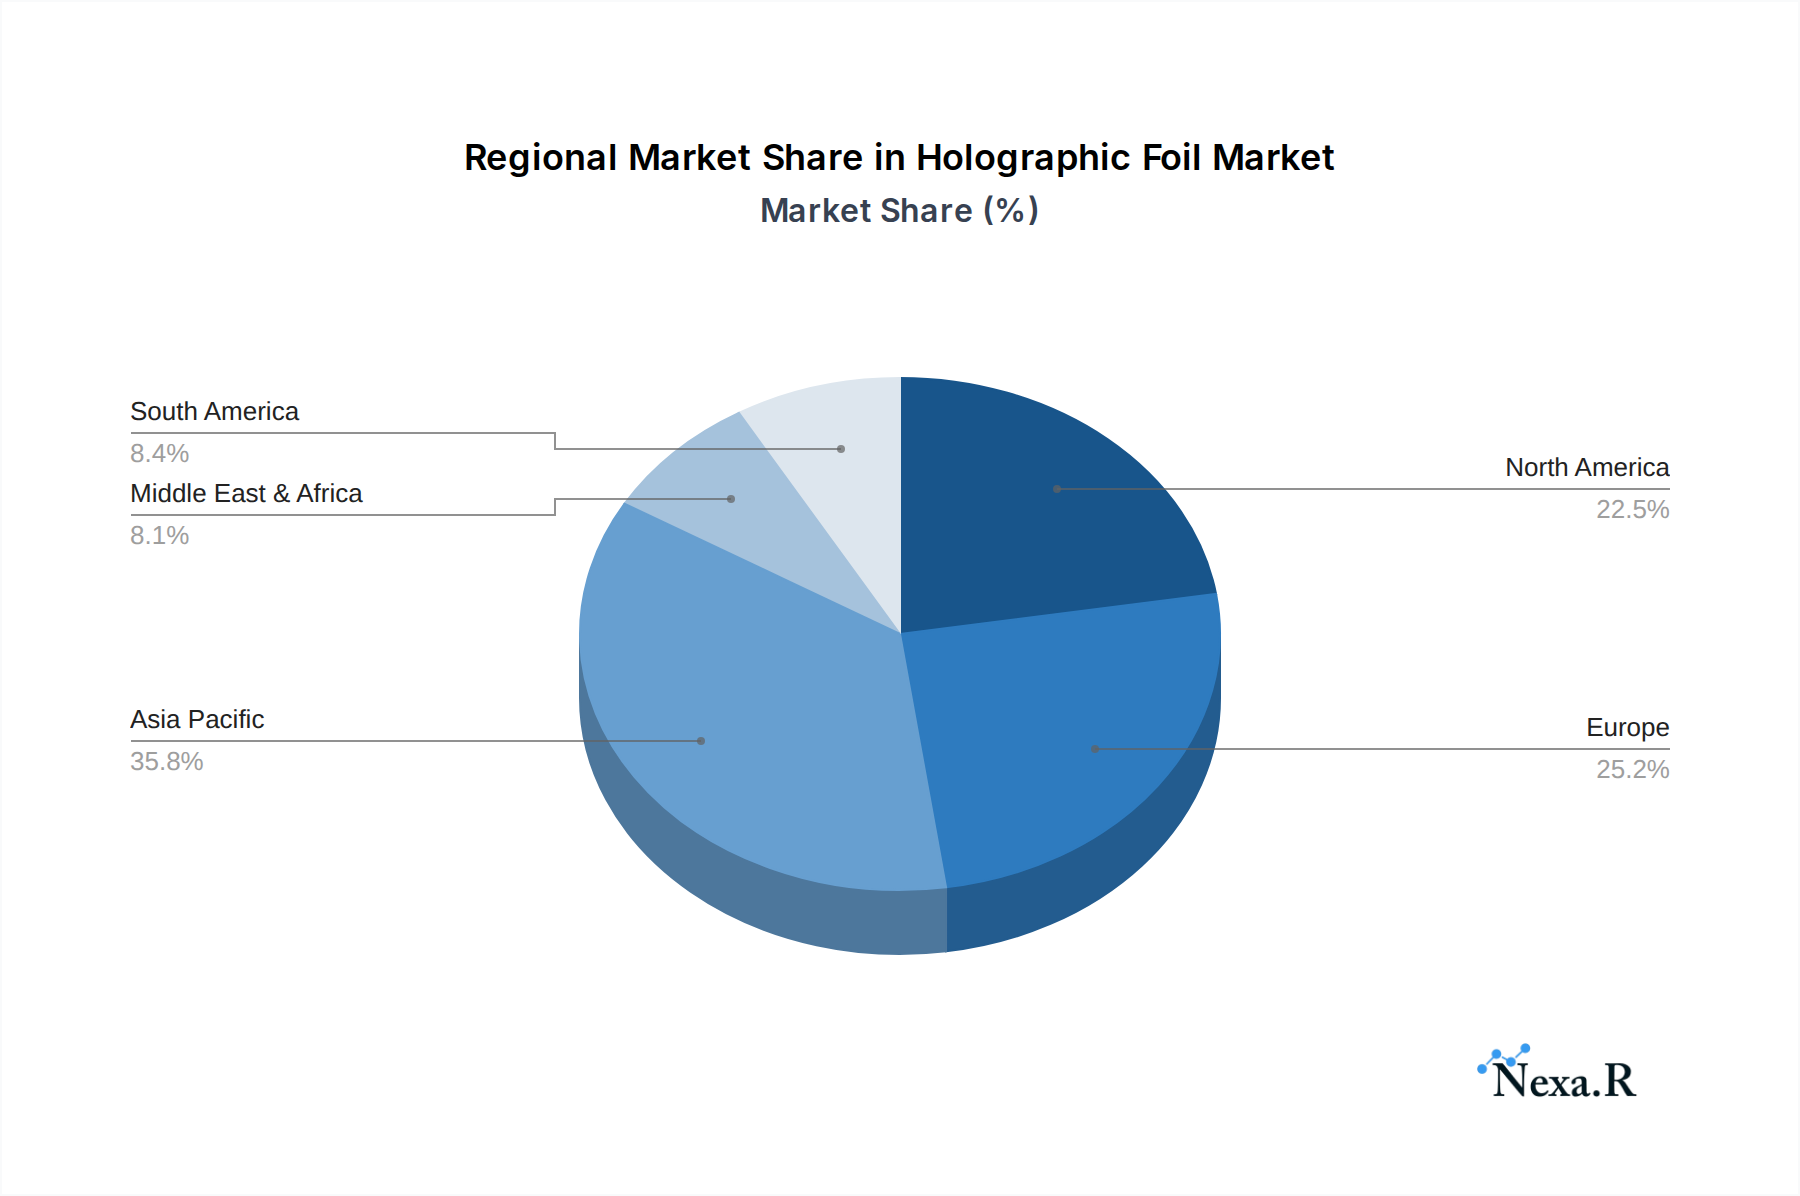
Holographic Foil Regional Market Share
Geographic Coverage of Holographic Foil
Holographic Foil REPORT HIGHLIGHTS
| Aspects | Details |
|---|---|
| Study Period | 2020-2034 |
| Base Year | 2025 |
| Estimated Year | 2026 |
| Forecast Period | 2026-2034 |
| Historical Period | 2020-2025 |
| Growth Rate | CAGR of 10.8% from 2020-2034 |
| Segmentation |
|
Table of Contents
- 1. Introduction
- 1.1. Research Scope
- 1.2. Market Segmentation
- 1.3. Research Methodology
- 1.4. Definitions and Assumptions
- 2. Executive Summary
- 2.1. Introduction
- 3. Market Dynamics
- 3.1. Introduction
- 3.2. Market Drivers
- 3.3. Market Restrains
- 3.4. Market Trends
- 4. Market Factor Analysis
- 4.1. Porters Five Forces
- 4.2. Supply/Value Chain
- 4.3. PESTEL analysis
- 4.4. Market Entropy
- 4.5. Patent/Trademark Analysis
- 5. Global Holographic Foil Analysis, Insights and Forecast, 2020-2032
- 5.1. Market Analysis, Insights and Forecast - by Application
- 5.1.1. Cigarette
- 5.1.2. Personal Care and Cosmetics
- 5.1.3. Food and Drinks
- 5.1.4. Others
- 5.2. Market Analysis, Insights and Forecast - by Types
- 5.2.1. Holographic Hot Stamping Foil
- 5.2.2. Holographic Cold Foil
- 5.2.3. Holographic Laminated Foil
- 5.3. Market Analysis, Insights and Forecast - by Region
- 5.3.1. North America
- 5.3.2. South America
- 5.3.3. Europe
- 5.3.4. Middle East & Africa
- 5.3.5. Asia Pacific
- 5.1. Market Analysis, Insights and Forecast - by Application
- 6. North America Holographic Foil Analysis, Insights and Forecast, 2020-2032
- 6.1. Market Analysis, Insights and Forecast - by Application
- 6.1.1. Cigarette
- 6.1.2. Personal Care and Cosmetics
- 6.1.3. Food and Drinks
- 6.1.4. Others
- 6.2. Market Analysis, Insights and Forecast - by Types
- 6.2.1. Holographic Hot Stamping Foil
- 6.2.2. Holographic Cold Foil
- 6.2.3. Holographic Laminated Foil
- 6.1. Market Analysis, Insights and Forecast - by Application
- 7. South America Holographic Foil Analysis, Insights and Forecast, 2020-2032
- 7.1. Market Analysis, Insights and Forecast - by Application
- 7.1.1. Cigarette
- 7.1.2. Personal Care and Cosmetics
- 7.1.3. Food and Drinks
- 7.1.4. Others
- 7.2. Market Analysis, Insights and Forecast - by Types
- 7.2.1. Holographic Hot Stamping Foil
- 7.2.2. Holographic Cold Foil
- 7.2.3. Holographic Laminated Foil
- 7.1. Market Analysis, Insights and Forecast - by Application
- 8. Europe Holographic Foil Analysis, Insights and Forecast, 2020-2032
- 8.1. Market Analysis, Insights and Forecast - by Application
- 8.1.1. Cigarette
- 8.1.2. Personal Care and Cosmetics
- 8.1.3. Food and Drinks
- 8.1.4. Others
- 8.2. Market Analysis, Insights and Forecast - by Types
- 8.2.1. Holographic Hot Stamping Foil
- 8.2.2. Holographic Cold Foil
- 8.2.3. Holographic Laminated Foil
- 8.1. Market Analysis, Insights and Forecast - by Application
- 9. Middle East & Africa Holographic Foil Analysis, Insights and Forecast, 2020-2032
- 9.1. Market Analysis, Insights and Forecast - by Application
- 9.1.1. Cigarette
- 9.1.2. Personal Care and Cosmetics
- 9.1.3. Food and Drinks
- 9.1.4. Others
- 9.2. Market Analysis, Insights and Forecast - by Types
- 9.2.1. Holographic Hot Stamping Foil
- 9.2.2. Holographic Cold Foil
- 9.2.3. Holographic Laminated Foil
- 9.1. Market Analysis, Insights and Forecast - by Application
- 10. Asia Pacific Holographic Foil Analysis, Insights and Forecast, 2020-2032
- 10.1. Market Analysis, Insights and Forecast - by Application
- 10.1.1. Cigarette
- 10.1.2. Personal Care and Cosmetics
- 10.1.3. Food and Drinks
- 10.1.4. Others
- 10.2. Market Analysis, Insights and Forecast - by Types
- 10.2.1. Holographic Hot Stamping Foil
- 10.2.2. Holographic Cold Foil
- 10.2.3. Holographic Laminated Foil
- 10.1. Market Analysis, Insights and Forecast - by Application
- 11. Competitive Analysis
- 11.1. Global Market Share Analysis 2025
- 11.2. Company Profiles
- 11.2.1 K Laser Technology
- 11.2.1.1. Overview
- 11.2.1.2. Products
- 11.2.1.3. SWOT Analysis
- 11.2.1.4. Recent Developments
- 11.2.1.5. Financials (Based on Availability)
- 11.2.2 Kurz
- 11.2.2.1. Overview
- 11.2.2.2. Products
- 11.2.2.3. SWOT Analysis
- 11.2.2.4. Recent Developments
- 11.2.2.5. Financials (Based on Availability)
- 11.2.3 ITW ShineMark
- 11.2.3.1. Overview
- 11.2.3.2. Products
- 11.2.3.3. SWOT Analysis
- 11.2.3.4. Recent Developments
- 11.2.3.5. Financials (Based on Availability)
- 11.2.4 Uflex Limited
- 11.2.4.1. Overview
- 11.2.4.2. Products
- 11.2.4.3. SWOT Analysis
- 11.2.4.4. Recent Developments
- 11.2.4.5. Financials (Based on Availability)
- 11.2.5 Zhejiang Jinghua Laser Technology
- 11.2.5.1. Overview
- 11.2.5.2. Products
- 11.2.5.3. SWOT Analysis
- 11.2.5.4. Recent Developments
- 11.2.5.5. Financials (Based on Availability)
- 11.2.6 Shenzhen Jinjia Group
- 11.2.6.1. Overview
- 11.2.6.2. Products
- 11.2.6.3. SWOT Analysis
- 11.2.6.4. Recent Developments
- 11.2.6.5. Financials (Based on Availability)
- 11.2.7 Holostik
- 11.2.7.1. Overview
- 11.2.7.2. Products
- 11.2.7.3. SWOT Analysis
- 11.2.7.4. Recent Developments
- 11.2.7.5. Financials (Based on Availability)
- 11.2.8 SVG Tech Group
- 11.2.8.1. Overview
- 11.2.8.2. Products
- 11.2.8.3. SWOT Analysis
- 11.2.8.4. Recent Developments
- 11.2.8.5. Financials (Based on Availability)
- 11.2.9 Hazen Paper
- 11.2.9.1. Overview
- 11.2.9.2. Products
- 11.2.9.3. SWOT Analysis
- 11.2.9.4. Recent Developments
- 11.2.9.5. Financials (Based on Availability)
- 11.2.10 Crown Roll Leaf
- 11.2.10.1. Overview
- 11.2.10.2. Products
- 11.2.10.3. SWOT Analysis
- 11.2.10.4. Recent Developments
- 11.2.10.5. Financials (Based on Availability)
- 11.2.11 API
- 11.2.11.1. Overview
- 11.2.11.2. Products
- 11.2.11.3. SWOT Analysis
- 11.2.11.4. Recent Developments
- 11.2.11.5. Financials (Based on Availability)
- 11.2.12 Giusto Manetti Battiloro
- 11.2.12.1. Overview
- 11.2.12.2. Products
- 11.2.12.3. SWOT Analysis
- 11.2.12.4. Recent Developments
- 11.2.12.5. Financials (Based on Availability)
- 11.2.13 Foilco
- 11.2.13.1. Overview
- 11.2.13.2. Products
- 11.2.13.3. SWOT Analysis
- 11.2.13.4. Recent Developments
- 11.2.13.5. Financials (Based on Availability)
- 11.2.14 UNIVACCO
- 11.2.14.1. Overview
- 11.2.14.2. Products
- 11.2.14.3. SWOT Analysis
- 11.2.14.4. Recent Developments
- 11.2.14.5. Financials (Based on Availability)
- 11.2.15 Shantou Wanshun New Material Group
- 11.2.15.1. Overview
- 11.2.15.2. Products
- 11.2.15.3. SWOT Analysis
- 11.2.15.4. Recent Developments
- 11.2.15.5. Financials (Based on Availability)
- 11.2.16 Light Logics
- 11.2.16.1. Overview
- 11.2.16.2. Products
- 11.2.16.3. SWOT Analysis
- 11.2.16.4. Recent Developments
- 11.2.16.5. Financials (Based on Availability)
- 11.2.17 AFC Hologram
- 11.2.17.1. Overview
- 11.2.17.2. Products
- 11.2.17.3. SWOT Analysis
- 11.2.17.4. Recent Developments
- 11.2.17.5. Financials (Based on Availability)
- 11.2.18 Katani co.
- 11.2.18.1. Overview
- 11.2.18.2. Products
- 11.2.18.3. SWOT Analysis
- 11.2.18.4. Recent Developments
- 11.2.18.5. Financials (Based on Availability)
- 11.2.19 ltd
- 11.2.19.1. Overview
- 11.2.19.2. Products
- 11.2.19.3. SWOT Analysis
- 11.2.19.4. Recent Developments
- 11.2.19.5. Financials (Based on Availability)
- 11.2.20 NAKAJIMA METAL
- 11.2.20.1. Overview
- 11.2.20.2. Products
- 11.2.20.3. SWOT Analysis
- 11.2.20.4. Recent Developments
- 11.2.20.5. Financials (Based on Availability)
- 11.2.21 Everest Holovisions Limited
- 11.2.21.1. Overview
- 11.2.21.2. Products
- 11.2.21.3. SWOT Analysis
- 11.2.21.4. Recent Developments
- 11.2.21.5. Financials (Based on Availability)
- 11.2.1 K Laser Technology
List of Figures
- Figure 1: Global Holographic Foil Revenue Breakdown (undefined, %) by Region 2025 & 2033
- Figure 2: North America Holographic Foil Revenue (undefined), by Application 2025 & 2033
- Figure 3: North America Holographic Foil Revenue Share (%), by Application 2025 & 2033
- Figure 4: North America Holographic Foil Revenue (undefined), by Types 2025 & 2033
- Figure 5: North America Holographic Foil Revenue Share (%), by Types 2025 & 2033
- Figure 6: North America Holographic Foil Revenue (undefined), by Country 2025 & 2033
- Figure 7: North America Holographic Foil Revenue Share (%), by Country 2025 & 2033
- Figure 8: South America Holographic Foil Revenue (undefined), by Application 2025 & 2033
- Figure 9: South America Holographic Foil Revenue Share (%), by Application 2025 & 2033
- Figure 10: South America Holographic Foil Revenue (undefined), by Types 2025 & 2033
- Figure 11: South America Holographic Foil Revenue Share (%), by Types 2025 & 2033
- Figure 12: South America Holographic Foil Revenue (undefined), by Country 2025 & 2033
- Figure 13: South America Holographic Foil Revenue Share (%), by Country 2025 & 2033
- Figure 14: Europe Holographic Foil Revenue (undefined), by Application 2025 & 2033
- Figure 15: Europe Holographic Foil Revenue Share (%), by Application 2025 & 2033
- Figure 16: Europe Holographic Foil Revenue (undefined), by Types 2025 & 2033
- Figure 17: Europe Holographic Foil Revenue Share (%), by Types 2025 & 2033
- Figure 18: Europe Holographic Foil Revenue (undefined), by Country 2025 & 2033
- Figure 19: Europe Holographic Foil Revenue Share (%), by Country 2025 & 2033
- Figure 20: Middle East & Africa Holographic Foil Revenue (undefined), by Application 2025 & 2033
- Figure 21: Middle East & Africa Holographic Foil Revenue Share (%), by Application 2025 & 2033
- Figure 22: Middle East & Africa Holographic Foil Revenue (undefined), by Types 2025 & 2033
- Figure 23: Middle East & Africa Holographic Foil Revenue Share (%), by Types 2025 & 2033
- Figure 24: Middle East & Africa Holographic Foil Revenue (undefined), by Country 2025 & 2033
- Figure 25: Middle East & Africa Holographic Foil Revenue Share (%), by Country 2025 & 2033
- Figure 26: Asia Pacific Holographic Foil Revenue (undefined), by Application 2025 & 2033
- Figure 27: Asia Pacific Holographic Foil Revenue Share (%), by Application 2025 & 2033
- Figure 28: Asia Pacific Holographic Foil Revenue (undefined), by Types 2025 & 2033
- Figure 29: Asia Pacific Holographic Foil Revenue Share (%), by Types 2025 & 2033
- Figure 30: Asia Pacific Holographic Foil Revenue (undefined), by Country 2025 & 2033
- Figure 31: Asia Pacific Holographic Foil Revenue Share (%), by Country 2025 & 2033
List of Tables
- Table 1: Global Holographic Foil Revenue undefined Forecast, by Application 2020 & 2033
- Table 2: Global Holographic Foil Revenue undefined Forecast, by Types 2020 & 2033
- Table 3: Global Holographic Foil Revenue undefined Forecast, by Region 2020 & 2033
- Table 4: Global Holographic Foil Revenue undefined Forecast, by Application 2020 & 2033
- Table 5: Global Holographic Foil Revenue undefined Forecast, by Types 2020 & 2033
- Table 6: Global Holographic Foil Revenue undefined Forecast, by Country 2020 & 2033
- Table 7: United States Holographic Foil Revenue (undefined) Forecast, by Application 2020 & 2033
- Table 8: Canada Holographic Foil Revenue (undefined) Forecast, by Application 2020 & 2033
- Table 9: Mexico Holographic Foil Revenue (undefined) Forecast, by Application 2020 & 2033
- Table 10: Global Holographic Foil Revenue undefined Forecast, by Application 2020 & 2033
- Table 11: Global Holographic Foil Revenue undefined Forecast, by Types 2020 & 2033
- Table 12: Global Holographic Foil Revenue undefined Forecast, by Country 2020 & 2033
- Table 13: Brazil Holographic Foil Revenue (undefined) Forecast, by Application 2020 & 2033
- Table 14: Argentina Holographic Foil Revenue (undefined) Forecast, by Application 2020 & 2033
- Table 15: Rest of South America Holographic Foil Revenue (undefined) Forecast, by Application 2020 & 2033
- Table 16: Global Holographic Foil Revenue undefined Forecast, by Application 2020 & 2033
- Table 17: Global Holographic Foil Revenue undefined Forecast, by Types 2020 & 2033
- Table 18: Global Holographic Foil Revenue undefined Forecast, by Country 2020 & 2033
- Table 19: United Kingdom Holographic Foil Revenue (undefined) Forecast, by Application 2020 & 2033
- Table 20: Germany Holographic Foil Revenue (undefined) Forecast, by Application 2020 & 2033
- Table 21: France Holographic Foil Revenue (undefined) Forecast, by Application 2020 & 2033
- Table 22: Italy Holographic Foil Revenue (undefined) Forecast, by Application 2020 & 2033
- Table 23: Spain Holographic Foil Revenue (undefined) Forecast, by Application 2020 & 2033
- Table 24: Russia Holographic Foil Revenue (undefined) Forecast, by Application 2020 & 2033
- Table 25: Benelux Holographic Foil Revenue (undefined) Forecast, by Application 2020 & 2033
- Table 26: Nordics Holographic Foil Revenue (undefined) Forecast, by Application 2020 & 2033
- Table 27: Rest of Europe Holographic Foil Revenue (undefined) Forecast, by Application 2020 & 2033
- Table 28: Global Holographic Foil Revenue undefined Forecast, by Application 2020 & 2033
- Table 29: Global Holographic Foil Revenue undefined Forecast, by Types 2020 & 2033
- Table 30: Global Holographic Foil Revenue undefined Forecast, by Country 2020 & 2033
- Table 31: Turkey Holographic Foil Revenue (undefined) Forecast, by Application 2020 & 2033
- Table 32: Israel Holographic Foil Revenue (undefined) Forecast, by Application 2020 & 2033
- Table 33: GCC Holographic Foil Revenue (undefined) Forecast, by Application 2020 & 2033
- Table 34: North Africa Holographic Foil Revenue (undefined) Forecast, by Application 2020 & 2033
- Table 35: South Africa Holographic Foil Revenue (undefined) Forecast, by Application 2020 & 2033
- Table 36: Rest of Middle East & Africa Holographic Foil Revenue (undefined) Forecast, by Application 2020 & 2033
- Table 37: Global Holographic Foil Revenue undefined Forecast, by Application 2020 & 2033
- Table 38: Global Holographic Foil Revenue undefined Forecast, by Types 2020 & 2033
- Table 39: Global Holographic Foil Revenue undefined Forecast, by Country 2020 & 2033
- Table 40: China Holographic Foil Revenue (undefined) Forecast, by Application 2020 & 2033
- Table 41: India Holographic Foil Revenue (undefined) Forecast, by Application 2020 & 2033
- Table 42: Japan Holographic Foil Revenue (undefined) Forecast, by Application 2020 & 2033
- Table 43: South Korea Holographic Foil Revenue (undefined) Forecast, by Application 2020 & 2033
- Table 44: ASEAN Holographic Foil Revenue (undefined) Forecast, by Application 2020 & 2033
- Table 45: Oceania Holographic Foil Revenue (undefined) Forecast, by Application 2020 & 2033
- Table 46: Rest of Asia Pacific Holographic Foil Revenue (undefined) Forecast, by Application 2020 & 2033
Frequently Asked Questions
1. What is the projected Compound Annual Growth Rate (CAGR) of the Holographic Foil?
The projected CAGR is approximately 10.8%.
2. Which companies are prominent players in the Holographic Foil?
Key companies in the market include K Laser Technology, Kurz, ITW ShineMark, Uflex Limited, Zhejiang Jinghua Laser Technology, Shenzhen Jinjia Group, Holostik, SVG Tech Group, Hazen Paper, Crown Roll Leaf, API, Giusto Manetti Battiloro, Foilco, UNIVACCO, Shantou Wanshun New Material Group, Light Logics, AFC Hologram, Katani co., ltd, NAKAJIMA METAL, Everest Holovisions Limited.
3. What are the main segments of the Holographic Foil?
The market segments include Application, Types.
4. Can you provide details about the market size?
The market size is estimated to be USD XXX N/A as of 2022.
5. What are some drivers contributing to market growth?
N/A
6. What are the notable trends driving market growth?
N/A
7. Are there any restraints impacting market growth?
N/A
8. Can you provide examples of recent developments in the market?
N/A
9. What pricing options are available for accessing the report?
Pricing options include single-user, multi-user, and enterprise licenses priced at USD 2900.00, USD 4350.00, and USD 5800.00 respectively.
10. Is the market size provided in terms of value or volume?
The market size is provided in terms of value, measured in N/A.
11. Are there any specific market keywords associated with the report?
Yes, the market keyword associated with the report is "Holographic Foil," which aids in identifying and referencing the specific market segment covered.
12. How do I determine which pricing option suits my needs best?
The pricing options vary based on user requirements and access needs. Individual users may opt for single-user licenses, while businesses requiring broader access may choose multi-user or enterprise licenses for cost-effective access to the report.
13. Are there any additional resources or data provided in the Holographic Foil report?
While the report offers comprehensive insights, it's advisable to review the specific contents or supplementary materials provided to ascertain if additional resources or data are available.
14. How can I stay updated on further developments or reports in the Holographic Foil?
To stay informed about further developments, trends, and reports in the Holographic Foil, consider subscribing to industry newsletters, following relevant companies and organizations, or regularly checking reputable industry news sources and publications.
Methodology
Step 1 - Identification of Relevant Samples Size from Population Database


Step 2 - Approaches for Defining Global Market Size (Value, Volume* & Price*)

Note*: In applicable scenarios
Step 3 - Data Sources
Primary Research
- Web Analytics
- Survey Reports
- Research Institute
- Latest Research Reports
- Opinion Leaders
Secondary Research
- Annual Reports
- White Paper
- Latest Press Release
- Industry Association
- Paid Database
- Investor Presentations

Step 4 - Data Triangulation
Involves using different sources of information in order to increase the validity of a study
These sources are likely to be stakeholders in a program - participants, other researchers, program staff, other community members, and so on.
Then we put all data in single framework & apply various statistical tools to find out the dynamic on the market.
During the analysis stage, feedback from the stakeholder groups would be compared to determine areas of agreement as well as areas of divergence