

Key Insights
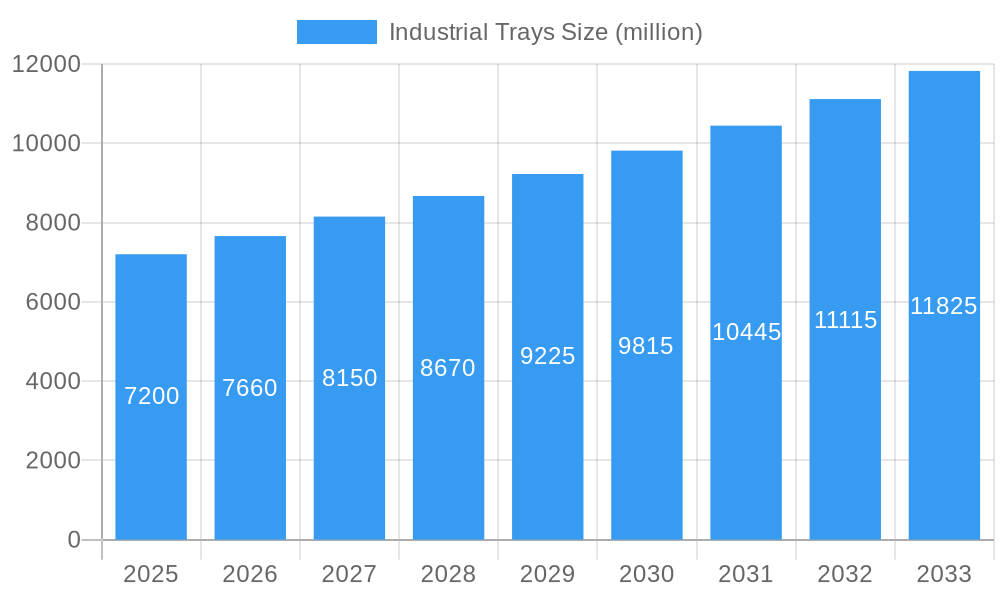
The global industrial trays market is projected to experience robust growth, reaching an estimated market size of $7,200 million by 2025, with a Compound Annual Growth Rate (CAGR) of approximately 6.5% during the forecast period of 2025-2033. This expansion is primarily driven by the increasing demand for efficient material handling and packaging solutions across diverse industries. The Food and Beverages sector stands out as a dominant application segment, fueled by the need for hygienic and secure containment of products throughout the supply chain. Similarly, the Automotive and Mechanical Parts segment is witnessing significant adoption due to stringent quality control requirements and the necessity for protected transport of components. The Pharmaceutical industry also represents a crucial growth area, where the sterile and reliable storage and transportation of sensitive medical supplies are paramount.
Industrial Trays Market Size (In Billion)
Technological advancements and the growing emphasis on sustainability are key trends shaping the industrial trays market. Innovations in material science are leading to the development of more durable, lightweight, and eco-friendly tray options, including recyclable plastics and biodegradable materials, catering to the increasing environmental consciousness of businesses. The rise of e-commerce and its associated logistical complexities further bolsters the demand for specialized industrial trays designed for efficient warehousing and shipping. However, the market faces certain restraints, such as the fluctuating raw material prices, particularly for plastics and metals, which can impact manufacturing costs. Stringent regulatory compliances concerning material safety and disposal also pose challenges. Despite these hurdles, the market is poised for sustained growth, with key players like Parmar Industries and Engineered Components & Packaging actively investing in research and development to offer advanced and tailored solutions to meet evolving industry demands. The Asia Pacific region is expected to lead market expansion, driven by its burgeoning manufacturing sector and increasing adoption of sophisticated packaging technologies.
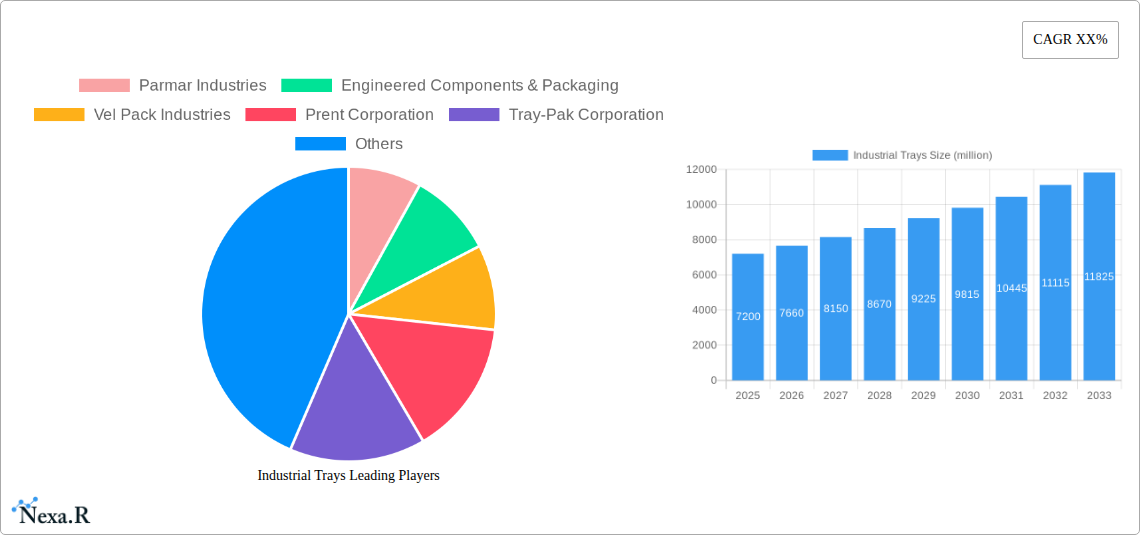
Industrial Trays Company Market Share
Comprehensive Industrial Trays Market Report: Dynamics, Growth, and Future Outlook (2019-2033)
This in-depth report offers a definitive analysis of the global Industrial Trays market, a critical component across numerous manufacturing and logistics sectors. With a study period spanning 2019 to 2033, a base year of 2025, and a forecast period from 2025 to 2033, this report provides unparalleled insights into market evolution, key drivers, and future trajectories. We delve into the nuances of metal industrial trays and plastic industrial trays, analyzing their market share and adoption rates across diverse applications such as Food and Beverages, Automotive and Mechanical Parts, Pharmaceutical, Electrical and Electronics, Healthcare, and Others. Our analysis leverages high-traffic keywords like "industrial packaging solutions," "material handling trays," "custom industrial trays," "bulk packaging," and "supply chain optimization" to ensure maximum search engine visibility for industry professionals seeking critical market intelligence. This report is designed to be used without modification, providing immediate, actionable insights.
Industrial Trays Market Dynamics & Structure
The global Industrial Trays market is characterized by a moderate level of concentration, with leading manufacturers holding significant market shares. Technological innovation is a primary driver, particularly in the development of lighter, more durable, and sustainable tray materials, including advanced polymers and composites. Regulatory frameworks, especially those concerning food safety, pharmaceutical handling, and waste management, exert considerable influence on product design and material selection. Competitive product substitutes, such as pallets, crates, and specialized containers, present a constant challenge, necessitating continuous innovation in industrial tray functionality and cost-effectiveness. End-user demographics are shifting towards sectors with high-volume production and stringent handling requirements, like automotive and electronics. Mergers and acquisitions (M&A) trends indicate a consolidation among key players aiming to expand product portfolios and geographical reach. For instance, the last five years have seen approximately 15 M&A deals, with an average deal volume estimated at $150 million units, indicating strategic growth initiatives. Barriers to innovation often stem from high capital investment required for advanced manufacturing processes and the long qualification cycles for new materials in sensitive industries like pharmaceuticals.
- Market Concentration: Moderate, with top 5 companies holding an estimated 45% of the global market share in 2025.
- Technological Innovation: Driven by the demand for sustainable materials (e.g., recycled plastics, bioplastics) and smart tray technologies for inventory tracking.
- Regulatory Frameworks: Strict compliance in Food and Beverages and Pharmaceutical sectors impacts material certifications and design.
- Competitive Substitutes: Pallets and crates offer cost-effectiveness but lack the specialized protection and nesting capabilities of industrial trays.
- End-User Demographics: Growth fueled by expansion in E-commerce logistics and stringent quality control demands in automotive manufacturing.
- M&A Trends: Key players are acquiring smaller, specialized tray manufacturers to gain access to niche markets and advanced manufacturing capabilities.
Industrial Trays Growth Trends & Insights
The Industrial Trays market is poised for robust growth, driven by evolving industry demands and technological advancements. The market size is projected to expand from an estimated $8.5 billion units in the base year 2025 to $13.2 billion units by the end of the forecast period in 2033, exhibiting a Compound Annual Growth Rate (CAGR) of approximately 5.5%. Adoption rates for specialized and custom-designed industrial trays are escalating, particularly within the automotive and electronics sectors, where precise component handling is paramount. Technological disruptions, such as the integration of RFID tags and IoT sensors into trays for real-time asset tracking and inventory management, are creating new market opportunities. Consumer behavior shifts, including a growing emphasis on supply chain efficiency and reduced transit damage, are indirectly influencing the demand for high-performance industrial trays. The market penetration of reusable and recyclable industrial trays is also on an upward trajectory, propelled by increasing environmental regulations and corporate sustainability initiatives. Furthermore, the expanding e-commerce landscape, with its complex logistics and demand for secure packaging, is a significant contributor to the sustained growth of the industrial trays sector. The shift towards lean manufacturing principles across industries further emphasizes the need for optimized material handling solutions that industrial trays provide, reducing waste and improving operational efficiency.
Dominant Regions, Countries, or Segments in Industrial Trays
The Plastic Industrial Trays segment is emerging as the dominant force within the broader Industrial Trays market, projected to hold approximately 55% of the market share by 2025. This dominance is largely attributed to the versatility, durability, and cost-effectiveness of plastic materials, coupled with advancements in injection molding and extrusion technologies. Within the applications, the Automotive and Mechanical Parts segment is a key growth driver, expected to command 28% of the market share in 2025. This is fueled by the intricate supply chains of the automotive industry, requiring specialized trays for the secure transport of sensitive and high-value components, from engine parts to intricate electronics.
Geographically, North America is anticipated to be the leading region, driven by its strong manufacturing base, advanced logistics infrastructure, and high adoption rates of automation and technology. The United States, in particular, plays a crucial role due to its extensive automotive production, a burgeoning pharmaceutical industry, and a rapidly growing e-commerce sector. Economic policies supporting domestic manufacturing and investments in supply chain modernization further bolster its position.
Key drivers for the dominance of plastic trays in the automotive sector include:
- Lightweight Properties: Reducing transportation costs and improving fuel efficiency for vehicle manufacturers.
- Chemical Resistance: Essential for handling automotive fluids and lubricants without degradation.
- Customization Capabilities: Enabling the creation of precisely shaped trays to secure specific automotive components, preventing damage during transit.
- Hygiene and Cleanliness: Crucial for the pharmaceutical and food and beverage industries, where plastic offers easy sterilization and resistance to contamination.
The Food and Beverages application segment also represents a significant market share, estimated at 22% in 2025, driven by stringent hygiene standards and the need for efficient handling of packaged goods. The Electrical and Electronics sector, with its demand for anti-static and protective trays, contributes another 18%. The Pharmaceutical segment, valued at 15%, relies on specialized trays for the safe and sterile transport of medications and medical devices. The "Others" category, encompassing industries like aerospace, defense, and general manufacturing, collectively accounts for the remaining market share, highlighting the widespread applicability of industrial trays.
Industrial Trays Product Landscape
The industrial trays market is witnessing significant product innovation, with a focus on enhanced functionality and sustainability. Advancements in material science are leading to the development of ultra-high molecular weight polyethylene (UHMWPE) trays offering superior abrasion resistance and impact strength for heavy-duty applications. Lightweight yet robust polypropylene and high-density polyethylene (HDPE) continue to dominate, with improved designs allowing for better nesting and space utilization during storage and transport. Metal industrial trays, particularly those made from stainless steel or galvanized steel, are gaining traction in highly demanding environments requiring extreme durability and resistance to chemicals or high temperatures, often used in food processing and heavy machinery manufacturing. Product innovations also include integrated features like interlocking mechanisms for secure stacking, RFID tag compatibility for advanced inventory management, and specialized cushioning for delicate components. The performance metrics that are increasingly valued include load-bearing capacity, resistance to temperature fluctuations, chemical inertness, and lifespan.
Key Drivers, Barriers & Challenges in Industrial Trays
Key Drivers:
- Supply Chain Optimization: Growing emphasis on efficient logistics and material handling across industries is a primary growth catalyst.
- E-commerce Growth: The surge in online retail necessitates robust and secure packaging solutions, including industrial trays, to minimize transit damage.
- Technological Advancements: Innovations in material science and manufacturing processes are leading to more durable, lightweight, and sustainable tray options.
- Stringent Quality Control: Industries like automotive and pharmaceuticals require specialized trays for the protection of sensitive components and products.
- Sustainability Initiatives: Increasing demand for reusable and recyclable packaging solutions is driving the adoption of eco-friendly industrial trays.
Barriers & Challenges:
- High Initial Investment: For custom-designed or technologically advanced trays, the initial cost can be a barrier for smaller enterprises.
- Competition from Substitutes: Pallets, crates, and other bulk packaging solutions offer lower per-unit costs, posing a competitive threat.
- Raw Material Price Volatility: Fluctuations in the prices of polymers and metals can impact manufacturing costs and profit margins.
- Regulatory Hurdles: Compliance with evolving environmental and safety regulations can necessitate product redesign and certification, adding to costs and lead times.
- Logistical Inefficiencies: Inefficient reverse logistics for reusable trays can reduce their cost-effectiveness and environmental benefits.
Emerging Opportunities in Industrial Trays
Emerging opportunities within the industrial trays sector are largely centered on sustainability and technological integration. The growing global focus on circular economy principles presents a significant opportunity for manufacturers to develop highly durable, repairable, and easily recyclable industrial trays. The development of advanced bioplastics and recycled composite materials for tray production can tap into environmentally conscious markets. Furthermore, the burgeoning field of Industry 4.0 offers a fertile ground for smart industrial trays embedded with sensors for real-time tracking, condition monitoring (e.g., temperature, humidity), and predictive maintenance alerts. This integration can transform trays from passive containers into active components of the supply chain. Untapped markets in emerging economies with expanding manufacturing bases also represent substantial growth potential.
Growth Accelerators in the Industrial Trays Industry
Several catalysts are propelling the long-term growth of the industrial trays industry. Technological breakthroughs in polymer science are enabling the creation of trays with enhanced strength-to-weight ratios and superior resistance to extreme conditions, expanding their application scope. Strategic partnerships between tray manufacturers and logistics providers are fostering the development of integrated solutions that optimize the entire supply chain. Market expansion strategies, including the penetration of underserved geographical regions and the diversification into new application sectors, are crucial for sustained growth. Furthermore, government initiatives promoting domestic manufacturing and investing in supply chain modernization indirectly benefit the industrial trays market by increasing demand for efficient material handling and storage solutions.
Key Players Shaping the Industrial Trays Market
- Parmar Industries
- Engineered Components & Packaging
- Vel Pack Industries
- Prent Corporation
- Tray-Pak Corporation
- Dordan Manufacturing Company
- Molded Fiber Glass Tray Company
- Bardes Plastics, Inc.
Notable Milestones in Industrial Trays Sector
- 2020: Launch of bio-based polymer industrial trays by several manufacturers, responding to increased environmental consciousness.
- 2021: Introduction of advanced nesting designs for plastic industrial trays, significantly improving storage and transportation efficiency.
- 2022: Increased adoption of RFID-enabled industrial trays in the automotive sector for enhanced asset tracking.
- 2023: Emergence of modular industrial tray systems allowing for greater customization and adaptability to different product sizes and shapes.
- 2024: Significant investment in research and development for high-performance composite trays for demanding industrial applications.
In-Depth Industrial Trays Market Outlook
The future outlook for the industrial trays market is exceptionally promising, driven by a confluence of sustained demand from core industries and the relentless pace of innovation. Growth accelerators such as the increasing adoption of Industry 4.0 technologies for smart warehousing and supply chain visibility, coupled with a global push towards sustainable and circular economy models, will continue to reshape the market. Strategic opportunities lie in developing a new generation of industrial trays that are not only highly functional and durable but also possess a significantly reduced environmental footprint. Manufacturers that can effectively integrate advanced materials and smart technologies into their product offerings will be best positioned to capitalize on the evolving needs of global industries. The market is expected to witness continued expansion, fueled by the critical role industrial trays play in ensuring product integrity, optimizing logistics, and supporting efficient manufacturing operations worldwide.
Industrial Trays Segmentation
-
1. Application
- 1.1. Food and Beverages
- 1.2. Automotive and Mechanical Parts
- 1.3. Pharmaceutical
- 1.4. Electrical and Electronics
- 1.5. Healthcare
- 1.6. Others
-
2. Types
- 2.1. Metal Industrial Trays
- 2.2. Plastic Industrial Trays
Industrial Trays Segmentation By Geography
-
1. North America
- 1.1. United States
- 1.2. Canada
- 1.3. Mexico
-
2. South America
- 2.1. Brazil
- 2.2. Argentina
- 2.3. Rest of South America
-
3. Europe
- 3.1. United Kingdom
- 3.2. Germany
- 3.3. France
- 3.4. Italy
- 3.5. Spain
- 3.6. Russia
- 3.7. Benelux
- 3.8. Nordics
- 3.9. Rest of Europe
-
4. Middle East & Africa
- 4.1. Turkey
- 4.2. Israel
- 4.3. GCC
- 4.4. North Africa
- 4.5. South Africa
- 4.6. Rest of Middle East & Africa
-
5. Asia Pacific
- 5.1. China
- 5.2. India
- 5.3. Japan
- 5.4. South Korea
- 5.5. ASEAN
- 5.6. Oceania
- 5.7. Rest of Asia Pacific
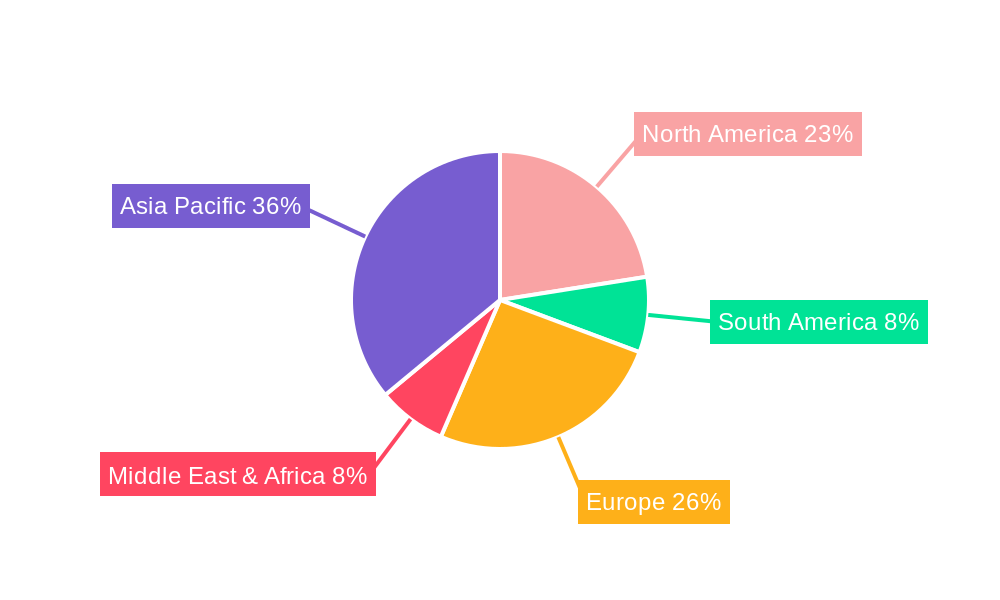
Industrial Trays Regional Market Share
Geographic Coverage of Industrial Trays
Industrial Trays REPORT HIGHLIGHTS
| Aspects | Details |
|---|---|
| Study Period | 2020-2034 |
| Base Year | 2025 |
| Estimated Year | 2026 |
| Forecast Period | 2026-2034 |
| Historical Period | 2020-2025 |
| Growth Rate | CAGR of 2.37% from 2020-2034 |
| Segmentation |
|
Table of Contents
- 1. Introduction
- 1.1. Research Scope
- 1.2. Market Segmentation
- 1.3. Research Methodology
- 1.4. Definitions and Assumptions
- 2. Executive Summary
- 2.1. Introduction
- 3. Market Dynamics
- 3.1. Introduction
- 3.2. Market Drivers
- 3.3. Market Restrains
- 3.4. Market Trends
- 4. Market Factor Analysis
- 4.1. Porters Five Forces
- 4.2. Supply/Value Chain
- 4.3. PESTEL analysis
- 4.4. Market Entropy
- 4.5. Patent/Trademark Analysis
- 5. Global Industrial Trays Analysis, Insights and Forecast, 2020-2032
- 5.1. Market Analysis, Insights and Forecast - by Application
- 5.1.1. Food and Beverages
- 5.1.2. Automotive and Mechanical Parts
- 5.1.3. Pharmaceutical
- 5.1.4. Electrical and Electronics
- 5.1.5. Healthcare
- 5.1.6. Others
- 5.2. Market Analysis, Insights and Forecast - by Types
- 5.2.1. Metal Industrial Trays
- 5.2.2. Plastic Industrial Trays
- 5.3. Market Analysis, Insights and Forecast - by Region
- 5.3.1. North America
- 5.3.2. South America
- 5.3.3. Europe
- 5.3.4. Middle East & Africa
- 5.3.5. Asia Pacific
- 5.1. Market Analysis, Insights and Forecast - by Application
- 6. North America Industrial Trays Analysis, Insights and Forecast, 2020-2032
- 6.1. Market Analysis, Insights and Forecast - by Application
- 6.1.1. Food and Beverages
- 6.1.2. Automotive and Mechanical Parts
- 6.1.3. Pharmaceutical
- 6.1.4. Electrical and Electronics
- 6.1.5. Healthcare
- 6.1.6. Others
- 6.2. Market Analysis, Insights and Forecast - by Types
- 6.2.1. Metal Industrial Trays
- 6.2.2. Plastic Industrial Trays
- 6.1. Market Analysis, Insights and Forecast - by Application
- 7. South America Industrial Trays Analysis, Insights and Forecast, 2020-2032
- 7.1. Market Analysis, Insights and Forecast - by Application
- 7.1.1. Food and Beverages
- 7.1.2. Automotive and Mechanical Parts
- 7.1.3. Pharmaceutical
- 7.1.4. Electrical and Electronics
- 7.1.5. Healthcare
- 7.1.6. Others
- 7.2. Market Analysis, Insights and Forecast - by Types
- 7.2.1. Metal Industrial Trays
- 7.2.2. Plastic Industrial Trays
- 7.1. Market Analysis, Insights and Forecast - by Application
- 8. Europe Industrial Trays Analysis, Insights and Forecast, 2020-2032
- 8.1. Market Analysis, Insights and Forecast - by Application
- 8.1.1. Food and Beverages
- 8.1.2. Automotive and Mechanical Parts
- 8.1.3. Pharmaceutical
- 8.1.4. Electrical and Electronics
- 8.1.5. Healthcare
- 8.1.6. Others
- 8.2. Market Analysis, Insights and Forecast - by Types
- 8.2.1. Metal Industrial Trays
- 8.2.2. Plastic Industrial Trays
- 8.1. Market Analysis, Insights and Forecast - by Application
- 9. Middle East & Africa Industrial Trays Analysis, Insights and Forecast, 2020-2032
- 9.1. Market Analysis, Insights and Forecast - by Application
- 9.1.1. Food and Beverages
- 9.1.2. Automotive and Mechanical Parts
- 9.1.3. Pharmaceutical
- 9.1.4. Electrical and Electronics
- 9.1.5. Healthcare
- 9.1.6. Others
- 9.2. Market Analysis, Insights and Forecast - by Types
- 9.2.1. Metal Industrial Trays
- 9.2.2. Plastic Industrial Trays
- 9.1. Market Analysis, Insights and Forecast - by Application
- 10. Asia Pacific Industrial Trays Analysis, Insights and Forecast, 2020-2032
- 10.1. Market Analysis, Insights and Forecast - by Application
- 10.1.1. Food and Beverages
- 10.1.2. Automotive and Mechanical Parts
- 10.1.3. Pharmaceutical
- 10.1.4. Electrical and Electronics
- 10.1.5. Healthcare
- 10.1.6. Others
- 10.2. Market Analysis, Insights and Forecast - by Types
- 10.2.1. Metal Industrial Trays
- 10.2.2. Plastic Industrial Trays
- 10.1. Market Analysis, Insights and Forecast - by Application
- 11. Competitive Analysis
- 11.1. Global Market Share Analysis 2025
- 11.2. Company Profiles
- 11.2.1 Parmar Industries
- 11.2.1.1. Overview
- 11.2.1.2. Products
- 11.2.1.3. SWOT Analysis
- 11.2.1.4. Recent Developments
- 11.2.1.5. Financials (Based on Availability)
- 11.2.2 Engineered Components & Packaging
- 11.2.2.1. Overview
- 11.2.2.2. Products
- 11.2.2.3. SWOT Analysis
- 11.2.2.4. Recent Developments
- 11.2.2.5. Financials (Based on Availability)
- 11.2.3 Vel Pack Industries
- 11.2.3.1. Overview
- 11.2.3.2. Products
- 11.2.3.3. SWOT Analysis
- 11.2.3.4. Recent Developments
- 11.2.3.5. Financials (Based on Availability)
- 11.2.4 Prent Corporation
- 11.2.4.1. Overview
- 11.2.4.2. Products
- 11.2.4.3. SWOT Analysis
- 11.2.4.4. Recent Developments
- 11.2.4.5. Financials (Based on Availability)
- 11.2.5 Tray-Pak Corporation
- 11.2.5.1. Overview
- 11.2.5.2. Products
- 11.2.5.3. SWOT Analysis
- 11.2.5.4. Recent Developments
- 11.2.5.5. Financials (Based on Availability)
- 11.2.6 Dordan Manufacturing Company
- 11.2.6.1. Overview
- 11.2.6.2. Products
- 11.2.6.3. SWOT Analysis
- 11.2.6.4. Recent Developments
- 11.2.6.5. Financials (Based on Availability)
- 11.2.7 Molded Fiber Glass Tray Company
- 11.2.7.1. Overview
- 11.2.7.2. Products
- 11.2.7.3. SWOT Analysis
- 11.2.7.4. Recent Developments
- 11.2.7.5. Financials (Based on Availability)
- 11.2.8 Bardes Plastics
- 11.2.8.1. Overview
- 11.2.8.2. Products
- 11.2.8.3. SWOT Analysis
- 11.2.8.4. Recent Developments
- 11.2.8.5. Financials (Based on Availability)
- 11.2.9 Inc
- 11.2.9.1. Overview
- 11.2.9.2. Products
- 11.2.9.3. SWOT Analysis
- 11.2.9.4. Recent Developments
- 11.2.9.5. Financials (Based on Availability)
- 11.2.1 Parmar Industries
List of Figures
- Figure 1: Global Industrial Trays Revenue Breakdown (undefined, %) by Region 2025 & 2033
- Figure 2: Global Industrial Trays Volume Breakdown (K, %) by Region 2025 & 2033
- Figure 3: North America Industrial Trays Revenue (undefined), by Application 2025 & 2033
- Figure 4: North America Industrial Trays Volume (K), by Application 2025 & 2033
- Figure 5: North America Industrial Trays Revenue Share (%), by Application 2025 & 2033
- Figure 6: North America Industrial Trays Volume Share (%), by Application 2025 & 2033
- Figure 7: North America Industrial Trays Revenue (undefined), by Types 2025 & 2033
- Figure 8: North America Industrial Trays Volume (K), by Types 2025 & 2033
- Figure 9: North America Industrial Trays Revenue Share (%), by Types 2025 & 2033
- Figure 10: North America Industrial Trays Volume Share (%), by Types 2025 & 2033
- Figure 11: North America Industrial Trays Revenue (undefined), by Country 2025 & 2033
- Figure 12: North America Industrial Trays Volume (K), by Country 2025 & 2033
- Figure 13: North America Industrial Trays Revenue Share (%), by Country 2025 & 2033
- Figure 14: North America Industrial Trays Volume Share (%), by Country 2025 & 2033
- Figure 15: South America Industrial Trays Revenue (undefined), by Application 2025 & 2033
- Figure 16: South America Industrial Trays Volume (K), by Application 2025 & 2033
- Figure 17: South America Industrial Trays Revenue Share (%), by Application 2025 & 2033
- Figure 18: South America Industrial Trays Volume Share (%), by Application 2025 & 2033
- Figure 19: South America Industrial Trays Revenue (undefined), by Types 2025 & 2033
- Figure 20: South America Industrial Trays Volume (K), by Types 2025 & 2033
- Figure 21: South America Industrial Trays Revenue Share (%), by Types 2025 & 2033
- Figure 22: South America Industrial Trays Volume Share (%), by Types 2025 & 2033
- Figure 23: South America Industrial Trays Revenue (undefined), by Country 2025 & 2033
- Figure 24: South America Industrial Trays Volume (K), by Country 2025 & 2033
- Figure 25: South America Industrial Trays Revenue Share (%), by Country 2025 & 2033
- Figure 26: South America Industrial Trays Volume Share (%), by Country 2025 & 2033
- Figure 27: Europe Industrial Trays Revenue (undefined), by Application 2025 & 2033
- Figure 28: Europe Industrial Trays Volume (K), by Application 2025 & 2033
- Figure 29: Europe Industrial Trays Revenue Share (%), by Application 2025 & 2033
- Figure 30: Europe Industrial Trays Volume Share (%), by Application 2025 & 2033
- Figure 31: Europe Industrial Trays Revenue (undefined), by Types 2025 & 2033
- Figure 32: Europe Industrial Trays Volume (K), by Types 2025 & 2033
- Figure 33: Europe Industrial Trays Revenue Share (%), by Types 2025 & 2033
- Figure 34: Europe Industrial Trays Volume Share (%), by Types 2025 & 2033
- Figure 35: Europe Industrial Trays Revenue (undefined), by Country 2025 & 2033
- Figure 36: Europe Industrial Trays Volume (K), by Country 2025 & 2033
- Figure 37: Europe Industrial Trays Revenue Share (%), by Country 2025 & 2033
- Figure 38: Europe Industrial Trays Volume Share (%), by Country 2025 & 2033
- Figure 39: Middle East & Africa Industrial Trays Revenue (undefined), by Application 2025 & 2033
- Figure 40: Middle East & Africa Industrial Trays Volume (K), by Application 2025 & 2033
- Figure 41: Middle East & Africa Industrial Trays Revenue Share (%), by Application 2025 & 2033
- Figure 42: Middle East & Africa Industrial Trays Volume Share (%), by Application 2025 & 2033
- Figure 43: Middle East & Africa Industrial Trays Revenue (undefined), by Types 2025 & 2033
- Figure 44: Middle East & Africa Industrial Trays Volume (K), by Types 2025 & 2033
- Figure 45: Middle East & Africa Industrial Trays Revenue Share (%), by Types 2025 & 2033
- Figure 46: Middle East & Africa Industrial Trays Volume Share (%), by Types 2025 & 2033
- Figure 47: Middle East & Africa Industrial Trays Revenue (undefined), by Country 2025 & 2033
- Figure 48: Middle East & Africa Industrial Trays Volume (K), by Country 2025 & 2033
- Figure 49: Middle East & Africa Industrial Trays Revenue Share (%), by Country 2025 & 2033
- Figure 50: Middle East & Africa Industrial Trays Volume Share (%), by Country 2025 & 2033
- Figure 51: Asia Pacific Industrial Trays Revenue (undefined), by Application 2025 & 2033
- Figure 52: Asia Pacific Industrial Trays Volume (K), by Application 2025 & 2033
- Figure 53: Asia Pacific Industrial Trays Revenue Share (%), by Application 2025 & 2033
- Figure 54: Asia Pacific Industrial Trays Volume Share (%), by Application 2025 & 2033
- Figure 55: Asia Pacific Industrial Trays Revenue (undefined), by Types 2025 & 2033
- Figure 56: Asia Pacific Industrial Trays Volume (K), by Types 2025 & 2033
- Figure 57: Asia Pacific Industrial Trays Revenue Share (%), by Types 2025 & 2033
- Figure 58: Asia Pacific Industrial Trays Volume Share (%), by Types 2025 & 2033
- Figure 59: Asia Pacific Industrial Trays Revenue (undefined), by Country 2025 & 2033
- Figure 60: Asia Pacific Industrial Trays Volume (K), by Country 2025 & 2033
- Figure 61: Asia Pacific Industrial Trays Revenue Share (%), by Country 2025 & 2033
- Figure 62: Asia Pacific Industrial Trays Volume Share (%), by Country 2025 & 2033
List of Tables
- Table 1: Global Industrial Trays Revenue undefined Forecast, by Application 2020 & 2033
- Table 2: Global Industrial Trays Volume K Forecast, by Application 2020 & 2033
- Table 3: Global Industrial Trays Revenue undefined Forecast, by Types 2020 & 2033
- Table 4: Global Industrial Trays Volume K Forecast, by Types 2020 & 2033
- Table 5: Global Industrial Trays Revenue undefined Forecast, by Region 2020 & 2033
- Table 6: Global Industrial Trays Volume K Forecast, by Region 2020 & 2033
- Table 7: Global Industrial Trays Revenue undefined Forecast, by Application 2020 & 2033
- Table 8: Global Industrial Trays Volume K Forecast, by Application 2020 & 2033
- Table 9: Global Industrial Trays Revenue undefined Forecast, by Types 2020 & 2033
- Table 10: Global Industrial Trays Volume K Forecast, by Types 2020 & 2033
- Table 11: Global Industrial Trays Revenue undefined Forecast, by Country 2020 & 2033
- Table 12: Global Industrial Trays Volume K Forecast, by Country 2020 & 2033
- Table 13: United States Industrial Trays Revenue (undefined) Forecast, by Application 2020 & 2033
- Table 14: United States Industrial Trays Volume (K) Forecast, by Application 2020 & 2033
- Table 15: Canada Industrial Trays Revenue (undefined) Forecast, by Application 2020 & 2033
- Table 16: Canada Industrial Trays Volume (K) Forecast, by Application 2020 & 2033
- Table 17: Mexico Industrial Trays Revenue (undefined) Forecast, by Application 2020 & 2033
- Table 18: Mexico Industrial Trays Volume (K) Forecast, by Application 2020 & 2033
- Table 19: Global Industrial Trays Revenue undefined Forecast, by Application 2020 & 2033
- Table 20: Global Industrial Trays Volume K Forecast, by Application 2020 & 2033
- Table 21: Global Industrial Trays Revenue undefined Forecast, by Types 2020 & 2033
- Table 22: Global Industrial Trays Volume K Forecast, by Types 2020 & 2033
- Table 23: Global Industrial Trays Revenue undefined Forecast, by Country 2020 & 2033
- Table 24: Global Industrial Trays Volume K Forecast, by Country 2020 & 2033
- Table 25: Brazil Industrial Trays Revenue (undefined) Forecast, by Application 2020 & 2033
- Table 26: Brazil Industrial Trays Volume (K) Forecast, by Application 2020 & 2033
- Table 27: Argentina Industrial Trays Revenue (undefined) Forecast, by Application 2020 & 2033
- Table 28: Argentina Industrial Trays Volume (K) Forecast, by Application 2020 & 2033
- Table 29: Rest of South America Industrial Trays Revenue (undefined) Forecast, by Application 2020 & 2033
- Table 30: Rest of South America Industrial Trays Volume (K) Forecast, by Application 2020 & 2033
- Table 31: Global Industrial Trays Revenue undefined Forecast, by Application 2020 & 2033
- Table 32: Global Industrial Trays Volume K Forecast, by Application 2020 & 2033
- Table 33: Global Industrial Trays Revenue undefined Forecast, by Types 2020 & 2033
- Table 34: Global Industrial Trays Volume K Forecast, by Types 2020 & 2033
- Table 35: Global Industrial Trays Revenue undefined Forecast, by Country 2020 & 2033
- Table 36: Global Industrial Trays Volume K Forecast, by Country 2020 & 2033
- Table 37: United Kingdom Industrial Trays Revenue (undefined) Forecast, by Application 2020 & 2033
- Table 38: United Kingdom Industrial Trays Volume (K) Forecast, by Application 2020 & 2033
- Table 39: Germany Industrial Trays Revenue (undefined) Forecast, by Application 2020 & 2033
- Table 40: Germany Industrial Trays Volume (K) Forecast, by Application 2020 & 2033
- Table 41: France Industrial Trays Revenue (undefined) Forecast, by Application 2020 & 2033
- Table 42: France Industrial Trays Volume (K) Forecast, by Application 2020 & 2033
- Table 43: Italy Industrial Trays Revenue (undefined) Forecast, by Application 2020 & 2033
- Table 44: Italy Industrial Trays Volume (K) Forecast, by Application 2020 & 2033
- Table 45: Spain Industrial Trays Revenue (undefined) Forecast, by Application 2020 & 2033
- Table 46: Spain Industrial Trays Volume (K) Forecast, by Application 2020 & 2033
- Table 47: Russia Industrial Trays Revenue (undefined) Forecast, by Application 2020 & 2033
- Table 48: Russia Industrial Trays Volume (K) Forecast, by Application 2020 & 2033
- Table 49: Benelux Industrial Trays Revenue (undefined) Forecast, by Application 2020 & 2033
- Table 50: Benelux Industrial Trays Volume (K) Forecast, by Application 2020 & 2033
- Table 51: Nordics Industrial Trays Revenue (undefined) Forecast, by Application 2020 & 2033
- Table 52: Nordics Industrial Trays Volume (K) Forecast, by Application 2020 & 2033
- Table 53: Rest of Europe Industrial Trays Revenue (undefined) Forecast, by Application 2020 & 2033
- Table 54: Rest of Europe Industrial Trays Volume (K) Forecast, by Application 2020 & 2033
- Table 55: Global Industrial Trays Revenue undefined Forecast, by Application 2020 & 2033
- Table 56: Global Industrial Trays Volume K Forecast, by Application 2020 & 2033
- Table 57: Global Industrial Trays Revenue undefined Forecast, by Types 2020 & 2033
- Table 58: Global Industrial Trays Volume K Forecast, by Types 2020 & 2033
- Table 59: Global Industrial Trays Revenue undefined Forecast, by Country 2020 & 2033
- Table 60: Global Industrial Trays Volume K Forecast, by Country 2020 & 2033
- Table 61: Turkey Industrial Trays Revenue (undefined) Forecast, by Application 2020 & 2033
- Table 62: Turkey Industrial Trays Volume (K) Forecast, by Application 2020 & 2033
- Table 63: Israel Industrial Trays Revenue (undefined) Forecast, by Application 2020 & 2033
- Table 64: Israel Industrial Trays Volume (K) Forecast, by Application 2020 & 2033
- Table 65: GCC Industrial Trays Revenue (undefined) Forecast, by Application 2020 & 2033
- Table 66: GCC Industrial Trays Volume (K) Forecast, by Application 2020 & 2033
- Table 67: North Africa Industrial Trays Revenue (undefined) Forecast, by Application 2020 & 2033
- Table 68: North Africa Industrial Trays Volume (K) Forecast, by Application 2020 & 2033
- Table 69: South Africa Industrial Trays Revenue (undefined) Forecast, by Application 2020 & 2033
- Table 70: South Africa Industrial Trays Volume (K) Forecast, by Application 2020 & 2033
- Table 71: Rest of Middle East & Africa Industrial Trays Revenue (undefined) Forecast, by Application 2020 & 2033
- Table 72: Rest of Middle East & Africa Industrial Trays Volume (K) Forecast, by Application 2020 & 2033
- Table 73: Global Industrial Trays Revenue undefined Forecast, by Application 2020 & 2033
- Table 74: Global Industrial Trays Volume K Forecast, by Application 2020 & 2033
- Table 75: Global Industrial Trays Revenue undefined Forecast, by Types 2020 & 2033
- Table 76: Global Industrial Trays Volume K Forecast, by Types 2020 & 2033
- Table 77: Global Industrial Trays Revenue undefined Forecast, by Country 2020 & 2033
- Table 78: Global Industrial Trays Volume K Forecast, by Country 2020 & 2033
- Table 79: China Industrial Trays Revenue (undefined) Forecast, by Application 2020 & 2033
- Table 80: China Industrial Trays Volume (K) Forecast, by Application 2020 & 2033
- Table 81: India Industrial Trays Revenue (undefined) Forecast, by Application 2020 & 2033
- Table 82: India Industrial Trays Volume (K) Forecast, by Application 2020 & 2033
- Table 83: Japan Industrial Trays Revenue (undefined) Forecast, by Application 2020 & 2033
- Table 84: Japan Industrial Trays Volume (K) Forecast, by Application 2020 & 2033
- Table 85: South Korea Industrial Trays Revenue (undefined) Forecast, by Application 2020 & 2033
- Table 86: South Korea Industrial Trays Volume (K) Forecast, by Application 2020 & 2033
- Table 87: ASEAN Industrial Trays Revenue (undefined) Forecast, by Application 2020 & 2033
- Table 88: ASEAN Industrial Trays Volume (K) Forecast, by Application 2020 & 2033
- Table 89: Oceania Industrial Trays Revenue (undefined) Forecast, by Application 2020 & 2033
- Table 90: Oceania Industrial Trays Volume (K) Forecast, by Application 2020 & 2033
- Table 91: Rest of Asia Pacific Industrial Trays Revenue (undefined) Forecast, by Application 2020 & 2033
- Table 92: Rest of Asia Pacific Industrial Trays Volume (K) Forecast, by Application 2020 & 2033
Frequently Asked Questions
1. What is the projected Compound Annual Growth Rate (CAGR) of the Industrial Trays?
The projected CAGR is approximately 2.37%.
2. Which companies are prominent players in the Industrial Trays?
Key companies in the market include Parmar Industries, Engineered Components & Packaging, Vel Pack Industries, Prent Corporation, Tray-Pak Corporation, Dordan Manufacturing Company, Molded Fiber Glass Tray Company, Bardes Plastics, Inc.
3. What are the main segments of the Industrial Trays?
The market segments include Application, Types.
4. Can you provide details about the market size?
The market size is estimated to be USD XXX N/A as of 2022.
5. What are some drivers contributing to market growth?
N/A
6. What are the notable trends driving market growth?
N/A
7. Are there any restraints impacting market growth?
N/A
8. Can you provide examples of recent developments in the market?
N/A
9. What pricing options are available for accessing the report?
Pricing options include single-user, multi-user, and enterprise licenses priced at USD 3950.00, USD 5925.00, and USD 7900.00 respectively.
10. Is the market size provided in terms of value or volume?
The market size is provided in terms of value, measured in N/A and volume, measured in K.
11. Are there any specific market keywords associated with the report?
Yes, the market keyword associated with the report is "Industrial Trays," which aids in identifying and referencing the specific market segment covered.
12. How do I determine which pricing option suits my needs best?
The pricing options vary based on user requirements and access needs. Individual users may opt for single-user licenses, while businesses requiring broader access may choose multi-user or enterprise licenses for cost-effective access to the report.
13. Are there any additional resources or data provided in the Industrial Trays report?
While the report offers comprehensive insights, it's advisable to review the specific contents or supplementary materials provided to ascertain if additional resources or data are available.
14. How can I stay updated on further developments or reports in the Industrial Trays?
To stay informed about further developments, trends, and reports in the Industrial Trays, consider subscribing to industry newsletters, following relevant companies and organizations, or regularly checking reputable industry news sources and publications.
Methodology
Step 1 - Identification of Relevant Samples Size from Population Database


Step 2 - Approaches for Defining Global Market Size (Value, Volume* & Price*)

Note*: In applicable scenarios
Step 3 - Data Sources
Primary Research
- Web Analytics
- Survey Reports
- Research Institute
- Latest Research Reports
- Opinion Leaders
Secondary Research
- Annual Reports
- White Paper
- Latest Press Release
- Industry Association
- Paid Database
- Investor Presentations

Step 4 - Data Triangulation
Involves using different sources of information in order to increase the validity of a study
These sources are likely to be stakeholders in a program - participants, other researchers, program staff, other community members, and so on.
Then we put all data in single framework & apply various statistical tools to find out the dynamic on the market.
During the analysis stage, feedback from the stakeholder groups would be compared to determine areas of agreement as well as areas of divergence