

Key Insights
The global market for injectable pharmaceuticals labels is experiencing robust growth, projected to reach an estimated market size of approximately $4,500 million in 2025, with a Compound Annual Growth Rate (CAGR) of around 7.5% through 2033. This expansion is primarily driven by the increasing demand for injectable drug formulations, a surge in biopharmaceutical research and development, and the growing prevalence of chronic diseases requiring advanced therapeutic interventions. Furthermore, stringent regulatory requirements for pharmaceutical packaging, emphasizing product integrity and traceability, are compelling manufacturers to adopt high-quality, specialized labeling solutions. The rise of biologics and personalized medicine, often administered via injection, further fuels the need for advanced labeling technologies that can withstand extreme temperatures, chemical exposure, and ensure long-term readability for patient safety and supply chain management.
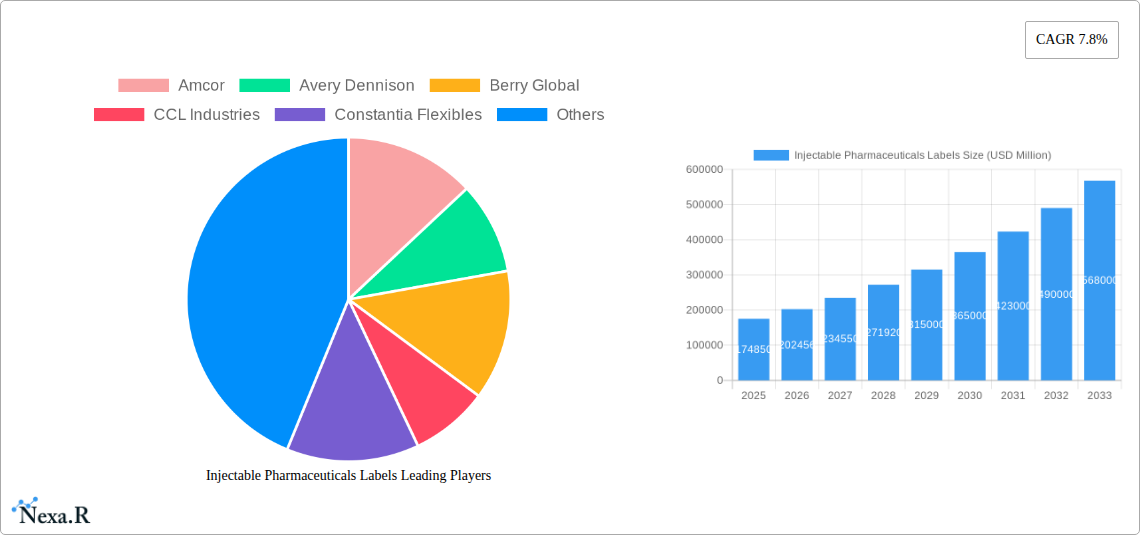
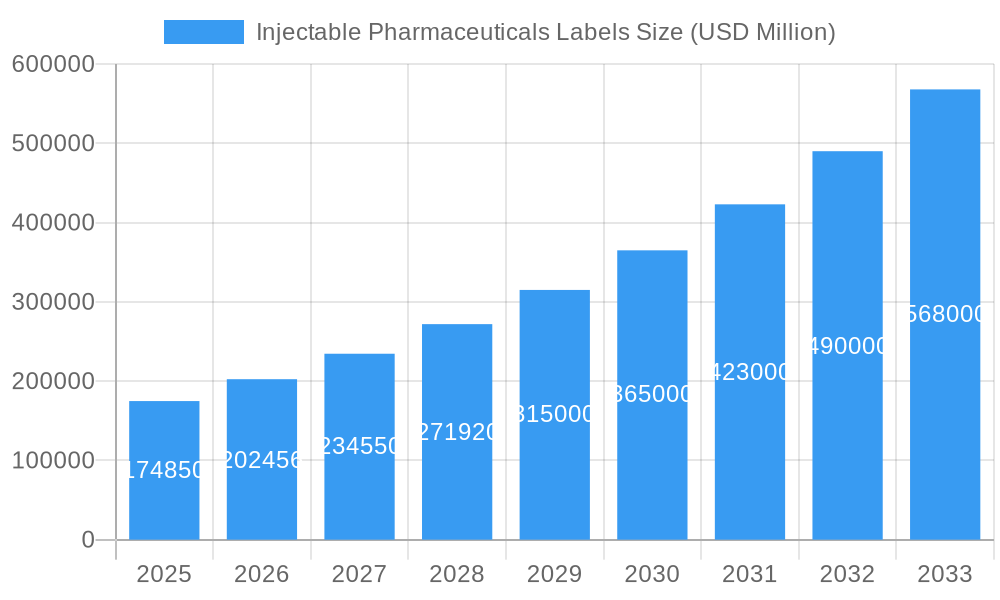
Injectable Pharmaceuticals Labels Market Size (In Billion)
The market is characterized by a dynamic interplay of technological advancements and evolving industry needs. Refrigerated and frozen labels, crucial for maintaining the efficacy of temperature-sensitive biologics and vaccines, represent a significant segment. Key players in the market, including Amcor, Avery Dennison, and UPM Raflatac, are actively investing in innovative solutions such as tamper-evident labels, cold chain monitoring labels, and smart labels with integrated tracking capabilities. While the market is poised for continued expansion, potential restraints include rising raw material costs, particularly for specialized adhesives and films, and the complexity of global supply chains. However, the sustained emphasis on drug safety, the increasing production of complex injectables, and the expanding healthcare infrastructure across emerging economies are expected to outweigh these challenges, ensuring a positive growth trajectory for the injectable pharmaceuticals labels market.
Injectable Pharmaceuticals Labels Company Market Share
This report provides an in-depth analysis of the global Injectable Pharmaceuticals Labels market, a critical component in ensuring the safety, efficacy, and traceability of vital medicinal products. With the increasing demand for biologics, vaccines, and specialized therapeutics, the market for high-performance, compliant, and innovative injectable pharmaceutical labels is poised for significant expansion. This comprehensive study covers market dynamics, growth trends, regional dominance, product landscape, key drivers, challenges, emerging opportunities, and a detailed outlook for the period 2019-2033, with a base year of 2025.
Injectable Pharmaceuticals Labels Market Dynamics & Structure
The Injectable Pharmaceuticals Labels market exhibits a moderate to high level of fragmentation, with a blend of large multinational corporations and specialized regional players. Amcor, Avery Dennison, Berry Global, CCL Industries, Constantia Flexibles, and UPM Raflatac are prominent global entities, leveraging their extensive manufacturing capabilities and distribution networks. Smaller, niche players like Flexo-Graphics, GA International, Hood Packaging, Intertape Polymer Group, Karlville Development, Kiwi Labels, Klckner Pentaplast, and SKK Global contribute by offering specialized solutions and localized support. Technological innovation is a primary driver, fueled by the need for labels that can withstand extreme temperatures (refrigerated and frozen storage), resist chemical interactions with potent drug formulations, and incorporate advanced track-and-trace features like serialization and unique identifiers to combat counterfeiting and enhance supply chain transparency. Stringent regulatory frameworks, particularly from agencies like the FDA and EMA, dictate material compliance, data integrity, and printing standards, acting as both a barrier to entry and a driver for sophisticated labeling solutions. Competitive product substitutes are limited due to the specialized nature of injectable pharmaceuticals, where off-the-shelf solutions are often insufficient. End-user demographics are primarily concentrated within Injectable Pharmaceuticals Manufacturers, Medical Institutions, and Biomedical Laboratory settings, each with distinct labeling requirements. Mergers and acquisitions (M&A) trends are evident as larger companies seek to expand their product portfolios, geographic reach, and technological capabilities. For instance, acquisitions of smaller specialized label converters or material suppliers are observed to integrate advanced printing technologies or gain access to new end-user segments.
- Market Concentration: Moderate to High Fragmentation.
- Technological Innovation Drivers: Temperature resistance, chemical inertness, serialization, tamper-evidence.
- Regulatory Frameworks: FDA, EMA compliance, serialization mandates, Good Manufacturing Practices (GMP).
- Competitive Product Substitutes: Limited due to specialized pharmaceutical requirements.
- End-User Demographics: Injectable Pharmaceuticals Manufacturers (XX% market share), Medical Institutions (XX%), Biomedical Laboratory (XX%), Others (XX%).
- M&A Trends: Strategic acquisitions to expand capabilities and market reach. Deal volume estimated at XX deals annually from 2019-2024.
Injectable Pharmaceuticals Labels Growth Trends & Insights
The global Injectable Pharmaceuticals Labels market is projected to experience robust growth, driven by an escalating demand for injectable drug products and an increasing emphasis on patient safety and supply chain integrity. From a market size of approximately $XX million units in 2019, the market is anticipated to reach $XX million units by the base year 2025, with a projected Compound Annual Growth Rate (CAGR) of XX% during the forecast period 2025–2033. This expansion is intrinsically linked to the burgeoning biopharmaceutical sector, characterized by the development of novel biologics, gene therapies, and complex vaccines, all of which necessitate highly specialized and durable labeling solutions. The adoption rates of advanced labeling technologies, such as direct thermal and thermal transfer labels with enhanced durability and legibility, are steadily increasing. Furthermore, the growing implementation of serialization and track-and-trace systems, mandated by global regulatory bodies to combat counterfeit drugs, is a significant growth catalyst. Consumer behavior shifts, driven by a greater awareness of drug authenticity and the need for accurate product information, are also influencing demand for sophisticated labeling. The COVID-19 pandemic, while disruptive, paradoxically accelerated the need for efficient and reliable vaccine and drug distribution, highlighting the critical role of labeling in maintaining cold chain integrity and providing essential product data. Technological disruptions, including advancements in digital printing and the integration of RFID or NFC tags, are further shaping the market by offering enhanced functionality and data capture capabilities. The market penetration of smart labels, capable of monitoring temperature excursions or providing detailed batch information, is expected to grow significantly.
Dominant Regions, Countries, or Segments in Injectable Pharmaceuticals Labels
The Injectable Pharmaceuticals Manufacturers segment emerges as the dominant force in the global Injectable Pharmaceuticals Labels market, accounting for an estimated XX% of market share in the base year 2025. This dominance stems from the inherent need of pharmaceutical companies to meticulously label their injectable products for identification, dosage, expiry, and critical handling instructions. The rapid growth in the production of biologics, biosimilars, and advanced therapeutics by these manufacturers directly translates into higher demand for specialized labeling solutions. Within the Application segment, Medical Institutions also represent a significant contributor, driven by the need for accurate patient identification and medication management at the point of care, representing approximately XX% of the market. Biomedical Laboratories, while a smaller segment at approximately XX%, play a crucial role in research and development, requiring specialized labels for sample tracking and storage, particularly for specimens subjected to extreme conditions.
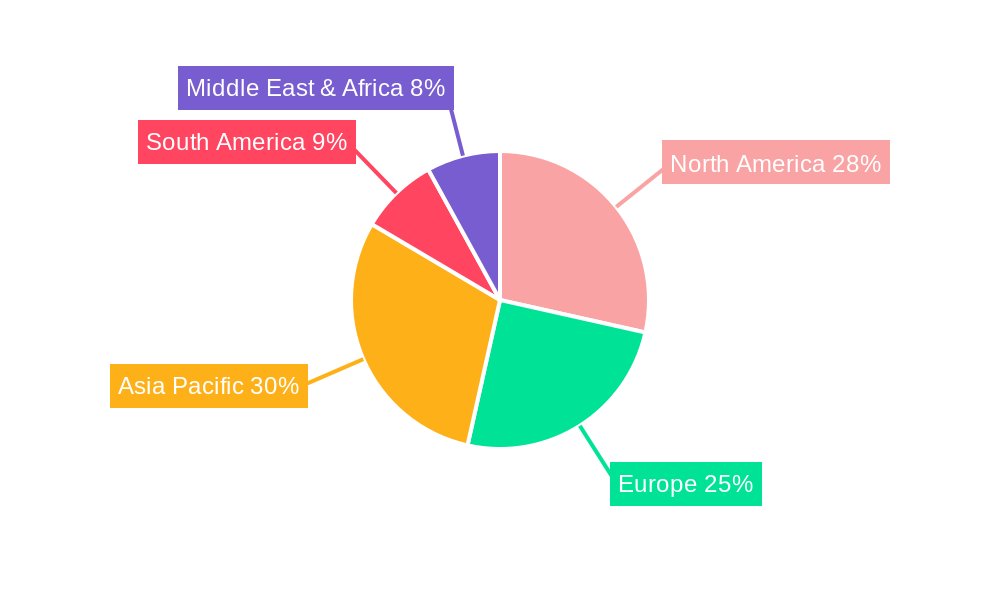
Among the Types of labels, Refrigerated Labels and Frozen Labels are experiencing particularly strong growth, accounting for a combined XX% of the market. This is directly attributable to the increasing prevalence of temperature-sensitive injectable drugs, including vaccines, monoclonal antibodies, and cell and gene therapies, which require strict adherence to cold chain logistics. The economic policies in developed regions, such as North America and Europe, which foster strong pharmaceutical research and manufacturing ecosystems, coupled with robust healthcare infrastructure, further solidify their dominance. For example, the United States, with its extensive biopharmaceutical industry and stringent regulatory environment, is a leading country in terms of demand for these specialized labels. The Asia-Pacific region is also witnessing rapid growth due to the expansion of pharmaceutical manufacturing capabilities and increasing healthcare expenditure.
- Dominant Segment (Application): Injectable Pharmaceuticals Manufacturers (XX% market share in 2025).
- Key Growth Drivers in Dominant Segment: Increased production of biologics, biosimilars, and advanced therapeutics.
- Significant Segment (Application): Medical Institutions (XX% market share in 2025).
- Dominant Label Types: Refrigerated Labels and Frozen Labels (combined XX% market share in 2025).
- Key Drivers for Label Type Dominance: Growing demand for temperature-sensitive injectable drugs and adherence to cold chain logistics.
- Leading Regions/Countries: North America and Europe due to established pharmaceutical industries and stringent regulations.
- Growth Potential: Asia-Pacific region experiencing rapid expansion due to increasing pharmaceutical manufacturing and healthcare spending.
Injectable Pharmaceuticals Labels Product Landscape
The product landscape for injectable pharmaceuticals labels is characterized by advanced materials and printing technologies designed to meet stringent performance and regulatory demands. Innovations focus on labels with exceptional adhesion to glass and plastic vials, resistance to sterilization processes (such as gamma irradiation or ethylene oxide), and the ability to withstand extreme temperature fluctuations (-196°C for cryogenic applications to elevated temperatures during manufacturing). Key product developments include tamper-evident features to prevent unauthorized access, ultra-thin films for aesthetic appeal and minimal bulk, and specialized adhesives that ensure label integrity throughout the product's lifecycle, even when exposed to solvents, alcohols, or bodily fluids. Digital printing technologies are enabling greater customization, shorter run lengths, and the seamless integration of variable data printing for serialization and lot traceability. Performance metrics such as peel strength, tack, shear resistance, and resistance to fogging are critical for end-users.
Key Drivers, Barriers & Challenges in Injectable Pharmaceuticals Labels
The Injectable Pharmaceuticals Labels market is propelled by several key drivers. Technological advancements in label materials and printing capabilities, enabling enhanced durability, chemical resistance, and readability, are paramount. The increasing complexity and temperature sensitivity of novel injectable pharmaceuticals, including biologics and vaccines, necessitate specialized labeling to ensure product integrity and efficacy. Furthermore, stringent global regulatory requirements for serialization, track-and-trace, and patient safety information are driving the demand for compliant and sophisticated labeling solutions to combat counterfeiting and enhance supply chain transparency.
Key challenges and restraints in the market include the high cost of specialized materials and advanced printing technologies, which can impact profit margins for manufacturers and increase costs for pharmaceutical companies. Supply chain disruptions, exacerbated by geopolitical events and material shortages, can lead to production delays and increased lead times. Navigating complex and evolving international regulatory landscapes presents a significant hurdle, requiring continuous investment in compliance and validation. The competitive pressure from established players and the emergence of new entrants offering innovative solutions also pose a challenge, demanding constant product development and differentiation.
- Key Drivers:
- Technological advancements in label materials and printing.
- Growing demand for temperature-sensitive and complex injectable pharmaceuticals.
- Strict global regulatory mandates for serialization and traceability.
- Key Challenges & Restraints:
- High cost of specialized materials and advanced printing technologies.
- Supply chain disruptions and material shortages.
- Complex and evolving international regulatory frameworks.
- Intense competitive landscape.
- Quantifiable impact of regulatory hurdles estimated to add XX% to production costs.
Emerging Opportunities in Injectable Pharmaceuticals Labels
Emerging opportunities in the injectable pharmaceuticals labels sector lie in the development and integration of smart labeling solutions. The increasing adoption of IoT in healthcare is paving the way for labels embedded with RFID or NFC technology, enabling real-time monitoring of temperature, humidity, and location throughout the supply chain. This proactive approach to cold chain management significantly reduces product spoilage and enhances patient safety. Furthermore, the growing demand for personalized medicine and advanced therapies, such as cell and gene therapies, presents a niche opportunity for highly specialized labels designed for unique packaging and stringent handling requirements. Untapped markets in emerging economies, with expanding pharmaceutical manufacturing bases and improving healthcare infrastructure, offer significant growth potential for label suppliers. The development of sustainable and eco-friendly labeling materials, aligning with global environmental initiatives, also presents a growing opportunity for market differentiation.
Growth Accelerators in the Injectable Pharmaceuticals Labels Industry
Several factors are acting as significant growth accelerators for the injectable pharmaceuticals labels industry. The relentless pace of innovation in pharmaceutical research and development, particularly in the areas of biologics, vaccines, and personalized medicine, directly fuels the need for increasingly sophisticated and compliant labeling solutions. Strategic partnerships between label manufacturers and pharmaceutical companies, focused on co-developing tailored labeling solutions for new drug formulations, are becoming more prevalent. Market expansion strategies, including geographical penetration into emerging economies and the acquisition of smaller, innovative companies, are also driving growth. Furthermore, advancements in printing technologies, such as inkjet and UV-curing, are enhancing efficiency, reducing lead times, and enabling greater customization, thereby accelerating product development and market responsiveness. The increasing focus on patient safety and drug authenticity by both regulators and consumers further amplifies the demand for high-quality, traceable labels.
Key Players Shaping the Injectable Pharmaceuticals Labels Market
- Amcor
- Avery Dennison
- Berry Global
- CCL Industries
- Constantia Flexibles
- Flexo-Graphics
- GA International
- Hood Packaging
- Intertape Polymer Group
- Karlville Development
- Kiwi Labels
- Klckner Pentaplast
- SKK Global
- UPM Raflatac
Notable Milestones in Injectable Pharmaceuticals Labels Sector
- 2019: Introduction of advanced tamper-evident label technologies by several key players, enhancing drug security.
- 2020: Increased demand for temperature-resistant labels due to accelerated vaccine development and distribution efforts.
- 2021: Significant investments in serialization printing capabilities by major label manufacturers to meet evolving regulatory requirements.
- 2022: Emergence of eco-friendly and sustainable label material options gaining traction within the pharmaceutical sector.
- 2023: Advancements in digital printing enabling on-demand production of specialized labels for clinical trials and niche therapeutics.
- 2024: Growing integration of QR codes and unique identifiers for enhanced supply chain traceability and product authentication.
In-Depth Injectable Pharmaceuticals Labels Market Outlook
The outlook for the injectable pharmaceuticals labels market remains exceptionally strong, driven by enduring growth accelerators and emerging opportunities. The sustained pipeline of innovative biologic drugs and the global push for enhanced drug safety and traceability will continue to fuel demand for advanced labeling solutions. The ongoing digital transformation within the pharmaceutical industry, including the adoption of IoT and data analytics, will create a fertile ground for smart labels and integrated track-and-trace systems. Strategic collaborations, continuous technological innovation, and expansion into high-growth emerging markets are expected to be key strategies for market leaders. The market is poised for significant expansion as it plays an indispensable role in ensuring the integrity and safe delivery of critical injectable medications worldwide.
Injectable Pharmaceuticals Labels Segmentation
-
1. Application
- 1.1. Biomedical Laboratory
- 1.2. Medical Institutions
- 1.3. Injectable Pharmaceuticals Manufacturers
- 1.4. Others
-
2. Types
- 2.1. Refrigerated Labels
- 2.2. Frozen Labels
Injectable Pharmaceuticals Labels Segmentation By Geography
-
1. North America
- 1.1. United States
- 1.2. Canada
- 1.3. Mexico
-
2. South America
- 2.1. Brazil
- 2.2. Argentina
- 2.3. Rest of South America
-
3. Europe
- 3.1. United Kingdom
- 3.2. Germany
- 3.3. France
- 3.4. Italy
- 3.5. Spain
- 3.6. Russia
- 3.7. Benelux
- 3.8. Nordics
- 3.9. Rest of Europe
-
4. Middle East & Africa
- 4.1. Turkey
- 4.2. Israel
- 4.3. GCC
- 4.4. North Africa
- 4.5. South Africa
- 4.6. Rest of Middle East & Africa
-
5. Asia Pacific
- 5.1. China
- 5.2. India
- 5.3. Japan
- 5.4. South Korea
- 5.5. ASEAN
- 5.6. Oceania
- 5.7. Rest of Asia Pacific
Injectable Pharmaceuticals Labels Regional Market Share
Geographic Coverage of Injectable Pharmaceuticals Labels
Injectable Pharmaceuticals Labels REPORT HIGHLIGHTS
| Aspects | Details |
|---|---|
| Study Period | 2020-2034 |
| Base Year | 2025 |
| Estimated Year | 2026 |
| Forecast Period | 2026-2034 |
| Historical Period | 2020-2025 |
| Growth Rate | CAGR of 6.08% from 2020-2034 |
| Segmentation |
|
Table of Contents
- 1. Introduction
- 1.1. Research Scope
- 1.2. Market Segmentation
- 1.3. Research Methodology
- 1.4. Definitions and Assumptions
- 2. Executive Summary
- 2.1. Introduction
- 3. Market Dynamics
- 3.1. Introduction
- 3.2. Market Drivers
- 3.3. Market Restrains
- 3.4. Market Trends
- 4. Market Factor Analysis
- 4.1. Porters Five Forces
- 4.2. Supply/Value Chain
- 4.3. PESTEL analysis
- 4.4. Market Entropy
- 4.5. Patent/Trademark Analysis
- 5. Global Injectable Pharmaceuticals Labels Analysis, Insights and Forecast, 2020-2032
- 5.1. Market Analysis, Insights and Forecast - by Application
- 5.1.1. Biomedical Laboratory
- 5.1.2. Medical Institutions
- 5.1.3. Injectable Pharmaceuticals Manufacturers
- 5.1.4. Others
- 5.2. Market Analysis, Insights and Forecast - by Types
- 5.2.1. Refrigerated Labels
- 5.2.2. Frozen Labels
- 5.3. Market Analysis, Insights and Forecast - by Region
- 5.3.1. North America
- 5.3.2. South America
- 5.3.3. Europe
- 5.3.4. Middle East & Africa
- 5.3.5. Asia Pacific
- 5.1. Market Analysis, Insights and Forecast - by Application
- 6. North America Injectable Pharmaceuticals Labels Analysis, Insights and Forecast, 2020-2032
- 6.1. Market Analysis, Insights and Forecast - by Application
- 6.1.1. Biomedical Laboratory
- 6.1.2. Medical Institutions
- 6.1.3. Injectable Pharmaceuticals Manufacturers
- 6.1.4. Others
- 6.2. Market Analysis, Insights and Forecast - by Types
- 6.2.1. Refrigerated Labels
- 6.2.2. Frozen Labels
- 6.1. Market Analysis, Insights and Forecast - by Application
- 7. South America Injectable Pharmaceuticals Labels Analysis, Insights and Forecast, 2020-2032
- 7.1. Market Analysis, Insights and Forecast - by Application
- 7.1.1. Biomedical Laboratory
- 7.1.2. Medical Institutions
- 7.1.3. Injectable Pharmaceuticals Manufacturers
- 7.1.4. Others
- 7.2. Market Analysis, Insights and Forecast - by Types
- 7.2.1. Refrigerated Labels
- 7.2.2. Frozen Labels
- 7.1. Market Analysis, Insights and Forecast - by Application
- 8. Europe Injectable Pharmaceuticals Labels Analysis, Insights and Forecast, 2020-2032
- 8.1. Market Analysis, Insights and Forecast - by Application
- 8.1.1. Biomedical Laboratory
- 8.1.2. Medical Institutions
- 8.1.3. Injectable Pharmaceuticals Manufacturers
- 8.1.4. Others
- 8.2. Market Analysis, Insights and Forecast - by Types
- 8.2.1. Refrigerated Labels
- 8.2.2. Frozen Labels
- 8.1. Market Analysis, Insights and Forecast - by Application
- 9. Middle East & Africa Injectable Pharmaceuticals Labels Analysis, Insights and Forecast, 2020-2032
- 9.1. Market Analysis, Insights and Forecast - by Application
- 9.1.1. Biomedical Laboratory
- 9.1.2. Medical Institutions
- 9.1.3. Injectable Pharmaceuticals Manufacturers
- 9.1.4. Others
- 9.2. Market Analysis, Insights and Forecast - by Types
- 9.2.1. Refrigerated Labels
- 9.2.2. Frozen Labels
- 9.1. Market Analysis, Insights and Forecast - by Application
- 10. Asia Pacific Injectable Pharmaceuticals Labels Analysis, Insights and Forecast, 2020-2032
- 10.1. Market Analysis, Insights and Forecast - by Application
- 10.1.1. Biomedical Laboratory
- 10.1.2. Medical Institutions
- 10.1.3. Injectable Pharmaceuticals Manufacturers
- 10.1.4. Others
- 10.2. Market Analysis, Insights and Forecast - by Types
- 10.2.1. Refrigerated Labels
- 10.2.2. Frozen Labels
- 10.1. Market Analysis, Insights and Forecast - by Application
- 11. Competitive Analysis
- 11.1. Global Market Share Analysis 2025
- 11.2. Company Profiles
- 11.2.1 Amcor
- 11.2.1.1. Overview
- 11.2.1.2. Products
- 11.2.1.3. SWOT Analysis
- 11.2.1.4. Recent Developments
- 11.2.1.5. Financials (Based on Availability)
- 11.2.2 Avery Dennison
- 11.2.2.1. Overview
- 11.2.2.2. Products
- 11.2.2.3. SWOT Analysis
- 11.2.2.4. Recent Developments
- 11.2.2.5. Financials (Based on Availability)
- 11.2.3 Berry Global
- 11.2.3.1. Overview
- 11.2.3.2. Products
- 11.2.3.3. SWOT Analysis
- 11.2.3.4. Recent Developments
- 11.2.3.5. Financials (Based on Availability)
- 11.2.4 CCL Industries
- 11.2.4.1. Overview
- 11.2.4.2. Products
- 11.2.4.3. SWOT Analysis
- 11.2.4.4. Recent Developments
- 11.2.4.5. Financials (Based on Availability)
- 11.2.5 Constantia Flexibles
- 11.2.5.1. Overview
- 11.2.5.2. Products
- 11.2.5.3. SWOT Analysis
- 11.2.5.4. Recent Developments
- 11.2.5.5. Financials (Based on Availability)
- 11.2.6 Flexo-Graphics
- 11.2.6.1. Overview
- 11.2.6.2. Products
- 11.2.6.3. SWOT Analysis
- 11.2.6.4. Recent Developments
- 11.2.6.5. Financials (Based on Availability)
- 11.2.7 GA International
- 11.2.7.1. Overview
- 11.2.7.2. Products
- 11.2.7.3. SWOT Analysis
- 11.2.7.4. Recent Developments
- 11.2.7.5. Financials (Based on Availability)
- 11.2.8 Hood Packaging
- 11.2.8.1. Overview
- 11.2.8.2. Products
- 11.2.8.3. SWOT Analysis
- 11.2.8.4. Recent Developments
- 11.2.8.5. Financials (Based on Availability)
- 11.2.9 Intertape Polymer Group
- 11.2.9.1. Overview
- 11.2.9.2. Products
- 11.2.9.3. SWOT Analysis
- 11.2.9.4. Recent Developments
- 11.2.9.5. Financials (Based on Availability)
- 11.2.10 Karlville Development
- 11.2.10.1. Overview
- 11.2.10.2. Products
- 11.2.10.3. SWOT Analysis
- 11.2.10.4. Recent Developments
- 11.2.10.5. Financials (Based on Availability)
- 11.2.11 Kiwi Labels
- 11.2.11.1. Overview
- 11.2.11.2. Products
- 11.2.11.3. SWOT Analysis
- 11.2.11.4. Recent Developments
- 11.2.11.5. Financials (Based on Availability)
- 11.2.12 Klckner Pentaplast
- 11.2.12.1. Overview
- 11.2.12.2. Products
- 11.2.12.3. SWOT Analysis
- 11.2.12.4. Recent Developments
- 11.2.12.5. Financials (Based on Availability)
- 11.2.13 SKK Global
- 11.2.13.1. Overview
- 11.2.13.2. Products
- 11.2.13.3. SWOT Analysis
- 11.2.13.4. Recent Developments
- 11.2.13.5. Financials (Based on Availability)
- 11.2.14 UPM Raflatac
- 11.2.14.1. Overview
- 11.2.14.2. Products
- 11.2.14.3. SWOT Analysis
- 11.2.14.4. Recent Developments
- 11.2.14.5. Financials (Based on Availability)
- 11.2.1 Amcor
List of Figures
- Figure 1: Global Injectable Pharmaceuticals Labels Revenue Breakdown (undefined, %) by Region 2025 & 2033
- Figure 2: Global Injectable Pharmaceuticals Labels Volume Breakdown (K, %) by Region 2025 & 2033
- Figure 3: North America Injectable Pharmaceuticals Labels Revenue (undefined), by Application 2025 & 2033
- Figure 4: North America Injectable Pharmaceuticals Labels Volume (K), by Application 2025 & 2033
- Figure 5: North America Injectable Pharmaceuticals Labels Revenue Share (%), by Application 2025 & 2033
- Figure 6: North America Injectable Pharmaceuticals Labels Volume Share (%), by Application 2025 & 2033
- Figure 7: North America Injectable Pharmaceuticals Labels Revenue (undefined), by Types 2025 & 2033
- Figure 8: North America Injectable Pharmaceuticals Labels Volume (K), by Types 2025 & 2033
- Figure 9: North America Injectable Pharmaceuticals Labels Revenue Share (%), by Types 2025 & 2033
- Figure 10: North America Injectable Pharmaceuticals Labels Volume Share (%), by Types 2025 & 2033
- Figure 11: North America Injectable Pharmaceuticals Labels Revenue (undefined), by Country 2025 & 2033
- Figure 12: North America Injectable Pharmaceuticals Labels Volume (K), by Country 2025 & 2033
- Figure 13: North America Injectable Pharmaceuticals Labels Revenue Share (%), by Country 2025 & 2033
- Figure 14: North America Injectable Pharmaceuticals Labels Volume Share (%), by Country 2025 & 2033
- Figure 15: South America Injectable Pharmaceuticals Labels Revenue (undefined), by Application 2025 & 2033
- Figure 16: South America Injectable Pharmaceuticals Labels Volume (K), by Application 2025 & 2033
- Figure 17: South America Injectable Pharmaceuticals Labels Revenue Share (%), by Application 2025 & 2033
- Figure 18: South America Injectable Pharmaceuticals Labels Volume Share (%), by Application 2025 & 2033
- Figure 19: South America Injectable Pharmaceuticals Labels Revenue (undefined), by Types 2025 & 2033
- Figure 20: South America Injectable Pharmaceuticals Labels Volume (K), by Types 2025 & 2033
- Figure 21: South America Injectable Pharmaceuticals Labels Revenue Share (%), by Types 2025 & 2033
- Figure 22: South America Injectable Pharmaceuticals Labels Volume Share (%), by Types 2025 & 2033
- Figure 23: South America Injectable Pharmaceuticals Labels Revenue (undefined), by Country 2025 & 2033
- Figure 24: South America Injectable Pharmaceuticals Labels Volume (K), by Country 2025 & 2033
- Figure 25: South America Injectable Pharmaceuticals Labels Revenue Share (%), by Country 2025 & 2033
- Figure 26: South America Injectable Pharmaceuticals Labels Volume Share (%), by Country 2025 & 2033
- Figure 27: Europe Injectable Pharmaceuticals Labels Revenue (undefined), by Application 2025 & 2033
- Figure 28: Europe Injectable Pharmaceuticals Labels Volume (K), by Application 2025 & 2033
- Figure 29: Europe Injectable Pharmaceuticals Labels Revenue Share (%), by Application 2025 & 2033
- Figure 30: Europe Injectable Pharmaceuticals Labels Volume Share (%), by Application 2025 & 2033
- Figure 31: Europe Injectable Pharmaceuticals Labels Revenue (undefined), by Types 2025 & 2033
- Figure 32: Europe Injectable Pharmaceuticals Labels Volume (K), by Types 2025 & 2033
- Figure 33: Europe Injectable Pharmaceuticals Labels Revenue Share (%), by Types 2025 & 2033
- Figure 34: Europe Injectable Pharmaceuticals Labels Volume Share (%), by Types 2025 & 2033
- Figure 35: Europe Injectable Pharmaceuticals Labels Revenue (undefined), by Country 2025 & 2033
- Figure 36: Europe Injectable Pharmaceuticals Labels Volume (K), by Country 2025 & 2033
- Figure 37: Europe Injectable Pharmaceuticals Labels Revenue Share (%), by Country 2025 & 2033
- Figure 38: Europe Injectable Pharmaceuticals Labels Volume Share (%), by Country 2025 & 2033
- Figure 39: Middle East & Africa Injectable Pharmaceuticals Labels Revenue (undefined), by Application 2025 & 2033
- Figure 40: Middle East & Africa Injectable Pharmaceuticals Labels Volume (K), by Application 2025 & 2033
- Figure 41: Middle East & Africa Injectable Pharmaceuticals Labels Revenue Share (%), by Application 2025 & 2033
- Figure 42: Middle East & Africa Injectable Pharmaceuticals Labels Volume Share (%), by Application 2025 & 2033
- Figure 43: Middle East & Africa Injectable Pharmaceuticals Labels Revenue (undefined), by Types 2025 & 2033
- Figure 44: Middle East & Africa Injectable Pharmaceuticals Labels Volume (K), by Types 2025 & 2033
- Figure 45: Middle East & Africa Injectable Pharmaceuticals Labels Revenue Share (%), by Types 2025 & 2033
- Figure 46: Middle East & Africa Injectable Pharmaceuticals Labels Volume Share (%), by Types 2025 & 2033
- Figure 47: Middle East & Africa Injectable Pharmaceuticals Labels Revenue (undefined), by Country 2025 & 2033
- Figure 48: Middle East & Africa Injectable Pharmaceuticals Labels Volume (K), by Country 2025 & 2033
- Figure 49: Middle East & Africa Injectable Pharmaceuticals Labels Revenue Share (%), by Country 2025 & 2033
- Figure 50: Middle East & Africa Injectable Pharmaceuticals Labels Volume Share (%), by Country 2025 & 2033
- Figure 51: Asia Pacific Injectable Pharmaceuticals Labels Revenue (undefined), by Application 2025 & 2033
- Figure 52: Asia Pacific Injectable Pharmaceuticals Labels Volume (K), by Application 2025 & 2033
- Figure 53: Asia Pacific Injectable Pharmaceuticals Labels Revenue Share (%), by Application 2025 & 2033
- Figure 54: Asia Pacific Injectable Pharmaceuticals Labels Volume Share (%), by Application 2025 & 2033
- Figure 55: Asia Pacific Injectable Pharmaceuticals Labels Revenue (undefined), by Types 2025 & 2033
- Figure 56: Asia Pacific Injectable Pharmaceuticals Labels Volume (K), by Types 2025 & 2033
- Figure 57: Asia Pacific Injectable Pharmaceuticals Labels Revenue Share (%), by Types 2025 & 2033
- Figure 58: Asia Pacific Injectable Pharmaceuticals Labels Volume Share (%), by Types 2025 & 2033
- Figure 59: Asia Pacific Injectable Pharmaceuticals Labels Revenue (undefined), by Country 2025 & 2033
- Figure 60: Asia Pacific Injectable Pharmaceuticals Labels Volume (K), by Country 2025 & 2033
- Figure 61: Asia Pacific Injectable Pharmaceuticals Labels Revenue Share (%), by Country 2025 & 2033
- Figure 62: Asia Pacific Injectable Pharmaceuticals Labels Volume Share (%), by Country 2025 & 2033
List of Tables
- Table 1: Global Injectable Pharmaceuticals Labels Revenue undefined Forecast, by Application 2020 & 2033
- Table 2: Global Injectable Pharmaceuticals Labels Volume K Forecast, by Application 2020 & 2033
- Table 3: Global Injectable Pharmaceuticals Labels Revenue undefined Forecast, by Types 2020 & 2033
- Table 4: Global Injectable Pharmaceuticals Labels Volume K Forecast, by Types 2020 & 2033
- Table 5: Global Injectable Pharmaceuticals Labels Revenue undefined Forecast, by Region 2020 & 2033
- Table 6: Global Injectable Pharmaceuticals Labels Volume K Forecast, by Region 2020 & 2033
- Table 7: Global Injectable Pharmaceuticals Labels Revenue undefined Forecast, by Application 2020 & 2033
- Table 8: Global Injectable Pharmaceuticals Labels Volume K Forecast, by Application 2020 & 2033
- Table 9: Global Injectable Pharmaceuticals Labels Revenue undefined Forecast, by Types 2020 & 2033
- Table 10: Global Injectable Pharmaceuticals Labels Volume K Forecast, by Types 2020 & 2033
- Table 11: Global Injectable Pharmaceuticals Labels Revenue undefined Forecast, by Country 2020 & 2033
- Table 12: Global Injectable Pharmaceuticals Labels Volume K Forecast, by Country 2020 & 2033
- Table 13: United States Injectable Pharmaceuticals Labels Revenue (undefined) Forecast, by Application 2020 & 2033
- Table 14: United States Injectable Pharmaceuticals Labels Volume (K) Forecast, by Application 2020 & 2033
- Table 15: Canada Injectable Pharmaceuticals Labels Revenue (undefined) Forecast, by Application 2020 & 2033
- Table 16: Canada Injectable Pharmaceuticals Labels Volume (K) Forecast, by Application 2020 & 2033
- Table 17: Mexico Injectable Pharmaceuticals Labels Revenue (undefined) Forecast, by Application 2020 & 2033
- Table 18: Mexico Injectable Pharmaceuticals Labels Volume (K) Forecast, by Application 2020 & 2033
- Table 19: Global Injectable Pharmaceuticals Labels Revenue undefined Forecast, by Application 2020 & 2033
- Table 20: Global Injectable Pharmaceuticals Labels Volume K Forecast, by Application 2020 & 2033
- Table 21: Global Injectable Pharmaceuticals Labels Revenue undefined Forecast, by Types 2020 & 2033
- Table 22: Global Injectable Pharmaceuticals Labels Volume K Forecast, by Types 2020 & 2033
- Table 23: Global Injectable Pharmaceuticals Labels Revenue undefined Forecast, by Country 2020 & 2033
- Table 24: Global Injectable Pharmaceuticals Labels Volume K Forecast, by Country 2020 & 2033
- Table 25: Brazil Injectable Pharmaceuticals Labels Revenue (undefined) Forecast, by Application 2020 & 2033
- Table 26: Brazil Injectable Pharmaceuticals Labels Volume (K) Forecast, by Application 2020 & 2033
- Table 27: Argentina Injectable Pharmaceuticals Labels Revenue (undefined) Forecast, by Application 2020 & 2033
- Table 28: Argentina Injectable Pharmaceuticals Labels Volume (K) Forecast, by Application 2020 & 2033
- Table 29: Rest of South America Injectable Pharmaceuticals Labels Revenue (undefined) Forecast, by Application 2020 & 2033
- Table 30: Rest of South America Injectable Pharmaceuticals Labels Volume (K) Forecast, by Application 2020 & 2033
- Table 31: Global Injectable Pharmaceuticals Labels Revenue undefined Forecast, by Application 2020 & 2033
- Table 32: Global Injectable Pharmaceuticals Labels Volume K Forecast, by Application 2020 & 2033
- Table 33: Global Injectable Pharmaceuticals Labels Revenue undefined Forecast, by Types 2020 & 2033
- Table 34: Global Injectable Pharmaceuticals Labels Volume K Forecast, by Types 2020 & 2033
- Table 35: Global Injectable Pharmaceuticals Labels Revenue undefined Forecast, by Country 2020 & 2033
- Table 36: Global Injectable Pharmaceuticals Labels Volume K Forecast, by Country 2020 & 2033
- Table 37: United Kingdom Injectable Pharmaceuticals Labels Revenue (undefined) Forecast, by Application 2020 & 2033
- Table 38: United Kingdom Injectable Pharmaceuticals Labels Volume (K) Forecast, by Application 2020 & 2033
- Table 39: Germany Injectable Pharmaceuticals Labels Revenue (undefined) Forecast, by Application 2020 & 2033
- Table 40: Germany Injectable Pharmaceuticals Labels Volume (K) Forecast, by Application 2020 & 2033
- Table 41: France Injectable Pharmaceuticals Labels Revenue (undefined) Forecast, by Application 2020 & 2033
- Table 42: France Injectable Pharmaceuticals Labels Volume (K) Forecast, by Application 2020 & 2033
- Table 43: Italy Injectable Pharmaceuticals Labels Revenue (undefined) Forecast, by Application 2020 & 2033
- Table 44: Italy Injectable Pharmaceuticals Labels Volume (K) Forecast, by Application 2020 & 2033
- Table 45: Spain Injectable Pharmaceuticals Labels Revenue (undefined) Forecast, by Application 2020 & 2033
- Table 46: Spain Injectable Pharmaceuticals Labels Volume (K) Forecast, by Application 2020 & 2033
- Table 47: Russia Injectable Pharmaceuticals Labels Revenue (undefined) Forecast, by Application 2020 & 2033
- Table 48: Russia Injectable Pharmaceuticals Labels Volume (K) Forecast, by Application 2020 & 2033
- Table 49: Benelux Injectable Pharmaceuticals Labels Revenue (undefined) Forecast, by Application 2020 & 2033
- Table 50: Benelux Injectable Pharmaceuticals Labels Volume (K) Forecast, by Application 2020 & 2033
- Table 51: Nordics Injectable Pharmaceuticals Labels Revenue (undefined) Forecast, by Application 2020 & 2033
- Table 52: Nordics Injectable Pharmaceuticals Labels Volume (K) Forecast, by Application 2020 & 2033
- Table 53: Rest of Europe Injectable Pharmaceuticals Labels Revenue (undefined) Forecast, by Application 2020 & 2033
- Table 54: Rest of Europe Injectable Pharmaceuticals Labels Volume (K) Forecast, by Application 2020 & 2033
- Table 55: Global Injectable Pharmaceuticals Labels Revenue undefined Forecast, by Application 2020 & 2033
- Table 56: Global Injectable Pharmaceuticals Labels Volume K Forecast, by Application 2020 & 2033
- Table 57: Global Injectable Pharmaceuticals Labels Revenue undefined Forecast, by Types 2020 & 2033
- Table 58: Global Injectable Pharmaceuticals Labels Volume K Forecast, by Types 2020 & 2033
- Table 59: Global Injectable Pharmaceuticals Labels Revenue undefined Forecast, by Country 2020 & 2033
- Table 60: Global Injectable Pharmaceuticals Labels Volume K Forecast, by Country 2020 & 2033
- Table 61: Turkey Injectable Pharmaceuticals Labels Revenue (undefined) Forecast, by Application 2020 & 2033
- Table 62: Turkey Injectable Pharmaceuticals Labels Volume (K) Forecast, by Application 2020 & 2033
- Table 63: Israel Injectable Pharmaceuticals Labels Revenue (undefined) Forecast, by Application 2020 & 2033
- Table 64: Israel Injectable Pharmaceuticals Labels Volume (K) Forecast, by Application 2020 & 2033
- Table 65: GCC Injectable Pharmaceuticals Labels Revenue (undefined) Forecast, by Application 2020 & 2033
- Table 66: GCC Injectable Pharmaceuticals Labels Volume (K) Forecast, by Application 2020 & 2033
- Table 67: North Africa Injectable Pharmaceuticals Labels Revenue (undefined) Forecast, by Application 2020 & 2033
- Table 68: North Africa Injectable Pharmaceuticals Labels Volume (K) Forecast, by Application 2020 & 2033
- Table 69: South Africa Injectable Pharmaceuticals Labels Revenue (undefined) Forecast, by Application 2020 & 2033
- Table 70: South Africa Injectable Pharmaceuticals Labels Volume (K) Forecast, by Application 2020 & 2033
- Table 71: Rest of Middle East & Africa Injectable Pharmaceuticals Labels Revenue (undefined) Forecast, by Application 2020 & 2033
- Table 72: Rest of Middle East & Africa Injectable Pharmaceuticals Labels Volume (K) Forecast, by Application 2020 & 2033
- Table 73: Global Injectable Pharmaceuticals Labels Revenue undefined Forecast, by Application 2020 & 2033
- Table 74: Global Injectable Pharmaceuticals Labels Volume K Forecast, by Application 2020 & 2033
- Table 75: Global Injectable Pharmaceuticals Labels Revenue undefined Forecast, by Types 2020 & 2033
- Table 76: Global Injectable Pharmaceuticals Labels Volume K Forecast, by Types 2020 & 2033
- Table 77: Global Injectable Pharmaceuticals Labels Revenue undefined Forecast, by Country 2020 & 2033
- Table 78: Global Injectable Pharmaceuticals Labels Volume K Forecast, by Country 2020 & 2033
- Table 79: China Injectable Pharmaceuticals Labels Revenue (undefined) Forecast, by Application 2020 & 2033
- Table 80: China Injectable Pharmaceuticals Labels Volume (K) Forecast, by Application 2020 & 2033
- Table 81: India Injectable Pharmaceuticals Labels Revenue (undefined) Forecast, by Application 2020 & 2033
- Table 82: India Injectable Pharmaceuticals Labels Volume (K) Forecast, by Application 2020 & 2033
- Table 83: Japan Injectable Pharmaceuticals Labels Revenue (undefined) Forecast, by Application 2020 & 2033
- Table 84: Japan Injectable Pharmaceuticals Labels Volume (K) Forecast, by Application 2020 & 2033
- Table 85: South Korea Injectable Pharmaceuticals Labels Revenue (undefined) Forecast, by Application 2020 & 2033
- Table 86: South Korea Injectable Pharmaceuticals Labels Volume (K) Forecast, by Application 2020 & 2033
- Table 87: ASEAN Injectable Pharmaceuticals Labels Revenue (undefined) Forecast, by Application 2020 & 2033
- Table 88: ASEAN Injectable Pharmaceuticals Labels Volume (K) Forecast, by Application 2020 & 2033
- Table 89: Oceania Injectable Pharmaceuticals Labels Revenue (undefined) Forecast, by Application 2020 & 2033
- Table 90: Oceania Injectable Pharmaceuticals Labels Volume (K) Forecast, by Application 2020 & 2033
- Table 91: Rest of Asia Pacific Injectable Pharmaceuticals Labels Revenue (undefined) Forecast, by Application 2020 & 2033
- Table 92: Rest of Asia Pacific Injectable Pharmaceuticals Labels Volume (K) Forecast, by Application 2020 & 2033
Frequently Asked Questions
1. What is the projected Compound Annual Growth Rate (CAGR) of the Injectable Pharmaceuticals Labels?
The projected CAGR is approximately 6.08%.
2. Which companies are prominent players in the Injectable Pharmaceuticals Labels?
Key companies in the market include Amcor, Avery Dennison, Berry Global, CCL Industries, Constantia Flexibles, Flexo-Graphics, GA International, Hood Packaging, Intertape Polymer Group, Karlville Development, Kiwi Labels, Klckner Pentaplast, SKK Global, UPM Raflatac.
3. What are the main segments of the Injectable Pharmaceuticals Labels?
The market segments include Application, Types.
4. Can you provide details about the market size?
The market size is estimated to be USD XXX N/A as of 2022.
5. What are some drivers contributing to market growth?
N/A
6. What are the notable trends driving market growth?
N/A
7. Are there any restraints impacting market growth?
N/A
8. Can you provide examples of recent developments in the market?
N/A
9. What pricing options are available for accessing the report?
Pricing options include single-user, multi-user, and enterprise licenses priced at USD 3350.00, USD 5025.00, and USD 6700.00 respectively.
10. Is the market size provided in terms of value or volume?
The market size is provided in terms of value, measured in N/A and volume, measured in K.
11. Are there any specific market keywords associated with the report?
Yes, the market keyword associated with the report is "Injectable Pharmaceuticals Labels," which aids in identifying and referencing the specific market segment covered.
12. How do I determine which pricing option suits my needs best?
The pricing options vary based on user requirements and access needs. Individual users may opt for single-user licenses, while businesses requiring broader access may choose multi-user or enterprise licenses for cost-effective access to the report.
13. Are there any additional resources or data provided in the Injectable Pharmaceuticals Labels report?
While the report offers comprehensive insights, it's advisable to review the specific contents or supplementary materials provided to ascertain if additional resources or data are available.
14. How can I stay updated on further developments or reports in the Injectable Pharmaceuticals Labels?
To stay informed about further developments, trends, and reports in the Injectable Pharmaceuticals Labels, consider subscribing to industry newsletters, following relevant companies and organizations, or regularly checking reputable industry news sources and publications.
Methodology
Step 1 - Identification of Relevant Samples Size from Population Database


Step 2 - Approaches for Defining Global Market Size (Value, Volume* & Price*)

Note*: In applicable scenarios
Step 3 - Data Sources
Primary Research
- Web Analytics
- Survey Reports
- Research Institute
- Latest Research Reports
- Opinion Leaders
Secondary Research
- Annual Reports
- White Paper
- Latest Press Release
- Industry Association
- Paid Database
- Investor Presentations

Step 4 - Data Triangulation
Involves using different sources of information in order to increase the validity of a study
These sources are likely to be stakeholders in a program - participants, other researchers, program staff, other community members, and so on.
Then we put all data in single framework & apply various statistical tools to find out the dynamic on the market.
During the analysis stage, feedback from the stakeholder groups would be compared to determine areas of agreement as well as areas of divergence