

Key Insights
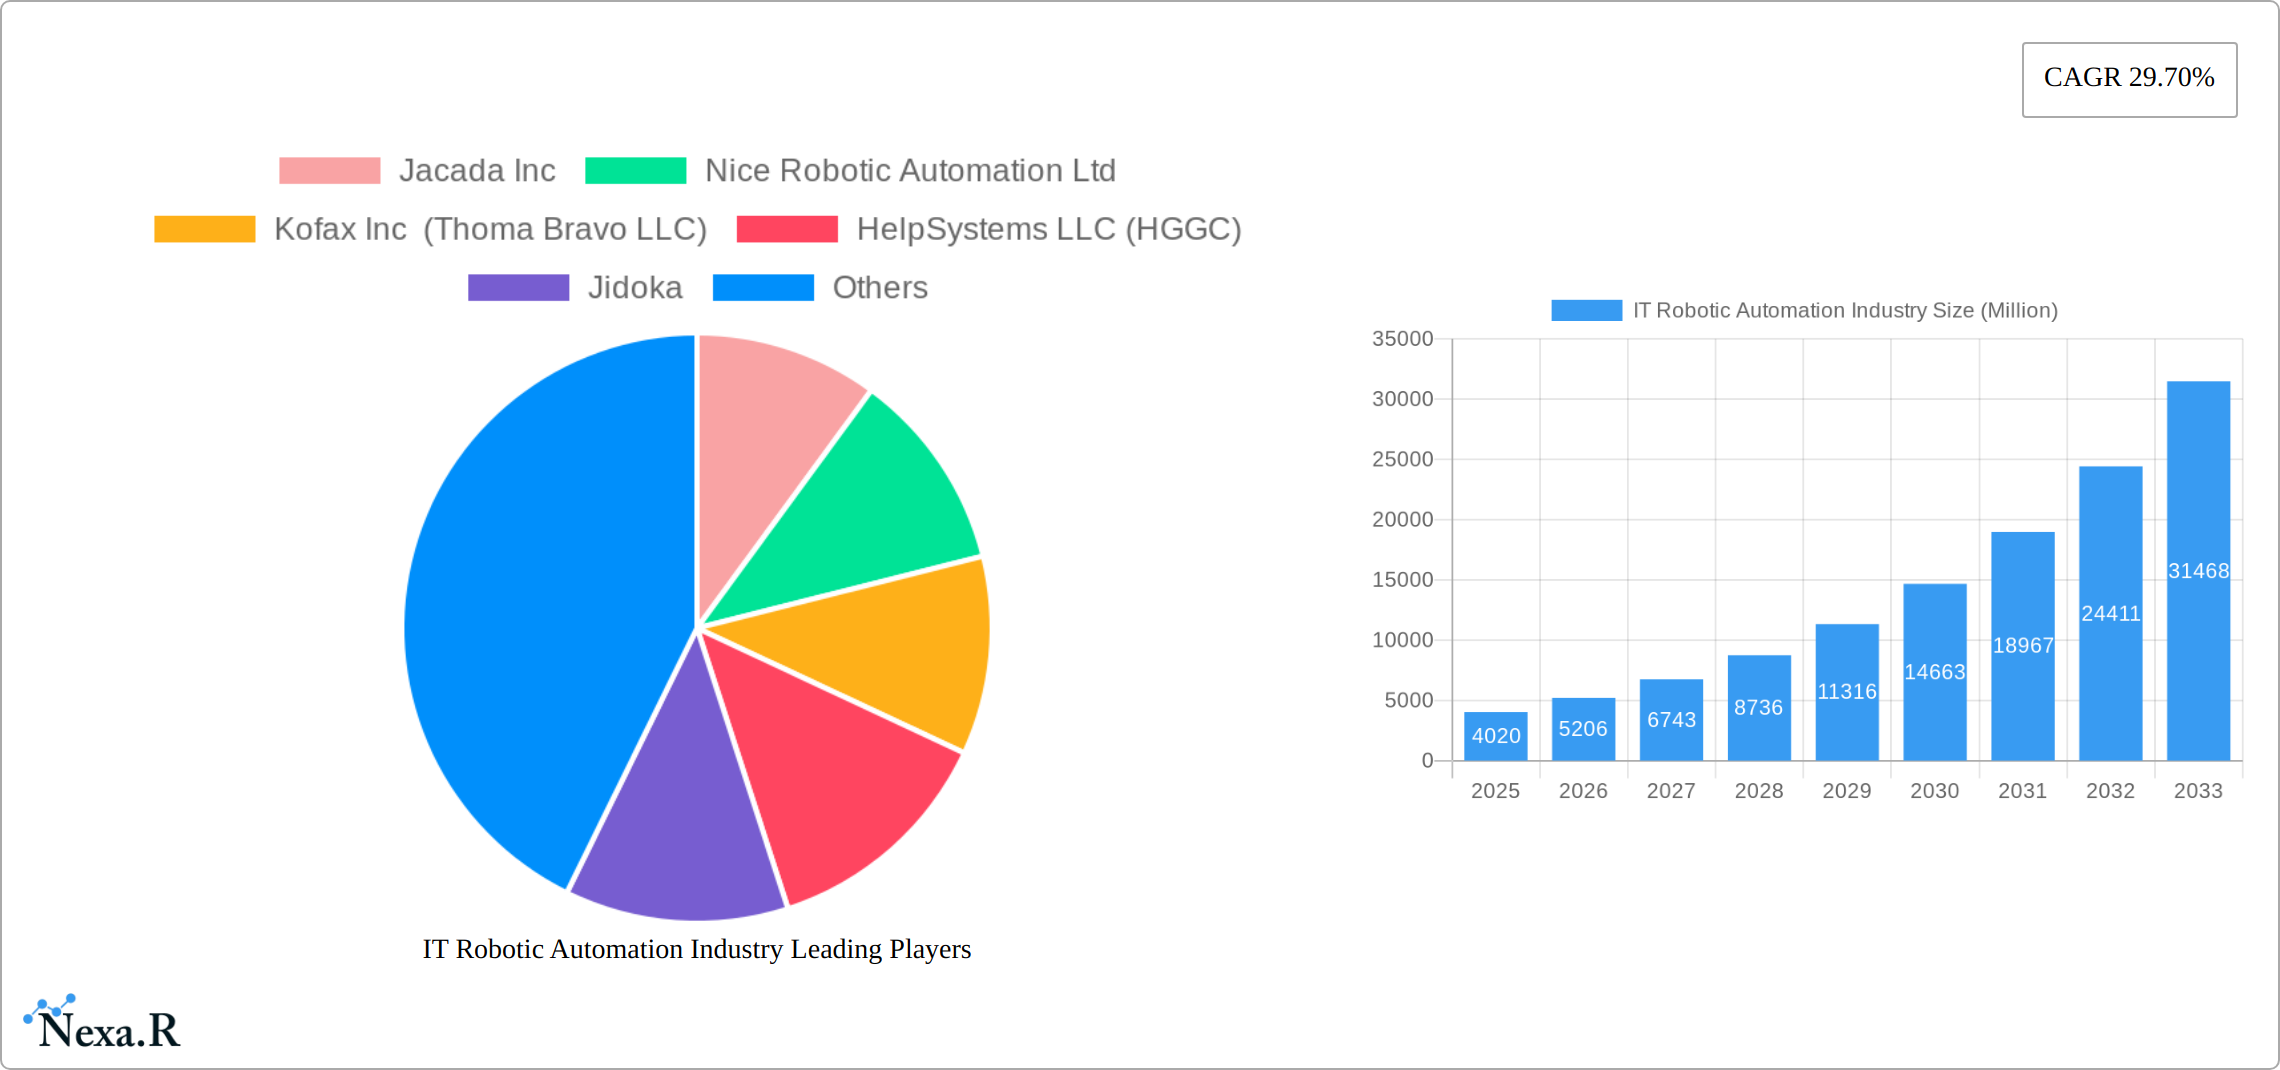
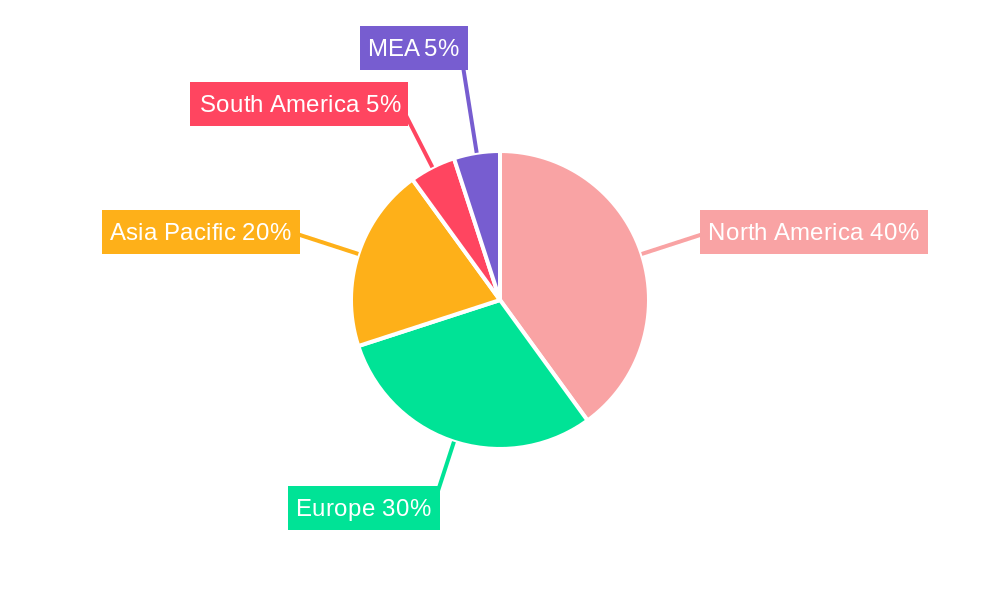
The IT Robotic Process Automation (RPA) market is experiencing robust growth, projected to reach \$4.02 billion in 2025 and exhibiting a Compound Annual Growth Rate (CAGR) of 29.70% from 2025 to 2033. This expansion is driven by several key factors. The increasing need for operational efficiency and cost reduction across industries like IT & Telecom, BFSI (Banking, Financial Services, and Insurance), Healthcare, and Manufacturing is a primary catalyst. Businesses are leveraging RPA to automate repetitive tasks, improve accuracy, and enhance employee productivity. Furthermore, the rising adoption of cloud-based RPA solutions offers scalability and flexibility, contributing to market growth. The shift towards digital transformation and the increasing volume of data requiring processing further fuels the demand for automation solutions. While the initial investment in RPA implementation can be a restraint for some smaller enterprises, the long-term cost savings and improved efficiency outweigh this initial hurdle. The market is segmented by solution (Software and Service), enterprise size (SMEs and Large Enterprises), end-user industry, and deployment type (on-premise and cloud). The North American market currently holds a significant share, followed by Europe and Asia-Pacific, although the latter region is anticipated to witness the most rapid growth in the coming years.
The competitive landscape is characterized by a mix of established players and emerging innovators. Companies like UiPath, Automation Anywhere, and Blue Prism are prominent leaders, continuously developing advanced features and expanding their service offerings. However, the market also features numerous niche players and smaller companies focusing on specific industry verticals or deployment models. This competitive environment fosters innovation and keeps prices competitive, making RPA solutions increasingly accessible to a broader range of organizations. The future of the IT RPA market is bright, with continued growth driven by technological advancements, such as AI and machine learning integration, and the expanding need for automation across diverse sectors. The focus will increasingly shift towards intelligent automation, which combines RPA with cognitive capabilities to handle more complex processes. This evolution ensures RPA's continued relevance and growth trajectory.
IT Robotic Automation Industry Market Report: 2019-2033
This comprehensive report provides a detailed analysis of the IT Robotic Automation industry, encompassing market dynamics, growth trends, regional segmentation, product landscape, key players, and future outlook. The report covers the period 2019-2033, with a focus on the estimated year 2025. This in-depth analysis will equip industry professionals, investors, and strategists with the critical insights needed to navigate this rapidly evolving market. The parent market is the broader IT Services industry, while the child market is Robotic Process Automation (RPA) within IT. The market size is projected in millions of units.
IT Robotic Automation Industry Market Dynamics & Structure
The IT Robotic Automation industry is characterized by a moderately concentrated market structure, with a few major players holding significant market share. Technological innovation, driven by advancements in artificial intelligence (AI), machine learning (ML), and natural language processing (NLP), is a key driver. Regulatory frameworks, including data privacy regulations (e.g., GDPR), influence adoption and implementation strategies. Competitive product substitutes, such as traditional Business Process Outsourcing (BPO) services, pose challenges, but RPA's efficiency advantages are increasingly favorable. End-user demographics show strong adoption among large enterprises, but SMEs are increasingly adopting RPA solutions. M&A activity has been significant, with larger players acquiring smaller firms to expand their capabilities and market reach. We project xx M&A deals in the next 5 years.
- Market Concentration: Moderately concentrated, with top 5 players holding approximately xx% market share in 2025.
- Technological Innovation: AI, ML, and NLP are key drivers of innovation.
- Regulatory Frameworks: GDPR and similar regulations impact adoption and implementation.
- Competitive Substitutes: Traditional BPO services are key competitors.
- End-User Demographics: Large enterprises are early adopters, but SME adoption is growing rapidly.
- M&A Trends: Significant M&A activity, with larger firms acquiring smaller companies for technology and market expansion.
IT Robotic Automation Industry Growth Trends & Insights
The IT Robotic Automation market witnessed substantial growth from 2019 to 2024, exhibiting a CAGR of [Insert CAGR Percentage]%. This upward trajectory is projected to persist throughout the forecast period (2025-2033), with the market size anticipated to reach [Insert Market Size in Million Units] by 2033, maintaining a CAGR of [Insert CAGR Percentage]%. Several key factors fuel this expansion, including the escalating demand for automation across diverse industries, the decreasing cost of implementing Robotic Process Automation (RPA), and a growing recognition of RPA's significant return on investment (ROI). The emergence of transformative technologies like hyperautomation and intelligent automation is fundamentally reshaping the market landscape, driving the adoption of increasingly sophisticated solutions. Consumer preferences are shifting towards cloud-based solutions, demanding flexible and scalable automation offerings. Market penetration is steadily increasing across key segments, particularly within the Banking, Financial Services, and Insurance (BFSI) and healthcare sectors. The increasing adoption of AI and ML within RPA solutions is also contributing to this growth.
Dominant Regions, Countries, or Segments in IT Robotic Automation Industry
North America currently holds a dominant position in the IT Robotic Automation market, driven by its advanced technological infrastructure, early adoption rates, and a substantial pool of skilled professionals. The United States commands the largest market share within North America. However, the Asia-Pacific region is poised for the most rapid growth during the forecast period, fueled by its rapid technological advancements, increasing digitalization across various industries, and supportive government policies. Analyzing market segments, the Software solution segment holds a substantial market share due to the higher initial investment typically required for service-based solutions, particularly among large enterprises. Large enterprises are primary adopters, contributing to a higher market value due to their larger budgets and complex automation needs. The IT and Telecom, BFSI, and Healthcare sectors are key end-user industries driving market expansion. Cloud deployment is experiencing faster growth compared to on-premise solutions due to its inherent scalability and cost-effectiveness. Furthermore, the increasing adoption of hybrid cloud models is also contributing to market growth.
- Key Drivers:
- North America: Advanced technological infrastructure, early adoption, skilled workforce, strong regulatory environment.
- Asia-Pacific: Rapid technological advancement, increasing digitalization, supportive government policies, expanding digital workforce.
- Software Solutions: Scalability, flexibility, and ease of integration with existing systems.
- Large Enterprises: Significant budgets and complex automation needs, requiring sophisticated solutions.
- IT & Telecom, BFSI, Healthcare: High automation needs, potential for significant ROI, and data-rich environments.
- Cloud Deployment: Scalability, cost-effectiveness, accessibility, and enhanced security.
- AI and ML Integration: Enhanced accuracy, decision-making capabilities, and process optimization.
IT Robotic Automation Industry Product Landscape
The IT Robotic Automation product landscape is diverse, encompassing a wide array of software and service offerings with varying levels of sophistication and functionality. The market features a spectrum of products, ranging from basic Robotic Process Automation (RPA) tools to advanced hyperautomation platforms capable of managing intricate workflows. Key features frequently include seamless integration with diverse enterprise systems, AI-powered capabilities, and robust security protocols. Competitive advantages often revolve around ease of use, scalability, and rapid deployment. Continuous technological advancements are driving innovation, resulting in superior performance metrics, enhanced accuracy, and reduced implementation times. The increasing availability of low-code/no-code platforms is also contributing to broader adoption.
Key Drivers, Barriers & Challenges in IT Robotic Automation Industry
Key Drivers: The increasing need to improve operational efficiency, reduce operational costs, and enhance customer experience, coupled with technological advancements like AI and ML, are key drivers pushing the adoption of Robotic Process Automation. Government initiatives promoting digital transformation and automation further accelerate market growth.
Key Challenges and Restraints: High initial investment costs, the complexity of implementation, and the need for specialized skills pose challenges to wider adoption. Concerns about job displacement and data security are also significant restraints. Supply chain disruptions, particularly during periods of economic uncertainty, further impact the market. We estimate a xx% reduction in market growth due to supply chain issues in 2024.
Emerging Opportunities in IT Robotic Automation Industry
Emerging opportunities exist in untapped markets like the public sector and small and medium-sized enterprises (SMEs). Innovative applications in areas like customer service, cybersecurity, and supply chain management are opening new avenues for growth. Evolving consumer preferences drive demand for more user-friendly and integrated solutions.
Growth Accelerators in the IT Robotic Automation Industry
Technological breakthroughs in AI and ML are set to significantly accelerate market growth by enabling more sophisticated automation capabilities and reduced implementation times. Strategic partnerships between RPA vendors and technology providers will fuel innovation and wider market penetration. Expansion strategies, particularly into emerging markets and underserved segments, will further propel market expansion in the long term.
Key Players Shaping the IT Robotic Automation Industry Market
- Jacada Inc
- Nice Robotic Automation Ltd
- Kofax Inc (Thoma Bravo LLC)
- HelpSystems LLC (HGGC)
- Jidoka
- UIPath Inc
- Datamatics Global Services Limited
- Automation Anywhere Inc
- Be Informed BV (Hoogenberg Beheer BV)
- Pegasystems Inc
- AutomationEdge Technologies Inc
- Blue Prism Group PLC
- CGI Inc
Notable Milestones in IT Robotic Automation Industry Sector
- September 2022: UiPath and Snowflake launched a new bi-directional integration, significantly enhancing automation capabilities.
- August 2022: Digital Workforce Services partnered with Keva to deliver a cloud-based RPA solution, highlighting the growing trend towards cloud adoption.
- [Insert Year]: [Insert Milestone - Add more recent and relevant milestones here]
- [Insert Year]: [Insert Milestone - Add more recent and relevant milestones here]
In-Depth IT Robotic Automation Industry Market Outlook
The future of the IT Robotic Automation industry is exceptionally promising, driven by continuous technological innovation, increased enterprise adoption, and expansion into new sectors and markets. Strategic partnerships, groundbreaking product innovations, and a commitment to enhancing user experience will be pivotal in securing a larger share of this expanding market. The market is poised for sustained robust growth, presenting substantial opportunities for businesses to streamline efficiency, reduce operational costs, enhance customer satisfaction, and gain a competitive edge.
IT Robotic Automation Industry Segmentation
-
1. Deployment
- 1.1. On-premise
- 1.2. Cloud
-
2. Solution
- 2.1. Software
- 2.2. Service
-
3. Size of Enterprise
- 3.1. Small and Medium Enterprises
- 3.2. Large Enterprises
-
4. End User Industry
- 4.1. IT and Telecom
- 4.2. BFSI
- 4.3. Healthcare
- 4.4. Retail
- 4.5. Manufacturing
- 4.6. Other End User Industries
IT Robotic Automation Industry Segmentation By Geography
- 1. North America
- 2. Europe
- 3. Asia Pacific
- 4. Latin America
- 5. Middle East and Africa
IT Robotic Automation Industry REPORT HIGHLIGHTS
| Aspects | Details |
|---|---|
| Study Period | 2019-2033 |
| Base Year | 2024 |
| Estimated Year | 2025 |
| Forecast Period | 2025-2033 |
| Historical Period | 2019-2024 |
| Growth Rate | CAGR of 29.70% from 2019-2033 |
| Segmentation |
|
Table of Contents
- 1. Introduction
- 1.1. Research Scope
- 1.2. Market Segmentation
- 1.3. Research Methodology
- 1.4. Definitions and Assumptions
- 2. Executive Summary
- 2.1. Introduction
- 3. Market Dynamics
- 3.1. Introduction
- 3.2. Market Drivers
- 3.2.1. Retail Sector to hold major share in RPA Market; Adoption of AI- and Cloud-based Solutions for Internal Efficiency among SMEs
- 3.3. Market Restrains
- 3.3.1. Data Security Concerns
- 3.4. Market Trends
- 3.4.1. Retail Sector to hold major share in RPA Market
- 4. Market Factor Analysis
- 4.1. Porters Five Forces
- 4.2. Supply/Value Chain
- 4.3. PESTEL analysis
- 4.4. Market Entropy
- 4.5. Patent/Trademark Analysis
- 5. Global IT Robotic Automation Industry Analysis, Insights and Forecast, 2019-2031
- 5.1. Market Analysis, Insights and Forecast - by Deployment
- 5.1.1. On-premise
- 5.1.2. Cloud
- 5.2. Market Analysis, Insights and Forecast - by Solution
- 5.2.1. Software
- 5.2.2. Service
- 5.3. Market Analysis, Insights and Forecast - by Size of Enterprise
- 5.3.1. Small and Medium Enterprises
- 5.3.2. Large Enterprises
- 5.4. Market Analysis, Insights and Forecast - by End User Industry
- 5.4.1. IT and Telecom
- 5.4.2. BFSI
- 5.4.3. Healthcare
- 5.4.4. Retail
- 5.4.5. Manufacturing
- 5.4.6. Other End User Industries
- 5.5. Market Analysis, Insights and Forecast - by Region
- 5.5.1. North America
- 5.5.2. Europe
- 5.5.3. Asia Pacific
- 5.5.4. Latin America
- 5.5.5. Middle East and Africa
- 5.1. Market Analysis, Insights and Forecast - by Deployment
- 6. North America IT Robotic Automation Industry Analysis, Insights and Forecast, 2019-2031
- 6.1. Market Analysis, Insights and Forecast - by Deployment
- 6.1.1. On-premise
- 6.1.2. Cloud
- 6.2. Market Analysis, Insights and Forecast - by Solution
- 6.2.1. Software
- 6.2.2. Service
- 6.3. Market Analysis, Insights and Forecast - by Size of Enterprise
- 6.3.1. Small and Medium Enterprises
- 6.3.2. Large Enterprises
- 6.4. Market Analysis, Insights and Forecast - by End User Industry
- 6.4.1. IT and Telecom
- 6.4.2. BFSI
- 6.4.3. Healthcare
- 6.4.4. Retail
- 6.4.5. Manufacturing
- 6.4.6. Other End User Industries
- 6.1. Market Analysis, Insights and Forecast - by Deployment
- 7. Europe IT Robotic Automation Industry Analysis, Insights and Forecast, 2019-2031
- 7.1. Market Analysis, Insights and Forecast - by Deployment
- 7.1.1. On-premise
- 7.1.2. Cloud
- 7.2. Market Analysis, Insights and Forecast - by Solution
- 7.2.1. Software
- 7.2.2. Service
- 7.3. Market Analysis, Insights and Forecast - by Size of Enterprise
- 7.3.1. Small and Medium Enterprises
- 7.3.2. Large Enterprises
- 7.4. Market Analysis, Insights and Forecast - by End User Industry
- 7.4.1. IT and Telecom
- 7.4.2. BFSI
- 7.4.3. Healthcare
- 7.4.4. Retail
- 7.4.5. Manufacturing
- 7.4.6. Other End User Industries
- 7.1. Market Analysis, Insights and Forecast - by Deployment
- 8. Asia Pacific IT Robotic Automation Industry Analysis, Insights and Forecast, 2019-2031
- 8.1. Market Analysis, Insights and Forecast - by Deployment
- 8.1.1. On-premise
- 8.1.2. Cloud
- 8.2. Market Analysis, Insights and Forecast - by Solution
- 8.2.1. Software
- 8.2.2. Service
- 8.3. Market Analysis, Insights and Forecast - by Size of Enterprise
- 8.3.1. Small and Medium Enterprises
- 8.3.2. Large Enterprises
- 8.4. Market Analysis, Insights and Forecast - by End User Industry
- 8.4.1. IT and Telecom
- 8.4.2. BFSI
- 8.4.3. Healthcare
- 8.4.4. Retail
- 8.4.5. Manufacturing
- 8.4.6. Other End User Industries
- 8.1. Market Analysis, Insights and Forecast - by Deployment
- 9. Latin America IT Robotic Automation Industry Analysis, Insights and Forecast, 2019-2031
- 9.1. Market Analysis, Insights and Forecast - by Deployment
- 9.1.1. On-premise
- 9.1.2. Cloud
- 9.2. Market Analysis, Insights and Forecast - by Solution
- 9.2.1. Software
- 9.2.2. Service
- 9.3. Market Analysis, Insights and Forecast - by Size of Enterprise
- 9.3.1. Small and Medium Enterprises
- 9.3.2. Large Enterprises
- 9.4. Market Analysis, Insights and Forecast - by End User Industry
- 9.4.1. IT and Telecom
- 9.4.2. BFSI
- 9.4.3. Healthcare
- 9.4.4. Retail
- 9.4.5. Manufacturing
- 9.4.6. Other End User Industries
- 9.1. Market Analysis, Insights and Forecast - by Deployment
- 10. Middle East and Africa IT Robotic Automation Industry Analysis, Insights and Forecast, 2019-2031
- 10.1. Market Analysis, Insights and Forecast - by Deployment
- 10.1.1. On-premise
- 10.1.2. Cloud
- 10.2. Market Analysis, Insights and Forecast - by Solution
- 10.2.1. Software
- 10.2.2. Service
- 10.3. Market Analysis, Insights and Forecast - by Size of Enterprise
- 10.3.1. Small and Medium Enterprises
- 10.3.2. Large Enterprises
- 10.4. Market Analysis, Insights and Forecast - by End User Industry
- 10.4.1. IT and Telecom
- 10.4.2. BFSI
- 10.4.3. Healthcare
- 10.4.4. Retail
- 10.4.5. Manufacturing
- 10.4.6. Other End User Industries
- 10.1. Market Analysis, Insights and Forecast - by Deployment
- 11. North America IT Robotic Automation Industry Analysis, Insights and Forecast, 2019-2031
- 11.1. Market Analysis, Insights and Forecast - By Country/Sub-region
- 11.1.1 United States
- 11.1.2 Canada
- 11.1.3 Mexico
- 12. Europe IT Robotic Automation Industry Analysis, Insights and Forecast, 2019-2031
- 12.1. Market Analysis, Insights and Forecast - By Country/Sub-region
- 12.1.1 Germany
- 12.1.2 United Kingdom
- 12.1.3 France
- 12.1.4 Spain
- 12.1.5 Italy
- 12.1.6 Spain
- 12.1.7 Belgium
- 12.1.8 Netherland
- 12.1.9 Nordics
- 12.1.10 Rest of Europe
- 13. Asia Pacific IT Robotic Automation Industry Analysis, Insights and Forecast, 2019-2031
- 13.1. Market Analysis, Insights and Forecast - By Country/Sub-region
- 13.1.1 China
- 13.1.2 Japan
- 13.1.3 India
- 13.1.4 South Korea
- 13.1.5 Southeast Asia
- 13.1.6 Australia
- 13.1.7 Indonesia
- 13.1.8 Phillipes
- 13.1.9 Singapore
- 13.1.10 Thailandc
- 13.1.11 Rest of Asia Pacific
- 14. South America IT Robotic Automation Industry Analysis, Insights and Forecast, 2019-2031
- 14.1. Market Analysis, Insights and Forecast - By Country/Sub-region
- 14.1.1 Brazil
- 14.1.2 Argentina
- 14.1.3 Peru
- 14.1.4 Chile
- 14.1.5 Colombia
- 14.1.6 Ecuador
- 14.1.7 Venezuela
- 14.1.8 Rest of South America
- 15. North America IT Robotic Automation Industry Analysis, Insights and Forecast, 2019-2031
- 15.1. Market Analysis, Insights and Forecast - By Country/Sub-region
- 15.1.1 United States
- 15.1.2 Canada
- 15.1.3 Mexico
- 16. MEA IT Robotic Automation Industry Analysis, Insights and Forecast, 2019-2031
- 16.1. Market Analysis, Insights and Forecast - By Country/Sub-region
- 16.1.1 United Arab Emirates
- 16.1.2 Saudi Arabia
- 16.1.3 South Africa
- 16.1.4 Rest of Middle East and Africa
- 17. Competitive Analysis
- 17.1. Global Market Share Analysis 2024
- 17.2. Company Profiles
- 17.2.1 Jacada Inc
- 17.2.1.1. Overview
- 17.2.1.2. Products
- 17.2.1.3. SWOT Analysis
- 17.2.1.4. Recent Developments
- 17.2.1.5. Financials (Based on Availability)
- 17.2.2 Nice Robotic Automation Ltd
- 17.2.2.1. Overview
- 17.2.2.2. Products
- 17.2.2.3. SWOT Analysis
- 17.2.2.4. Recent Developments
- 17.2.2.5. Financials (Based on Availability)
- 17.2.3 Kofax Inc (Thoma Bravo LLC)
- 17.2.3.1. Overview
- 17.2.3.2. Products
- 17.2.3.3. SWOT Analysis
- 17.2.3.4. Recent Developments
- 17.2.3.5. Financials (Based on Availability)
- 17.2.4 HelpSystems LLC (HGGC)
- 17.2.4.1. Overview
- 17.2.4.2. Products
- 17.2.4.3. SWOT Analysis
- 17.2.4.4. Recent Developments
- 17.2.4.5. Financials (Based on Availability)
- 17.2.5 Jidoka
- 17.2.5.1. Overview
- 17.2.5.2. Products
- 17.2.5.3. SWOT Analysis
- 17.2.5.4. Recent Developments
- 17.2.5.5. Financials (Based on Availability)
- 17.2.6 UIPath Inc
- 17.2.6.1. Overview
- 17.2.6.2. Products
- 17.2.6.3. SWOT Analysis
- 17.2.6.4. Recent Developments
- 17.2.6.5. Financials (Based on Availability)
- 17.2.7 Datamatics Global Services Limited
- 17.2.7.1. Overview
- 17.2.7.2. Products
- 17.2.7.3. SWOT Analysis
- 17.2.7.4. Recent Developments
- 17.2.7.5. Financials (Based on Availability)
- 17.2.8 Automation Anywhere Inc
- 17.2.8.1. Overview
- 17.2.8.2. Products
- 17.2.8.3. SWOT Analysis
- 17.2.8.4. Recent Developments
- 17.2.8.5. Financials (Based on Availability)
- 17.2.9 Be Informed BV (Hoogenberg Beheer BV)
- 17.2.9.1. Overview
- 17.2.9.2. Products
- 17.2.9.3. SWOT Analysis
- 17.2.9.4. Recent Developments
- 17.2.9.5. Financials (Based on Availability)
- 17.2.10 Pegasystems Inc
- 17.2.10.1. Overview
- 17.2.10.2. Products
- 17.2.10.3. SWOT Analysis
- 17.2.10.4. Recent Developments
- 17.2.10.5. Financials (Based on Availability)
- 17.2.11 AutomationEdge Technologies Inc
- 17.2.11.1. Overview
- 17.2.11.2. Products
- 17.2.11.3. SWOT Analysis
- 17.2.11.4. Recent Developments
- 17.2.11.5. Financials (Based on Availability)
- 17.2.12 Blue Prism Group PLC
- 17.2.12.1. Overview
- 17.2.12.2. Products
- 17.2.12.3. SWOT Analysis
- 17.2.12.4. Recent Developments
- 17.2.12.5. Financials (Based on Availability)
- 17.2.13 CGI Inc
- 17.2.13.1. Overview
- 17.2.13.2. Products
- 17.2.13.3. SWOT Analysis
- 17.2.13.4. Recent Developments
- 17.2.13.5. Financials (Based on Availability)
- 17.2.1 Jacada Inc
List of Figures
- Figure 1: Global IT Robotic Automation Industry Revenue Breakdown (Million, %) by Region 2024 & 2032
- Figure 2: Global IT Robotic Automation Industry Volume Breakdown (K Unit, %) by Region 2024 & 2032
- Figure 3: North America IT Robotic Automation Industry Revenue (Million), by Country 2024 & 2032
- Figure 4: North America IT Robotic Automation Industry Volume (K Unit), by Country 2024 & 2032
- Figure 5: North America IT Robotic Automation Industry Revenue Share (%), by Country 2024 & 2032
- Figure 6: North America IT Robotic Automation Industry Volume Share (%), by Country 2024 & 2032
- Figure 7: Europe IT Robotic Automation Industry Revenue (Million), by Country 2024 & 2032
- Figure 8: Europe IT Robotic Automation Industry Volume (K Unit), by Country 2024 & 2032
- Figure 9: Europe IT Robotic Automation Industry Revenue Share (%), by Country 2024 & 2032
- Figure 10: Europe IT Robotic Automation Industry Volume Share (%), by Country 2024 & 2032
- Figure 11: Asia Pacific IT Robotic Automation Industry Revenue (Million), by Country 2024 & 2032
- Figure 12: Asia Pacific IT Robotic Automation Industry Volume (K Unit), by Country 2024 & 2032
- Figure 13: Asia Pacific IT Robotic Automation Industry Revenue Share (%), by Country 2024 & 2032
- Figure 14: Asia Pacific IT Robotic Automation Industry Volume Share (%), by Country 2024 & 2032
- Figure 15: South America IT Robotic Automation Industry Revenue (Million), by Country 2024 & 2032
- Figure 16: South America IT Robotic Automation Industry Volume (K Unit), by Country 2024 & 2032
- Figure 17: South America IT Robotic Automation Industry Revenue Share (%), by Country 2024 & 2032
- Figure 18: South America IT Robotic Automation Industry Volume Share (%), by Country 2024 & 2032
- Figure 19: North America IT Robotic Automation Industry Revenue (Million), by Country 2024 & 2032
- Figure 20: North America IT Robotic Automation Industry Volume (K Unit), by Country 2024 & 2032
- Figure 21: North America IT Robotic Automation Industry Revenue Share (%), by Country 2024 & 2032
- Figure 22: North America IT Robotic Automation Industry Volume Share (%), by Country 2024 & 2032
- Figure 23: MEA IT Robotic Automation Industry Revenue (Million), by Country 2024 & 2032
- Figure 24: MEA IT Robotic Automation Industry Volume (K Unit), by Country 2024 & 2032
- Figure 25: MEA IT Robotic Automation Industry Revenue Share (%), by Country 2024 & 2032
- Figure 26: MEA IT Robotic Automation Industry Volume Share (%), by Country 2024 & 2032
- Figure 27: North America IT Robotic Automation Industry Revenue (Million), by Deployment 2024 & 2032
- Figure 28: North America IT Robotic Automation Industry Volume (K Unit), by Deployment 2024 & 2032
- Figure 29: North America IT Robotic Automation Industry Revenue Share (%), by Deployment 2024 & 2032
- Figure 30: North America IT Robotic Automation Industry Volume Share (%), by Deployment 2024 & 2032
- Figure 31: North America IT Robotic Automation Industry Revenue (Million), by Solution 2024 & 2032
- Figure 32: North America IT Robotic Automation Industry Volume (K Unit), by Solution 2024 & 2032
- Figure 33: North America IT Robotic Automation Industry Revenue Share (%), by Solution 2024 & 2032
- Figure 34: North America IT Robotic Automation Industry Volume Share (%), by Solution 2024 & 2032
- Figure 35: North America IT Robotic Automation Industry Revenue (Million), by Size of Enterprise 2024 & 2032
- Figure 36: North America IT Robotic Automation Industry Volume (K Unit), by Size of Enterprise 2024 & 2032
- Figure 37: North America IT Robotic Automation Industry Revenue Share (%), by Size of Enterprise 2024 & 2032
- Figure 38: North America IT Robotic Automation Industry Volume Share (%), by Size of Enterprise 2024 & 2032
- Figure 39: North America IT Robotic Automation Industry Revenue (Million), by End User Industry 2024 & 2032
- Figure 40: North America IT Robotic Automation Industry Volume (K Unit), by End User Industry 2024 & 2032
- Figure 41: North America IT Robotic Automation Industry Revenue Share (%), by End User Industry 2024 & 2032
- Figure 42: North America IT Robotic Automation Industry Volume Share (%), by End User Industry 2024 & 2032
- Figure 43: North America IT Robotic Automation Industry Revenue (Million), by Country 2024 & 2032
- Figure 44: North America IT Robotic Automation Industry Volume (K Unit), by Country 2024 & 2032
- Figure 45: North America IT Robotic Automation Industry Revenue Share (%), by Country 2024 & 2032
- Figure 46: North America IT Robotic Automation Industry Volume Share (%), by Country 2024 & 2032
- Figure 47: Europe IT Robotic Automation Industry Revenue (Million), by Deployment 2024 & 2032
- Figure 48: Europe IT Robotic Automation Industry Volume (K Unit), by Deployment 2024 & 2032
- Figure 49: Europe IT Robotic Automation Industry Revenue Share (%), by Deployment 2024 & 2032
- Figure 50: Europe IT Robotic Automation Industry Volume Share (%), by Deployment 2024 & 2032
- Figure 51: Europe IT Robotic Automation Industry Revenue (Million), by Solution 2024 & 2032
- Figure 52: Europe IT Robotic Automation Industry Volume (K Unit), by Solution 2024 & 2032
- Figure 53: Europe IT Robotic Automation Industry Revenue Share (%), by Solution 2024 & 2032
- Figure 54: Europe IT Robotic Automation Industry Volume Share (%), by Solution 2024 & 2032
- Figure 55: Europe IT Robotic Automation Industry Revenue (Million), by Size of Enterprise 2024 & 2032
- Figure 56: Europe IT Robotic Automation Industry Volume (K Unit), by Size of Enterprise 2024 & 2032
- Figure 57: Europe IT Robotic Automation Industry Revenue Share (%), by Size of Enterprise 2024 & 2032
- Figure 58: Europe IT Robotic Automation Industry Volume Share (%), by Size of Enterprise 2024 & 2032
- Figure 59: Europe IT Robotic Automation Industry Revenue (Million), by End User Industry 2024 & 2032
- Figure 60: Europe IT Robotic Automation Industry Volume (K Unit), by End User Industry 2024 & 2032
- Figure 61: Europe IT Robotic Automation Industry Revenue Share (%), by End User Industry 2024 & 2032
- Figure 62: Europe IT Robotic Automation Industry Volume Share (%), by End User Industry 2024 & 2032
- Figure 63: Europe IT Robotic Automation Industry Revenue (Million), by Country 2024 & 2032
- Figure 64: Europe IT Robotic Automation Industry Volume (K Unit), by Country 2024 & 2032
- Figure 65: Europe IT Robotic Automation Industry Revenue Share (%), by Country 2024 & 2032
- Figure 66: Europe IT Robotic Automation Industry Volume Share (%), by Country 2024 & 2032
- Figure 67: Asia Pacific IT Robotic Automation Industry Revenue (Million), by Deployment 2024 & 2032
- Figure 68: Asia Pacific IT Robotic Automation Industry Volume (K Unit), by Deployment 2024 & 2032
- Figure 69: Asia Pacific IT Robotic Automation Industry Revenue Share (%), by Deployment 2024 & 2032
- Figure 70: Asia Pacific IT Robotic Automation Industry Volume Share (%), by Deployment 2024 & 2032
- Figure 71: Asia Pacific IT Robotic Automation Industry Revenue (Million), by Solution 2024 & 2032
- Figure 72: Asia Pacific IT Robotic Automation Industry Volume (K Unit), by Solution 2024 & 2032
- Figure 73: Asia Pacific IT Robotic Automation Industry Revenue Share (%), by Solution 2024 & 2032
- Figure 74: Asia Pacific IT Robotic Automation Industry Volume Share (%), by Solution 2024 & 2032
- Figure 75: Asia Pacific IT Robotic Automation Industry Revenue (Million), by Size of Enterprise 2024 & 2032
- Figure 76: Asia Pacific IT Robotic Automation Industry Volume (K Unit), by Size of Enterprise 2024 & 2032
- Figure 77: Asia Pacific IT Robotic Automation Industry Revenue Share (%), by Size of Enterprise 2024 & 2032
- Figure 78: Asia Pacific IT Robotic Automation Industry Volume Share (%), by Size of Enterprise 2024 & 2032
- Figure 79: Asia Pacific IT Robotic Automation Industry Revenue (Million), by End User Industry 2024 & 2032
- Figure 80: Asia Pacific IT Robotic Automation Industry Volume (K Unit), by End User Industry 2024 & 2032
- Figure 81: Asia Pacific IT Robotic Automation Industry Revenue Share (%), by End User Industry 2024 & 2032
- Figure 82: Asia Pacific IT Robotic Automation Industry Volume Share (%), by End User Industry 2024 & 2032
- Figure 83: Asia Pacific IT Robotic Automation Industry Revenue (Million), by Country 2024 & 2032
- Figure 84: Asia Pacific IT Robotic Automation Industry Volume (K Unit), by Country 2024 & 2032
- Figure 85: Asia Pacific IT Robotic Automation Industry Revenue Share (%), by Country 2024 & 2032
- Figure 86: Asia Pacific IT Robotic Automation Industry Volume Share (%), by Country 2024 & 2032
- Figure 87: Latin America IT Robotic Automation Industry Revenue (Million), by Deployment 2024 & 2032
- Figure 88: Latin America IT Robotic Automation Industry Volume (K Unit), by Deployment 2024 & 2032
- Figure 89: Latin America IT Robotic Automation Industry Revenue Share (%), by Deployment 2024 & 2032
- Figure 90: Latin America IT Robotic Automation Industry Volume Share (%), by Deployment 2024 & 2032
- Figure 91: Latin America IT Robotic Automation Industry Revenue (Million), by Solution 2024 & 2032
- Figure 92: Latin America IT Robotic Automation Industry Volume (K Unit), by Solution 2024 & 2032
- Figure 93: Latin America IT Robotic Automation Industry Revenue Share (%), by Solution 2024 & 2032
- Figure 94: Latin America IT Robotic Automation Industry Volume Share (%), by Solution 2024 & 2032
- Figure 95: Latin America IT Robotic Automation Industry Revenue (Million), by Size of Enterprise 2024 & 2032
- Figure 96: Latin America IT Robotic Automation Industry Volume (K Unit), by Size of Enterprise 2024 & 2032
- Figure 97: Latin America IT Robotic Automation Industry Revenue Share (%), by Size of Enterprise 2024 & 2032
- Figure 98: Latin America IT Robotic Automation Industry Volume Share (%), by Size of Enterprise 2024 & 2032
- Figure 99: Latin America IT Robotic Automation Industry Revenue (Million), by End User Industry 2024 & 2032
- Figure 100: Latin America IT Robotic Automation Industry Volume (K Unit), by End User Industry 2024 & 2032
- Figure 101: Latin America IT Robotic Automation Industry Revenue Share (%), by End User Industry 2024 & 2032
- Figure 102: Latin America IT Robotic Automation Industry Volume Share (%), by End User Industry 2024 & 2032
- Figure 103: Latin America IT Robotic Automation Industry Revenue (Million), by Country 2024 & 2032
- Figure 104: Latin America IT Robotic Automation Industry Volume (K Unit), by Country 2024 & 2032
- Figure 105: Latin America IT Robotic Automation Industry Revenue Share (%), by Country 2024 & 2032
- Figure 106: Latin America IT Robotic Automation Industry Volume Share (%), by Country 2024 & 2032
- Figure 107: Middle East and Africa IT Robotic Automation Industry Revenue (Million), by Deployment 2024 & 2032
- Figure 108: Middle East and Africa IT Robotic Automation Industry Volume (K Unit), by Deployment 2024 & 2032
- Figure 109: Middle East and Africa IT Robotic Automation Industry Revenue Share (%), by Deployment 2024 & 2032
- Figure 110: Middle East and Africa IT Robotic Automation Industry Volume Share (%), by Deployment 2024 & 2032
- Figure 111: Middle East and Africa IT Robotic Automation Industry Revenue (Million), by Solution 2024 & 2032
- Figure 112: Middle East and Africa IT Robotic Automation Industry Volume (K Unit), by Solution 2024 & 2032
- Figure 113: Middle East and Africa IT Robotic Automation Industry Revenue Share (%), by Solution 2024 & 2032
- Figure 114: Middle East and Africa IT Robotic Automation Industry Volume Share (%), by Solution 2024 & 2032
- Figure 115: Middle East and Africa IT Robotic Automation Industry Revenue (Million), by Size of Enterprise 2024 & 2032
- Figure 116: Middle East and Africa IT Robotic Automation Industry Volume (K Unit), by Size of Enterprise 2024 & 2032
- Figure 117: Middle East and Africa IT Robotic Automation Industry Revenue Share (%), by Size of Enterprise 2024 & 2032
- Figure 118: Middle East and Africa IT Robotic Automation Industry Volume Share (%), by Size of Enterprise 2024 & 2032
- Figure 119: Middle East and Africa IT Robotic Automation Industry Revenue (Million), by End User Industry 2024 & 2032
- Figure 120: Middle East and Africa IT Robotic Automation Industry Volume (K Unit), by End User Industry 2024 & 2032
- Figure 121: Middle East and Africa IT Robotic Automation Industry Revenue Share (%), by End User Industry 2024 & 2032
- Figure 122: Middle East and Africa IT Robotic Automation Industry Volume Share (%), by End User Industry 2024 & 2032
- Figure 123: Middle East and Africa IT Robotic Automation Industry Revenue (Million), by Country 2024 & 2032
- Figure 124: Middle East and Africa IT Robotic Automation Industry Volume (K Unit), by Country 2024 & 2032
- Figure 125: Middle East and Africa IT Robotic Automation Industry Revenue Share (%), by Country 2024 & 2032
- Figure 126: Middle East and Africa IT Robotic Automation Industry Volume Share (%), by Country 2024 & 2032
List of Tables
- Table 1: Global IT Robotic Automation Industry Revenue Million Forecast, by Region 2019 & 2032
- Table 2: Global IT Robotic Automation Industry Volume K Unit Forecast, by Region 2019 & 2032
- Table 3: Global IT Robotic Automation Industry Revenue Million Forecast, by Deployment 2019 & 2032
- Table 4: Global IT Robotic Automation Industry Volume K Unit Forecast, by Deployment 2019 & 2032
- Table 5: Global IT Robotic Automation Industry Revenue Million Forecast, by Solution 2019 & 2032
- Table 6: Global IT Robotic Automation Industry Volume K Unit Forecast, by Solution 2019 & 2032
- Table 7: Global IT Robotic Automation Industry Revenue Million Forecast, by Size of Enterprise 2019 & 2032
- Table 8: Global IT Robotic Automation Industry Volume K Unit Forecast, by Size of Enterprise 2019 & 2032
- Table 9: Global IT Robotic Automation Industry Revenue Million Forecast, by End User Industry 2019 & 2032
- Table 10: Global IT Robotic Automation Industry Volume K Unit Forecast, by End User Industry 2019 & 2032
- Table 11: Global IT Robotic Automation Industry Revenue Million Forecast, by Region 2019 & 2032
- Table 12: Global IT Robotic Automation Industry Volume K Unit Forecast, by Region 2019 & 2032
- Table 13: Global IT Robotic Automation Industry Revenue Million Forecast, by Country 2019 & 2032
- Table 14: Global IT Robotic Automation Industry Volume K Unit Forecast, by Country 2019 & 2032
- Table 15: United States IT Robotic Automation Industry Revenue (Million) Forecast, by Application 2019 & 2032
- Table 16: United States IT Robotic Automation Industry Volume (K Unit) Forecast, by Application 2019 & 2032
- Table 17: Canada IT Robotic Automation Industry Revenue (Million) Forecast, by Application 2019 & 2032
- Table 18: Canada IT Robotic Automation Industry Volume (K Unit) Forecast, by Application 2019 & 2032
- Table 19: Mexico IT Robotic Automation Industry Revenue (Million) Forecast, by Application 2019 & 2032
- Table 20: Mexico IT Robotic Automation Industry Volume (K Unit) Forecast, by Application 2019 & 2032
- Table 21: Global IT Robotic Automation Industry Revenue Million Forecast, by Country 2019 & 2032
- Table 22: Global IT Robotic Automation Industry Volume K Unit Forecast, by Country 2019 & 2032
- Table 23: Germany IT Robotic Automation Industry Revenue (Million) Forecast, by Application 2019 & 2032
- Table 24: Germany IT Robotic Automation Industry Volume (K Unit) Forecast, by Application 2019 & 2032
- Table 25: United Kingdom IT Robotic Automation Industry Revenue (Million) Forecast, by Application 2019 & 2032
- Table 26: United Kingdom IT Robotic Automation Industry Volume (K Unit) Forecast, by Application 2019 & 2032
- Table 27: France IT Robotic Automation Industry Revenue (Million) Forecast, by Application 2019 & 2032
- Table 28: France IT Robotic Automation Industry Volume (K Unit) Forecast, by Application 2019 & 2032
- Table 29: Spain IT Robotic Automation Industry Revenue (Million) Forecast, by Application 2019 & 2032
- Table 30: Spain IT Robotic Automation Industry Volume (K Unit) Forecast, by Application 2019 & 2032
- Table 31: Italy IT Robotic Automation Industry Revenue (Million) Forecast, by Application 2019 & 2032
- Table 32: Italy IT Robotic Automation Industry Volume (K Unit) Forecast, by Application 2019 & 2032
- Table 33: Spain IT Robotic Automation Industry Revenue (Million) Forecast, by Application 2019 & 2032
- Table 34: Spain IT Robotic Automation Industry Volume (K Unit) Forecast, by Application 2019 & 2032
- Table 35: Belgium IT Robotic Automation Industry Revenue (Million) Forecast, by Application 2019 & 2032
- Table 36: Belgium IT Robotic Automation Industry Volume (K Unit) Forecast, by Application 2019 & 2032
- Table 37: Netherland IT Robotic Automation Industry Revenue (Million) Forecast, by Application 2019 & 2032
- Table 38: Netherland IT Robotic Automation Industry Volume (K Unit) Forecast, by Application 2019 & 2032
- Table 39: Nordics IT Robotic Automation Industry Revenue (Million) Forecast, by Application 2019 & 2032
- Table 40: Nordics IT Robotic Automation Industry Volume (K Unit) Forecast, by Application 2019 & 2032
- Table 41: Rest of Europe IT Robotic Automation Industry Revenue (Million) Forecast, by Application 2019 & 2032
- Table 42: Rest of Europe IT Robotic Automation Industry Volume (K Unit) Forecast, by Application 2019 & 2032
- Table 43: Global IT Robotic Automation Industry Revenue Million Forecast, by Country 2019 & 2032
- Table 44: Global IT Robotic Automation Industry Volume K Unit Forecast, by Country 2019 & 2032
- Table 45: China IT Robotic Automation Industry Revenue (Million) Forecast, by Application 2019 & 2032
- Table 46: China IT Robotic Automation Industry Volume (K Unit) Forecast, by Application 2019 & 2032
- Table 47: Japan IT Robotic Automation Industry Revenue (Million) Forecast, by Application 2019 & 2032
- Table 48: Japan IT Robotic Automation Industry Volume (K Unit) Forecast, by Application 2019 & 2032
- Table 49: India IT Robotic Automation Industry Revenue (Million) Forecast, by Application 2019 & 2032
- Table 50: India IT Robotic Automation Industry Volume (K Unit) Forecast, by Application 2019 & 2032
- Table 51: South Korea IT Robotic Automation Industry Revenue (Million) Forecast, by Application 2019 & 2032
- Table 52: South Korea IT Robotic Automation Industry Volume (K Unit) Forecast, by Application 2019 & 2032
- Table 53: Southeast Asia IT Robotic Automation Industry Revenue (Million) Forecast, by Application 2019 & 2032
- Table 54: Southeast Asia IT Robotic Automation Industry Volume (K Unit) Forecast, by Application 2019 & 2032
- Table 55: Australia IT Robotic Automation Industry Revenue (Million) Forecast, by Application 2019 & 2032
- Table 56: Australia IT Robotic Automation Industry Volume (K Unit) Forecast, by Application 2019 & 2032
- Table 57: Indonesia IT Robotic Automation Industry Revenue (Million) Forecast, by Application 2019 & 2032
- Table 58: Indonesia IT Robotic Automation Industry Volume (K Unit) Forecast, by Application 2019 & 2032
- Table 59: Phillipes IT Robotic Automation Industry Revenue (Million) Forecast, by Application 2019 & 2032
- Table 60: Phillipes IT Robotic Automation Industry Volume (K Unit) Forecast, by Application 2019 & 2032
- Table 61: Singapore IT Robotic Automation Industry Revenue (Million) Forecast, by Application 2019 & 2032
- Table 62: Singapore IT Robotic Automation Industry Volume (K Unit) Forecast, by Application 2019 & 2032
- Table 63: Thailandc IT Robotic Automation Industry Revenue (Million) Forecast, by Application 2019 & 2032
- Table 64: Thailandc IT Robotic Automation Industry Volume (K Unit) Forecast, by Application 2019 & 2032
- Table 65: Rest of Asia Pacific IT Robotic Automation Industry Revenue (Million) Forecast, by Application 2019 & 2032
- Table 66: Rest of Asia Pacific IT Robotic Automation Industry Volume (K Unit) Forecast, by Application 2019 & 2032
- Table 67: Global IT Robotic Automation Industry Revenue Million Forecast, by Country 2019 & 2032
- Table 68: Global IT Robotic Automation Industry Volume K Unit Forecast, by Country 2019 & 2032
- Table 69: Brazil IT Robotic Automation Industry Revenue (Million) Forecast, by Application 2019 & 2032
- Table 70: Brazil IT Robotic Automation Industry Volume (K Unit) Forecast, by Application 2019 & 2032
- Table 71: Argentina IT Robotic Automation Industry Revenue (Million) Forecast, by Application 2019 & 2032
- Table 72: Argentina IT Robotic Automation Industry Volume (K Unit) Forecast, by Application 2019 & 2032
- Table 73: Peru IT Robotic Automation Industry Revenue (Million) Forecast, by Application 2019 & 2032
- Table 74: Peru IT Robotic Automation Industry Volume (K Unit) Forecast, by Application 2019 & 2032
- Table 75: Chile IT Robotic Automation Industry Revenue (Million) Forecast, by Application 2019 & 2032
- Table 76: Chile IT Robotic Automation Industry Volume (K Unit) Forecast, by Application 2019 & 2032
- Table 77: Colombia IT Robotic Automation Industry Revenue (Million) Forecast, by Application 2019 & 2032
- Table 78: Colombia IT Robotic Automation Industry Volume (K Unit) Forecast, by Application 2019 & 2032
- Table 79: Ecuador IT Robotic Automation Industry Revenue (Million) Forecast, by Application 2019 & 2032
- Table 80: Ecuador IT Robotic Automation Industry Volume (K Unit) Forecast, by Application 2019 & 2032
- Table 81: Venezuela IT Robotic Automation Industry Revenue (Million) Forecast, by Application 2019 & 2032
- Table 82: Venezuela IT Robotic Automation Industry Volume (K Unit) Forecast, by Application 2019 & 2032
- Table 83: Rest of South America IT Robotic Automation Industry Revenue (Million) Forecast, by Application 2019 & 2032
- Table 84: Rest of South America IT Robotic Automation Industry Volume (K Unit) Forecast, by Application 2019 & 2032
- Table 85: Global IT Robotic Automation Industry Revenue Million Forecast, by Country 2019 & 2032
- Table 86: Global IT Robotic Automation Industry Volume K Unit Forecast, by Country 2019 & 2032
- Table 87: United States IT Robotic Automation Industry Revenue (Million) Forecast, by Application 2019 & 2032
- Table 88: United States IT Robotic Automation Industry Volume (K Unit) Forecast, by Application 2019 & 2032
- Table 89: Canada IT Robotic Automation Industry Revenue (Million) Forecast, by Application 2019 & 2032
- Table 90: Canada IT Robotic Automation Industry Volume (K Unit) Forecast, by Application 2019 & 2032
- Table 91: Mexico IT Robotic Automation Industry Revenue (Million) Forecast, by Application 2019 & 2032
- Table 92: Mexico IT Robotic Automation Industry Volume (K Unit) Forecast, by Application 2019 & 2032
- Table 93: Global IT Robotic Automation Industry Revenue Million Forecast, by Country 2019 & 2032
- Table 94: Global IT Robotic Automation Industry Volume K Unit Forecast, by Country 2019 & 2032
- Table 95: United Arab Emirates IT Robotic Automation Industry Revenue (Million) Forecast, by Application 2019 & 2032
- Table 96: United Arab Emirates IT Robotic Automation Industry Volume (K Unit) Forecast, by Application 2019 & 2032
- Table 97: Saudi Arabia IT Robotic Automation Industry Revenue (Million) Forecast, by Application 2019 & 2032
- Table 98: Saudi Arabia IT Robotic Automation Industry Volume (K Unit) Forecast, by Application 2019 & 2032
- Table 99: South Africa IT Robotic Automation Industry Revenue (Million) Forecast, by Application 2019 & 2032
- Table 100: South Africa IT Robotic Automation Industry Volume (K Unit) Forecast, by Application 2019 & 2032
- Table 101: Rest of Middle East and Africa IT Robotic Automation Industry Revenue (Million) Forecast, by Application 2019 & 2032
- Table 102: Rest of Middle East and Africa IT Robotic Automation Industry Volume (K Unit) Forecast, by Application 2019 & 2032
- Table 103: Global IT Robotic Automation Industry Revenue Million Forecast, by Deployment 2019 & 2032
- Table 104: Global IT Robotic Automation Industry Volume K Unit Forecast, by Deployment 2019 & 2032
- Table 105: Global IT Robotic Automation Industry Revenue Million Forecast, by Solution 2019 & 2032
- Table 106: Global IT Robotic Automation Industry Volume K Unit Forecast, by Solution 2019 & 2032
- Table 107: Global IT Robotic Automation Industry Revenue Million Forecast, by Size of Enterprise 2019 & 2032
- Table 108: Global IT Robotic Automation Industry Volume K Unit Forecast, by Size of Enterprise 2019 & 2032
- Table 109: Global IT Robotic Automation Industry Revenue Million Forecast, by End User Industry 2019 & 2032
- Table 110: Global IT Robotic Automation Industry Volume K Unit Forecast, by End User Industry 2019 & 2032
- Table 111: Global IT Robotic Automation Industry Revenue Million Forecast, by Country 2019 & 2032
- Table 112: Global IT Robotic Automation Industry Volume K Unit Forecast, by Country 2019 & 2032
- Table 113: Global IT Robotic Automation Industry Revenue Million Forecast, by Deployment 2019 & 2032
- Table 114: Global IT Robotic Automation Industry Volume K Unit Forecast, by Deployment 2019 & 2032
- Table 115: Global IT Robotic Automation Industry Revenue Million Forecast, by Solution 2019 & 2032
- Table 116: Global IT Robotic Automation Industry Volume K Unit Forecast, by Solution 2019 & 2032
- Table 117: Global IT Robotic Automation Industry Revenue Million Forecast, by Size of Enterprise 2019 & 2032
- Table 118: Global IT Robotic Automation Industry Volume K Unit Forecast, by Size of Enterprise 2019 & 2032
- Table 119: Global IT Robotic Automation Industry Revenue Million Forecast, by End User Industry 2019 & 2032
- Table 120: Global IT Robotic Automation Industry Volume K Unit Forecast, by End User Industry 2019 & 2032
- Table 121: Global IT Robotic Automation Industry Revenue Million Forecast, by Country 2019 & 2032
- Table 122: Global IT Robotic Automation Industry Volume K Unit Forecast, by Country 2019 & 2032
- Table 123: Global IT Robotic Automation Industry Revenue Million Forecast, by Deployment 2019 & 2032
- Table 124: Global IT Robotic Automation Industry Volume K Unit Forecast, by Deployment 2019 & 2032
- Table 125: Global IT Robotic Automation Industry Revenue Million Forecast, by Solution 2019 & 2032
- Table 126: Global IT Robotic Automation Industry Volume K Unit Forecast, by Solution 2019 & 2032
- Table 127: Global IT Robotic Automation Industry Revenue Million Forecast, by Size of Enterprise 2019 & 2032
- Table 128: Global IT Robotic Automation Industry Volume K Unit Forecast, by Size of Enterprise 2019 & 2032
- Table 129: Global IT Robotic Automation Industry Revenue Million Forecast, by End User Industry 2019 & 2032
- Table 130: Global IT Robotic Automation Industry Volume K Unit Forecast, by End User Industry 2019 & 2032
- Table 131: Global IT Robotic Automation Industry Revenue Million Forecast, by Country 2019 & 2032
- Table 132: Global IT Robotic Automation Industry Volume K Unit Forecast, by Country 2019 & 2032
- Table 133: Global IT Robotic Automation Industry Revenue Million Forecast, by Deployment 2019 & 2032
- Table 134: Global IT Robotic Automation Industry Volume K Unit Forecast, by Deployment 2019 & 2032
- Table 135: Global IT Robotic Automation Industry Revenue Million Forecast, by Solution 2019 & 2032
- Table 136: Global IT Robotic Automation Industry Volume K Unit Forecast, by Solution 2019 & 2032
- Table 137: Global IT Robotic Automation Industry Revenue Million Forecast, by Size of Enterprise 2019 & 2032
- Table 138: Global IT Robotic Automation Industry Volume K Unit Forecast, by Size of Enterprise 2019 & 2032
- Table 139: Global IT Robotic Automation Industry Revenue Million Forecast, by End User Industry 2019 & 2032
- Table 140: Global IT Robotic Automation Industry Volume K Unit Forecast, by End User Industry 2019 & 2032
- Table 141: Global IT Robotic Automation Industry Revenue Million Forecast, by Country 2019 & 2032
- Table 142: Global IT Robotic Automation Industry Volume K Unit Forecast, by Country 2019 & 2032
- Table 143: Global IT Robotic Automation Industry Revenue Million Forecast, by Deployment 2019 & 2032
- Table 144: Global IT Robotic Automation Industry Volume K Unit Forecast, by Deployment 2019 & 2032
- Table 145: Global IT Robotic Automation Industry Revenue Million Forecast, by Solution 2019 & 2032
- Table 146: Global IT Robotic Automation Industry Volume K Unit Forecast, by Solution 2019 & 2032
- Table 147: Global IT Robotic Automation Industry Revenue Million Forecast, by Size of Enterprise 2019 & 2032
- Table 148: Global IT Robotic Automation Industry Volume K Unit Forecast, by Size of Enterprise 2019 & 2032
- Table 149: Global IT Robotic Automation Industry Revenue Million Forecast, by End User Industry 2019 & 2032
- Table 150: Global IT Robotic Automation Industry Volume K Unit Forecast, by End User Industry 2019 & 2032
- Table 151: Global IT Robotic Automation Industry Revenue Million Forecast, by Country 2019 & 2032
- Table 152: Global IT Robotic Automation Industry Volume K Unit Forecast, by Country 2019 & 2032
Frequently Asked Questions
1. What is the projected Compound Annual Growth Rate (CAGR) of the IT Robotic Automation Industry?
The projected CAGR is approximately 29.70%.
2. Which companies are prominent players in the IT Robotic Automation Industry?
Key companies in the market include Jacada Inc, Nice Robotic Automation Ltd, Kofax Inc (Thoma Bravo LLC), HelpSystems LLC (HGGC), Jidoka, UIPath Inc, Datamatics Global Services Limited, Automation Anywhere Inc, Be Informed BV (Hoogenberg Beheer BV), Pegasystems Inc, AutomationEdge Technologies Inc, Blue Prism Group PLC, CGI Inc.
3. What are the main segments of the IT Robotic Automation Industry?
The market segments include Deployment, Solution, Size of Enterprise, End User Industry.
4. Can you provide details about the market size?
The market size is estimated to be USD 4.02 Million as of 2022.
5. What are some drivers contributing to market growth?
Retail Sector to hold major share in RPA Market; Adoption of AI- and Cloud-based Solutions for Internal Efficiency among SMEs.
6. What are the notable trends driving market growth?
Retail Sector to hold major share in RPA Market.
7. Are there any restraints impacting market growth?
Data Security Concerns.
8. Can you provide examples of recent developments in the market?
September 2022 - UiPath, a leading enterprise automation software company, strengthened its partnership with Snowflake, the Data Cloud company, by launching a new bi-directional integration that extends the value of automation across the enterprise. UiPath and Snowflake enable joint customers to design and build workflows based on 360-degree views of trusted and accessible data on Snowflake's platform. By leveraging the Snowflake Data Cloud, UiPath robots can quickly connect data directly to business processes in the Data Cloud without using complex code, speeding up time to value.
9. What pricing options are available for accessing the report?
Pricing options include single-user, multi-user, and enterprise licenses priced at USD 4750, USD 5250, and USD 8750 respectively.
10. Is the market size provided in terms of value or volume?
The market size is provided in terms of value, measured in Million and volume, measured in K Unit.
11. Are there any specific market keywords associated with the report?
Yes, the market keyword associated with the report is "IT Robotic Automation Industry," which aids in identifying and referencing the specific market segment covered.
12. How do I determine which pricing option suits my needs best?
The pricing options vary based on user requirements and access needs. Individual users may opt for single-user licenses, while businesses requiring broader access may choose multi-user or enterprise licenses for cost-effective access to the report.
13. Are there any additional resources or data provided in the IT Robotic Automation Industry report?
While the report offers comprehensive insights, it's advisable to review the specific contents or supplementary materials provided to ascertain if additional resources or data are available.
14. How can I stay updated on further developments or reports in the IT Robotic Automation Industry?
To stay informed about further developments, trends, and reports in the IT Robotic Automation Industry, consider subscribing to industry newsletters, following relevant companies and organizations, or regularly checking reputable industry news sources and publications.
Methodology
Step 1 - Identification of Relevant Samples Size from Population Database


Step 2 - Approaches for Defining Global Market Size (Value, Volume* & Price*)

Note*: In applicable scenarios
Step 3 - Data Sources
Primary Research
- Web Analytics
- Survey Reports
- Research Institute
- Latest Research Reports
- Opinion Leaders
Secondary Research
- Annual Reports
- White Paper
- Latest Press Release
- Industry Association
- Paid Database
- Investor Presentations

Step 4 - Data Triangulation
Involves using different sources of information in order to increase the validity of a study
These sources are likely to be stakeholders in a program - participants, other researchers, program staff, other community members, and so on.
Then we put all data in single framework & apply various statistical tools to find out the dynamic on the market.
During the analysis stage, feedback from the stakeholder groups would be compared to determine areas of agreement as well as areas of divergence
