

Key Insights
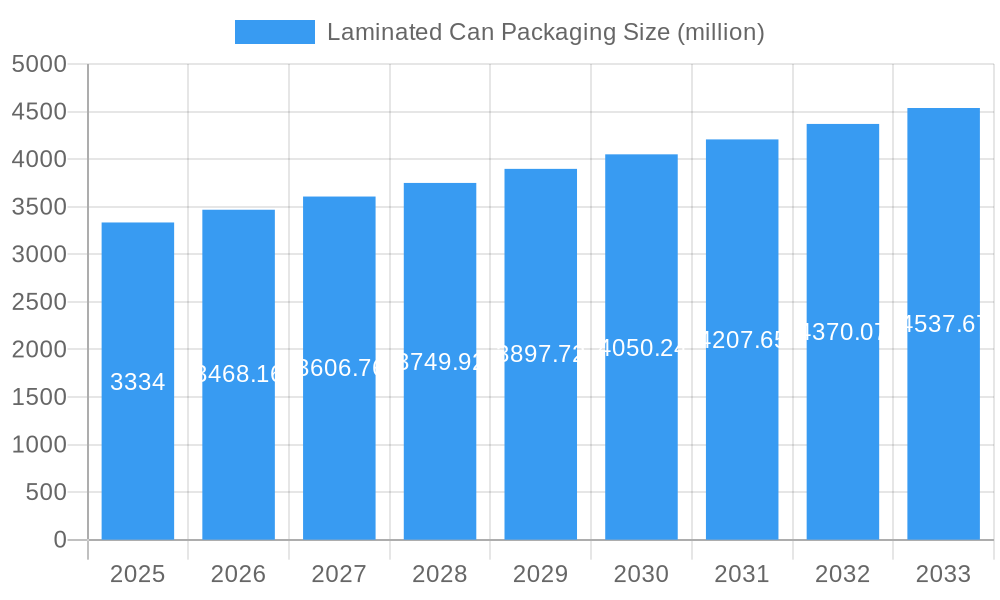
The laminated can packaging market, currently valued at $3334 million in 2025, is projected to experience steady growth, exhibiting a compound annual growth rate (CAGR) of 4% from 2025 to 2033. This growth is driven by several factors. The increasing demand for convenient and shelf-stable food and beverage products fuels the need for robust and aesthetically appealing packaging solutions. Laminated cans offer superior barrier properties against oxygen, moisture, and light, ensuring extended product shelf life and maintaining quality. Furthermore, the versatility of laminated cans allows for diverse designs and branding opportunities, catering to the preferences of consumers and enhancing brand visibility. The market is witnessing a trend toward sustainable and eco-friendly packaging materials, pushing manufacturers to explore biodegradable and recyclable options within laminated can technology. This shift towards sustainability is expected to drive innovation and further expansion in the market. However, fluctuations in raw material prices and stringent regulatory requirements regarding packaging materials pose challenges to the market's consistent growth. Competition among established players like HUIYANG Packaging Factory, RMCL, DaklaPack, TCL Packaging, SUNPACK CORPORATION, OPM Group, API, Glenroy, BPI Protec, and Granitol is intense, driving innovation and price competitiveness.
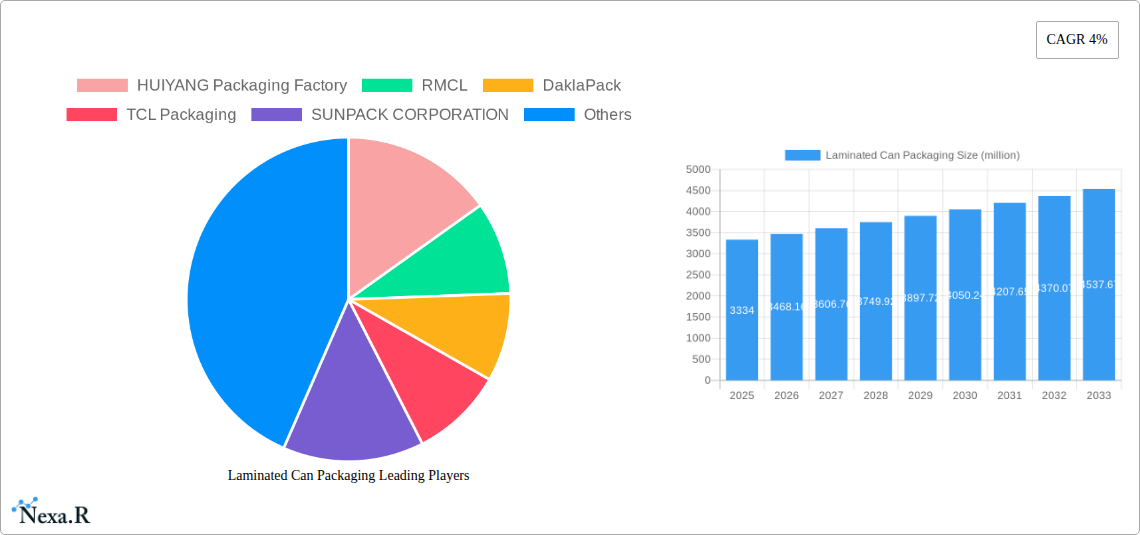
Laminated Can Packaging Market Size (In Billion)
The forecast period (2025-2033) anticipates a continued upward trajectory for the laminated can packaging market. Growth will be fueled by expanding consumer bases in developing economies, increasing disposable incomes, and the proliferation of e-commerce, leading to heightened demand for secure and tamper-evident packaging. Technological advancements in lamination techniques and the incorporation of smart packaging features are also expected to enhance the market's appeal. Despite the potential restraints, the inherent advantages of laminated cans in terms of protection, aesthetics, and sustainability are likely to sustain market expansion throughout the forecast period. Geographical expansion into emerging markets will play a significant role in driving overall market growth. The market is segmented by material type, application, and region, presenting various investment opportunities for stakeholders.
Laminated Can Packaging Company Market Share
Laminated Can Packaging Market Report: 2019-2033
This comprehensive report provides an in-depth analysis of the global laminated can packaging market, offering invaluable insights for industry professionals, investors, and strategic decision-makers. Covering the period 2019-2033, with a base year of 2025, this report meticulously examines market dynamics, growth trends, regional dominance, and the competitive landscape. The report forecasts a market size of xx million units by 2033, presenting a CAGR of xx% during the forecast period (2025-2033). Parent markets include food and beverage packaging, while child markets encompass various segments like pet food, confectionery, and personal care products.
Laminated Can Packaging Market Dynamics & Structure
The laminated can packaging market is characterized by moderate concentration, with key players holding significant market share. Technological innovation, driven by the demand for sustainable and high-performance packaging solutions, is a crucial factor shaping market dynamics. Stringent regulatory frameworks regarding material safety and recyclability are influencing product development and manufacturing processes. The market faces competition from alternative packaging materials like flexible pouches and rigid plastic containers. End-user demographics, with a rising preference for convenient and sustainable packaging, are driving market growth. M&A activities in the sector are relatively frequent, with an estimated xx merger and acquisition deals recorded between 2019 and 2024.
- Market Concentration: Moderately concentrated, with top 5 players holding approximately xx% market share in 2024.
- Technological Innovation: Focus on lightweighting, improved barrier properties, and sustainable materials (e.g., recycled content).
- Regulatory Landscape: Stringent regulations on food safety and recyclability are driving innovation in sustainable packaging materials.
- Competitive Substitutes: Flexible pouches, rigid plastic containers, and alternative metal packaging pose competitive challenges.
- End-User Demographics: Growing demand from the food & beverage, pet food, and personal care industries.
- M&A Activity: Approximately xx M&A deals observed during 2019-2024, driven by consolidation and expansion strategies.
Laminated Can Packaging Growth Trends & Insights
The global laminated can packaging market experienced steady growth during the historical period (2019-2024), driven by increasing demand across various end-use sectors. The market size reached approximately xx million units in 2024. Adoption rates are increasing, particularly in developing economies, due to factors like rising disposable incomes and changing consumer preferences. Technological advancements such as improved printing techniques and enhanced barrier properties are further fueling market expansion. Consumer behavior shifts towards convenient and sustainable packaging are creating new opportunities. The market is expected to witness a CAGR of xx% during the forecast period (2025-2033), reaching xx million units by 2033. Market penetration remains relatively high in developed regions, but growth potential lies in untapped markets in developing economies.
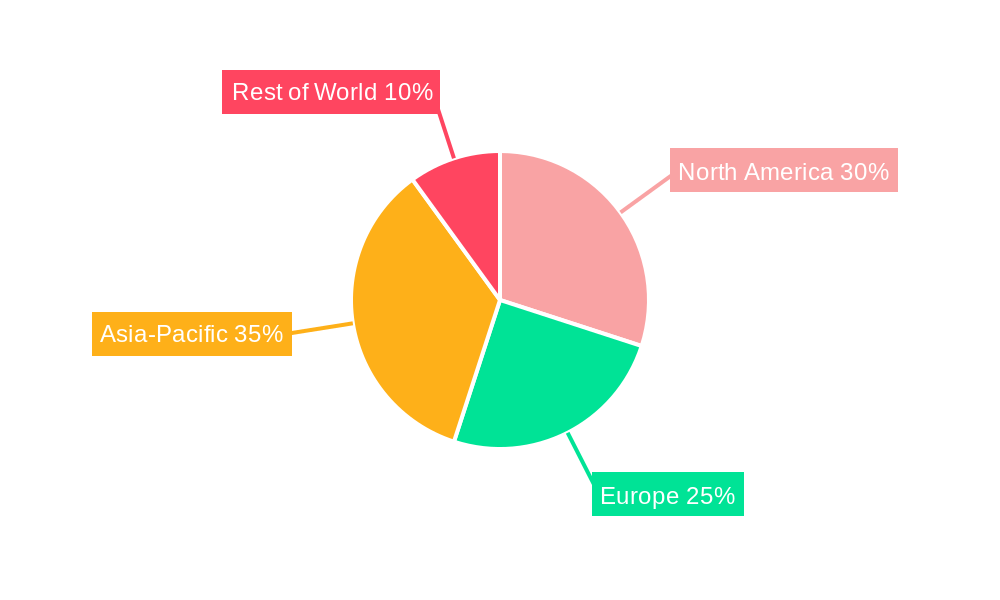
Dominant Regions, Countries, or Segments in Laminated Can Packaging
The North American region currently holds the largest market share in laminated can packaging, followed by Europe and Asia-Pacific. Strong economic growth, advanced infrastructure, and established manufacturing capabilities contribute to North America's dominance. However, rapidly developing economies in Asia-Pacific, particularly in countries like China and India, are driving significant growth potential in this region. The food and beverage segment remains the largest end-use sector, accounting for approximately xx% of the total market in 2024.
- North America: Strong economic growth, established infrastructure, and high consumer spending.
- Europe: Mature market with high adoption rates and focus on sustainable packaging solutions.
- Asia-Pacific: Rapidly growing economies, rising disposable incomes, and increasing demand for convenient packaging.
- Food & Beverage Segment: Largest end-use sector, driven by increasing demand for processed foods and beverages.
Laminated Can Packaging Product Landscape
Laminated can packaging offers a diverse range of products, tailored to specific end-use applications. Innovations focus on improving barrier properties to extend shelf life, enhancing printability for attractive branding, and incorporating sustainable materials for improved recyclability. Unique selling propositions include enhanced durability, lightweight design, and customization options. Technological advancements in coating materials and printing techniques are driving product differentiation and expanding applications across various industries.
Key Drivers, Barriers & Challenges in Laminated Can Packaging
Key Drivers:
- Increasing demand for convenient and shelf-stable food and beverage packaging.
- Growing adoption of sustainable and eco-friendly packaging materials.
- Advancements in printing and coating technologies enhancing product appeal and functionality.
Challenges:
- Fluctuations in raw material prices, impacting production costs.
- Stringent environmental regulations requiring compliance with sustainability standards.
- Intense competition from alternative packaging solutions. The competitive landscape is further challenged by an estimated xx% price decrease in substitute packaging materials between 2019 and 2024.
Emerging Opportunities in Laminated Can Packaging
Emerging opportunities include the expansion into untapped markets in developing economies, the development of innovative applications in sectors such as pet food and personal care, and the growing demand for recyclable and compostable laminated can packaging. Further opportunities lie in personalized packaging and the integration of smart packaging technologies.
Growth Accelerators in the Laminated Can Packaging Industry
Technological breakthroughs in materials science and printing technologies are significant growth accelerators. Strategic partnerships between packaging manufacturers and brand owners are fostering innovation and driving market expansion. Market expansion strategies targeting emerging economies and new end-use applications are crucial for long-term growth.
Key Players Shaping the Laminated Can Packaging Market
- HUIYANG Packaging Factory
- RMCL
- DaklaPack
- TCL Packaging
- SUNPACK CORPORATION
- OPM Group
- API
- Glenroy
- BPI Protec
- Granitol
Notable Milestones in Laminated Can Packaging Sector
- 2020: Introduction of a new recyclable laminated can packaging material by BPI Protec.
- 2022: Merger between two major players in the North American market resulting in increased market share.
- 2023: Launch of a new high-barrier laminated can packaging by SUNPACK CORPORATION, significantly enhancing product shelf life.
In-Depth Laminated Can Packaging Market Outlook
The laminated can packaging market is poised for continued growth, driven by several factors. Technological innovations, particularly in sustainable materials and enhanced barrier properties, will continue to fuel market expansion. Strategic partnerships and market expansion into emerging economies will create new growth opportunities. The focus on sustainability and eco-friendly packaging will shape the future market landscape. The market is projected to experience robust growth, driven by consumer preferences and technological advancements.
Laminated Can Packaging Segmentation
-
1. Application
- 1.1. Food
- 1.2. Cosmetics & Personal Care
- 1.3. Pharma & Health
-
2. Type
- 2.1. ABL
- 2.2. PBL
Laminated Can Packaging Segmentation By Geography
-
1. North America
- 1.1. United States
- 1.2. Canada
- 1.3. Mexico
-
2. South America
- 2.1. Brazil
- 2.2. Argentina
- 2.3. Rest of South America
-
3. Europe
- 3.1. United Kingdom
- 3.2. Germany
- 3.3. France
- 3.4. Italy
- 3.5. Spain
- 3.6. Russia
- 3.7. Benelux
- 3.8. Nordics
- 3.9. Rest of Europe
-
4. Middle East & Africa
- 4.1. Turkey
- 4.2. Israel
- 4.3. GCC
- 4.4. North Africa
- 4.5. South Africa
- 4.6. Rest of Middle East & Africa
-
5. Asia Pacific
- 5.1. China
- 5.2. India
- 5.3. Japan
- 5.4. South Korea
- 5.5. ASEAN
- 5.6. Oceania
- 5.7. Rest of Asia Pacific
Laminated Can Packaging Regional Market Share
Geographic Coverage of Laminated Can Packaging
Laminated Can Packaging REPORT HIGHLIGHTS
| Aspects | Details |
|---|---|
| Study Period | 2020-2034 |
| Base Year | 2025 |
| Estimated Year | 2026 |
| Forecast Period | 2026-2034 |
| Historical Period | 2020-2025 |
| Growth Rate | CAGR of 4.05% from 2020-2034 |
| Segmentation |
|
Table of Contents
- 1. Introduction
- 1.1. Research Scope
- 1.2. Market Segmentation
- 1.3. Research Methodology
- 1.4. Definitions and Assumptions
- 2. Executive Summary
- 2.1. Introduction
- 3. Market Dynamics
- 3.1. Introduction
- 3.2. Market Drivers
- 3.3. Market Restrains
- 3.4. Market Trends
- 4. Market Factor Analysis
- 4.1. Porters Five Forces
- 4.2. Supply/Value Chain
- 4.3. PESTEL analysis
- 4.4. Market Entropy
- 4.5. Patent/Trademark Analysis
- 5. Global Laminated Can Packaging Analysis, Insights and Forecast, 2020-2032
- 5.1. Market Analysis, Insights and Forecast - by Application
- 5.1.1. Food
- 5.1.2. Cosmetics & Personal Care
- 5.1.3. Pharma & Health
- 5.2. Market Analysis, Insights and Forecast - by Type
- 5.2.1. ABL
- 5.2.2. PBL
- 5.3. Market Analysis, Insights and Forecast - by Region
- 5.3.1. North America
- 5.3.2. South America
- 5.3.3. Europe
- 5.3.4. Middle East & Africa
- 5.3.5. Asia Pacific
- 5.1. Market Analysis, Insights and Forecast - by Application
- 6. North America Laminated Can Packaging Analysis, Insights and Forecast, 2020-2032
- 6.1. Market Analysis, Insights and Forecast - by Application
- 6.1.1. Food
- 6.1.2. Cosmetics & Personal Care
- 6.1.3. Pharma & Health
- 6.2. Market Analysis, Insights and Forecast - by Type
- 6.2.1. ABL
- 6.2.2. PBL
- 6.1. Market Analysis, Insights and Forecast - by Application
- 7. South America Laminated Can Packaging Analysis, Insights and Forecast, 2020-2032
- 7.1. Market Analysis, Insights and Forecast - by Application
- 7.1.1. Food
- 7.1.2. Cosmetics & Personal Care
- 7.1.3. Pharma & Health
- 7.2. Market Analysis, Insights and Forecast - by Type
- 7.2.1. ABL
- 7.2.2. PBL
- 7.1. Market Analysis, Insights and Forecast - by Application
- 8. Europe Laminated Can Packaging Analysis, Insights and Forecast, 2020-2032
- 8.1. Market Analysis, Insights and Forecast - by Application
- 8.1.1. Food
- 8.1.2. Cosmetics & Personal Care
- 8.1.3. Pharma & Health
- 8.2. Market Analysis, Insights and Forecast - by Type
- 8.2.1. ABL
- 8.2.2. PBL
- 8.1. Market Analysis, Insights and Forecast - by Application
- 9. Middle East & Africa Laminated Can Packaging Analysis, Insights and Forecast, 2020-2032
- 9.1. Market Analysis, Insights and Forecast - by Application
- 9.1.1. Food
- 9.1.2. Cosmetics & Personal Care
- 9.1.3. Pharma & Health
- 9.2. Market Analysis, Insights and Forecast - by Type
- 9.2.1. ABL
- 9.2.2. PBL
- 9.1. Market Analysis, Insights and Forecast - by Application
- 10. Asia Pacific Laminated Can Packaging Analysis, Insights and Forecast, 2020-2032
- 10.1. Market Analysis, Insights and Forecast - by Application
- 10.1.1. Food
- 10.1.2. Cosmetics & Personal Care
- 10.1.3. Pharma & Health
- 10.2. Market Analysis, Insights and Forecast - by Type
- 10.2.1. ABL
- 10.2.2. PBL
- 10.1. Market Analysis, Insights and Forecast - by Application
- 11. Competitive Analysis
- 11.1. Global Market Share Analysis 2025
- 11.2. Company Profiles
- 11.2.1 HUIYANG Packaging Factory
- 11.2.1.1. Overview
- 11.2.1.2. Products
- 11.2.1.3. SWOT Analysis
- 11.2.1.4. Recent Developments
- 11.2.1.5. Financials (Based on Availability)
- 11.2.2 RMCL
- 11.2.2.1. Overview
- 11.2.2.2. Products
- 11.2.2.3. SWOT Analysis
- 11.2.2.4. Recent Developments
- 11.2.2.5. Financials (Based on Availability)
- 11.2.3 DaklaPack
- 11.2.3.1. Overview
- 11.2.3.2. Products
- 11.2.3.3. SWOT Analysis
- 11.2.3.4. Recent Developments
- 11.2.3.5. Financials (Based on Availability)
- 11.2.4 TCL Packaging
- 11.2.4.1. Overview
- 11.2.4.2. Products
- 11.2.4.3. SWOT Analysis
- 11.2.4.4. Recent Developments
- 11.2.4.5. Financials (Based on Availability)
- 11.2.5 SUNPACK CORPORATION
- 11.2.5.1. Overview
- 11.2.5.2. Products
- 11.2.5.3. SWOT Analysis
- 11.2.5.4. Recent Developments
- 11.2.5.5. Financials (Based on Availability)
- 11.2.6 OPM Group
- 11.2.6.1. Overview
- 11.2.6.2. Products
- 11.2.6.3. SWOT Analysis
- 11.2.6.4. Recent Developments
- 11.2.6.5. Financials (Based on Availability)
- 11.2.7 API
- 11.2.7.1. Overview
- 11.2.7.2. Products
- 11.2.7.3. SWOT Analysis
- 11.2.7.4. Recent Developments
- 11.2.7.5. Financials (Based on Availability)
- 11.2.8 Glenroy
- 11.2.8.1. Overview
- 11.2.8.2. Products
- 11.2.8.3. SWOT Analysis
- 11.2.8.4. Recent Developments
- 11.2.8.5. Financials (Based on Availability)
- 11.2.9 BPI Protec
- 11.2.9.1. Overview
- 11.2.9.2. Products
- 11.2.9.3. SWOT Analysis
- 11.2.9.4. Recent Developments
- 11.2.9.5. Financials (Based on Availability)
- 11.2.10 Granitol
- 11.2.10.1. Overview
- 11.2.10.2. Products
- 11.2.10.3. SWOT Analysis
- 11.2.10.4. Recent Developments
- 11.2.10.5. Financials (Based on Availability)
- 11.2.1 HUIYANG Packaging Factory
List of Figures
- Figure 1: Global Laminated Can Packaging Revenue Breakdown (undefined, %) by Region 2025 & 2033
- Figure 2: Global Laminated Can Packaging Volume Breakdown (K, %) by Region 2025 & 2033
- Figure 3: North America Laminated Can Packaging Revenue (undefined), by Application 2025 & 2033
- Figure 4: North America Laminated Can Packaging Volume (K), by Application 2025 & 2033
- Figure 5: North America Laminated Can Packaging Revenue Share (%), by Application 2025 & 2033
- Figure 6: North America Laminated Can Packaging Volume Share (%), by Application 2025 & 2033
- Figure 7: North America Laminated Can Packaging Revenue (undefined), by Type 2025 & 2033
- Figure 8: North America Laminated Can Packaging Volume (K), by Type 2025 & 2033
- Figure 9: North America Laminated Can Packaging Revenue Share (%), by Type 2025 & 2033
- Figure 10: North America Laminated Can Packaging Volume Share (%), by Type 2025 & 2033
- Figure 11: North America Laminated Can Packaging Revenue (undefined), by Country 2025 & 2033
- Figure 12: North America Laminated Can Packaging Volume (K), by Country 2025 & 2033
- Figure 13: North America Laminated Can Packaging Revenue Share (%), by Country 2025 & 2033
- Figure 14: North America Laminated Can Packaging Volume Share (%), by Country 2025 & 2033
- Figure 15: South America Laminated Can Packaging Revenue (undefined), by Application 2025 & 2033
- Figure 16: South America Laminated Can Packaging Volume (K), by Application 2025 & 2033
- Figure 17: South America Laminated Can Packaging Revenue Share (%), by Application 2025 & 2033
- Figure 18: South America Laminated Can Packaging Volume Share (%), by Application 2025 & 2033
- Figure 19: South America Laminated Can Packaging Revenue (undefined), by Type 2025 & 2033
- Figure 20: South America Laminated Can Packaging Volume (K), by Type 2025 & 2033
- Figure 21: South America Laminated Can Packaging Revenue Share (%), by Type 2025 & 2033
- Figure 22: South America Laminated Can Packaging Volume Share (%), by Type 2025 & 2033
- Figure 23: South America Laminated Can Packaging Revenue (undefined), by Country 2025 & 2033
- Figure 24: South America Laminated Can Packaging Volume (K), by Country 2025 & 2033
- Figure 25: South America Laminated Can Packaging Revenue Share (%), by Country 2025 & 2033
- Figure 26: South America Laminated Can Packaging Volume Share (%), by Country 2025 & 2033
- Figure 27: Europe Laminated Can Packaging Revenue (undefined), by Application 2025 & 2033
- Figure 28: Europe Laminated Can Packaging Volume (K), by Application 2025 & 2033
- Figure 29: Europe Laminated Can Packaging Revenue Share (%), by Application 2025 & 2033
- Figure 30: Europe Laminated Can Packaging Volume Share (%), by Application 2025 & 2033
- Figure 31: Europe Laminated Can Packaging Revenue (undefined), by Type 2025 & 2033
- Figure 32: Europe Laminated Can Packaging Volume (K), by Type 2025 & 2033
- Figure 33: Europe Laminated Can Packaging Revenue Share (%), by Type 2025 & 2033
- Figure 34: Europe Laminated Can Packaging Volume Share (%), by Type 2025 & 2033
- Figure 35: Europe Laminated Can Packaging Revenue (undefined), by Country 2025 & 2033
- Figure 36: Europe Laminated Can Packaging Volume (K), by Country 2025 & 2033
- Figure 37: Europe Laminated Can Packaging Revenue Share (%), by Country 2025 & 2033
- Figure 38: Europe Laminated Can Packaging Volume Share (%), by Country 2025 & 2033
- Figure 39: Middle East & Africa Laminated Can Packaging Revenue (undefined), by Application 2025 & 2033
- Figure 40: Middle East & Africa Laminated Can Packaging Volume (K), by Application 2025 & 2033
- Figure 41: Middle East & Africa Laminated Can Packaging Revenue Share (%), by Application 2025 & 2033
- Figure 42: Middle East & Africa Laminated Can Packaging Volume Share (%), by Application 2025 & 2033
- Figure 43: Middle East & Africa Laminated Can Packaging Revenue (undefined), by Type 2025 & 2033
- Figure 44: Middle East & Africa Laminated Can Packaging Volume (K), by Type 2025 & 2033
- Figure 45: Middle East & Africa Laminated Can Packaging Revenue Share (%), by Type 2025 & 2033
- Figure 46: Middle East & Africa Laminated Can Packaging Volume Share (%), by Type 2025 & 2033
- Figure 47: Middle East & Africa Laminated Can Packaging Revenue (undefined), by Country 2025 & 2033
- Figure 48: Middle East & Africa Laminated Can Packaging Volume (K), by Country 2025 & 2033
- Figure 49: Middle East & Africa Laminated Can Packaging Revenue Share (%), by Country 2025 & 2033
- Figure 50: Middle East & Africa Laminated Can Packaging Volume Share (%), by Country 2025 & 2033
- Figure 51: Asia Pacific Laminated Can Packaging Revenue (undefined), by Application 2025 & 2033
- Figure 52: Asia Pacific Laminated Can Packaging Volume (K), by Application 2025 & 2033
- Figure 53: Asia Pacific Laminated Can Packaging Revenue Share (%), by Application 2025 & 2033
- Figure 54: Asia Pacific Laminated Can Packaging Volume Share (%), by Application 2025 & 2033
- Figure 55: Asia Pacific Laminated Can Packaging Revenue (undefined), by Type 2025 & 2033
- Figure 56: Asia Pacific Laminated Can Packaging Volume (K), by Type 2025 & 2033
- Figure 57: Asia Pacific Laminated Can Packaging Revenue Share (%), by Type 2025 & 2033
- Figure 58: Asia Pacific Laminated Can Packaging Volume Share (%), by Type 2025 & 2033
- Figure 59: Asia Pacific Laminated Can Packaging Revenue (undefined), by Country 2025 & 2033
- Figure 60: Asia Pacific Laminated Can Packaging Volume (K), by Country 2025 & 2033
- Figure 61: Asia Pacific Laminated Can Packaging Revenue Share (%), by Country 2025 & 2033
- Figure 62: Asia Pacific Laminated Can Packaging Volume Share (%), by Country 2025 & 2033
List of Tables
- Table 1: Global Laminated Can Packaging Revenue undefined Forecast, by Application 2020 & 2033
- Table 2: Global Laminated Can Packaging Volume K Forecast, by Application 2020 & 2033
- Table 3: Global Laminated Can Packaging Revenue undefined Forecast, by Type 2020 & 2033
- Table 4: Global Laminated Can Packaging Volume K Forecast, by Type 2020 & 2033
- Table 5: Global Laminated Can Packaging Revenue undefined Forecast, by Region 2020 & 2033
- Table 6: Global Laminated Can Packaging Volume K Forecast, by Region 2020 & 2033
- Table 7: Global Laminated Can Packaging Revenue undefined Forecast, by Application 2020 & 2033
- Table 8: Global Laminated Can Packaging Volume K Forecast, by Application 2020 & 2033
- Table 9: Global Laminated Can Packaging Revenue undefined Forecast, by Type 2020 & 2033
- Table 10: Global Laminated Can Packaging Volume K Forecast, by Type 2020 & 2033
- Table 11: Global Laminated Can Packaging Revenue undefined Forecast, by Country 2020 & 2033
- Table 12: Global Laminated Can Packaging Volume K Forecast, by Country 2020 & 2033
- Table 13: United States Laminated Can Packaging Revenue (undefined) Forecast, by Application 2020 & 2033
- Table 14: United States Laminated Can Packaging Volume (K) Forecast, by Application 2020 & 2033
- Table 15: Canada Laminated Can Packaging Revenue (undefined) Forecast, by Application 2020 & 2033
- Table 16: Canada Laminated Can Packaging Volume (K) Forecast, by Application 2020 & 2033
- Table 17: Mexico Laminated Can Packaging Revenue (undefined) Forecast, by Application 2020 & 2033
- Table 18: Mexico Laminated Can Packaging Volume (K) Forecast, by Application 2020 & 2033
- Table 19: Global Laminated Can Packaging Revenue undefined Forecast, by Application 2020 & 2033
- Table 20: Global Laminated Can Packaging Volume K Forecast, by Application 2020 & 2033
- Table 21: Global Laminated Can Packaging Revenue undefined Forecast, by Type 2020 & 2033
- Table 22: Global Laminated Can Packaging Volume K Forecast, by Type 2020 & 2033
- Table 23: Global Laminated Can Packaging Revenue undefined Forecast, by Country 2020 & 2033
- Table 24: Global Laminated Can Packaging Volume K Forecast, by Country 2020 & 2033
- Table 25: Brazil Laminated Can Packaging Revenue (undefined) Forecast, by Application 2020 & 2033
- Table 26: Brazil Laminated Can Packaging Volume (K) Forecast, by Application 2020 & 2033
- Table 27: Argentina Laminated Can Packaging Revenue (undefined) Forecast, by Application 2020 & 2033
- Table 28: Argentina Laminated Can Packaging Volume (K) Forecast, by Application 2020 & 2033
- Table 29: Rest of South America Laminated Can Packaging Revenue (undefined) Forecast, by Application 2020 & 2033
- Table 30: Rest of South America Laminated Can Packaging Volume (K) Forecast, by Application 2020 & 2033
- Table 31: Global Laminated Can Packaging Revenue undefined Forecast, by Application 2020 & 2033
- Table 32: Global Laminated Can Packaging Volume K Forecast, by Application 2020 & 2033
- Table 33: Global Laminated Can Packaging Revenue undefined Forecast, by Type 2020 & 2033
- Table 34: Global Laminated Can Packaging Volume K Forecast, by Type 2020 & 2033
- Table 35: Global Laminated Can Packaging Revenue undefined Forecast, by Country 2020 & 2033
- Table 36: Global Laminated Can Packaging Volume K Forecast, by Country 2020 & 2033
- Table 37: United Kingdom Laminated Can Packaging Revenue (undefined) Forecast, by Application 2020 & 2033
- Table 38: United Kingdom Laminated Can Packaging Volume (K) Forecast, by Application 2020 & 2033
- Table 39: Germany Laminated Can Packaging Revenue (undefined) Forecast, by Application 2020 & 2033
- Table 40: Germany Laminated Can Packaging Volume (K) Forecast, by Application 2020 & 2033
- Table 41: France Laminated Can Packaging Revenue (undefined) Forecast, by Application 2020 & 2033
- Table 42: France Laminated Can Packaging Volume (K) Forecast, by Application 2020 & 2033
- Table 43: Italy Laminated Can Packaging Revenue (undefined) Forecast, by Application 2020 & 2033
- Table 44: Italy Laminated Can Packaging Volume (K) Forecast, by Application 2020 & 2033
- Table 45: Spain Laminated Can Packaging Revenue (undefined) Forecast, by Application 2020 & 2033
- Table 46: Spain Laminated Can Packaging Volume (K) Forecast, by Application 2020 & 2033
- Table 47: Russia Laminated Can Packaging Revenue (undefined) Forecast, by Application 2020 & 2033
- Table 48: Russia Laminated Can Packaging Volume (K) Forecast, by Application 2020 & 2033
- Table 49: Benelux Laminated Can Packaging Revenue (undefined) Forecast, by Application 2020 & 2033
- Table 50: Benelux Laminated Can Packaging Volume (K) Forecast, by Application 2020 & 2033
- Table 51: Nordics Laminated Can Packaging Revenue (undefined) Forecast, by Application 2020 & 2033
- Table 52: Nordics Laminated Can Packaging Volume (K) Forecast, by Application 2020 & 2033
- Table 53: Rest of Europe Laminated Can Packaging Revenue (undefined) Forecast, by Application 2020 & 2033
- Table 54: Rest of Europe Laminated Can Packaging Volume (K) Forecast, by Application 2020 & 2033
- Table 55: Global Laminated Can Packaging Revenue undefined Forecast, by Application 2020 & 2033
- Table 56: Global Laminated Can Packaging Volume K Forecast, by Application 2020 & 2033
- Table 57: Global Laminated Can Packaging Revenue undefined Forecast, by Type 2020 & 2033
- Table 58: Global Laminated Can Packaging Volume K Forecast, by Type 2020 & 2033
- Table 59: Global Laminated Can Packaging Revenue undefined Forecast, by Country 2020 & 2033
- Table 60: Global Laminated Can Packaging Volume K Forecast, by Country 2020 & 2033
- Table 61: Turkey Laminated Can Packaging Revenue (undefined) Forecast, by Application 2020 & 2033
- Table 62: Turkey Laminated Can Packaging Volume (K) Forecast, by Application 2020 & 2033
- Table 63: Israel Laminated Can Packaging Revenue (undefined) Forecast, by Application 2020 & 2033
- Table 64: Israel Laminated Can Packaging Volume (K) Forecast, by Application 2020 & 2033
- Table 65: GCC Laminated Can Packaging Revenue (undefined) Forecast, by Application 2020 & 2033
- Table 66: GCC Laminated Can Packaging Volume (K) Forecast, by Application 2020 & 2033
- Table 67: North Africa Laminated Can Packaging Revenue (undefined) Forecast, by Application 2020 & 2033
- Table 68: North Africa Laminated Can Packaging Volume (K) Forecast, by Application 2020 & 2033
- Table 69: South Africa Laminated Can Packaging Revenue (undefined) Forecast, by Application 2020 & 2033
- Table 70: South Africa Laminated Can Packaging Volume (K) Forecast, by Application 2020 & 2033
- Table 71: Rest of Middle East & Africa Laminated Can Packaging Revenue (undefined) Forecast, by Application 2020 & 2033
- Table 72: Rest of Middle East & Africa Laminated Can Packaging Volume (K) Forecast, by Application 2020 & 2033
- Table 73: Global Laminated Can Packaging Revenue undefined Forecast, by Application 2020 & 2033
- Table 74: Global Laminated Can Packaging Volume K Forecast, by Application 2020 & 2033
- Table 75: Global Laminated Can Packaging Revenue undefined Forecast, by Type 2020 & 2033
- Table 76: Global Laminated Can Packaging Volume K Forecast, by Type 2020 & 2033
- Table 77: Global Laminated Can Packaging Revenue undefined Forecast, by Country 2020 & 2033
- Table 78: Global Laminated Can Packaging Volume K Forecast, by Country 2020 & 2033
- Table 79: China Laminated Can Packaging Revenue (undefined) Forecast, by Application 2020 & 2033
- Table 80: China Laminated Can Packaging Volume (K) Forecast, by Application 2020 & 2033
- Table 81: India Laminated Can Packaging Revenue (undefined) Forecast, by Application 2020 & 2033
- Table 82: India Laminated Can Packaging Volume (K) Forecast, by Application 2020 & 2033
- Table 83: Japan Laminated Can Packaging Revenue (undefined) Forecast, by Application 2020 & 2033
- Table 84: Japan Laminated Can Packaging Volume (K) Forecast, by Application 2020 & 2033
- Table 85: South Korea Laminated Can Packaging Revenue (undefined) Forecast, by Application 2020 & 2033
- Table 86: South Korea Laminated Can Packaging Volume (K) Forecast, by Application 2020 & 2033
- Table 87: ASEAN Laminated Can Packaging Revenue (undefined) Forecast, by Application 2020 & 2033
- Table 88: ASEAN Laminated Can Packaging Volume (K) Forecast, by Application 2020 & 2033
- Table 89: Oceania Laminated Can Packaging Revenue (undefined) Forecast, by Application 2020 & 2033
- Table 90: Oceania Laminated Can Packaging Volume (K) Forecast, by Application 2020 & 2033
- Table 91: Rest of Asia Pacific Laminated Can Packaging Revenue (undefined) Forecast, by Application 2020 & 2033
- Table 92: Rest of Asia Pacific Laminated Can Packaging Volume (K) Forecast, by Application 2020 & 2033
Frequently Asked Questions
1. What is the projected Compound Annual Growth Rate (CAGR) of the Laminated Can Packaging?
The projected CAGR is approximately 4.05%.
2. Which companies are prominent players in the Laminated Can Packaging?
Key companies in the market include HUIYANG Packaging Factory, RMCL, DaklaPack, TCL Packaging, SUNPACK CORPORATION, OPM Group, API, Glenroy, BPI Protec, Granitol.
3. What are the main segments of the Laminated Can Packaging?
The market segments include Application, Type.
4. Can you provide details about the market size?
The market size is estimated to be USD XXX N/A as of 2022.
5. What are some drivers contributing to market growth?
N/A
6. What are the notable trends driving market growth?
N/A
7. Are there any restraints impacting market growth?
N/A
8. Can you provide examples of recent developments in the market?
N/A
9. What pricing options are available for accessing the report?
Pricing options include single-user, multi-user, and enterprise licenses priced at USD 3950.00, USD 5925.00, and USD 7900.00 respectively.
10. Is the market size provided in terms of value or volume?
The market size is provided in terms of value, measured in N/A and volume, measured in K.
11. Are there any specific market keywords associated with the report?
Yes, the market keyword associated with the report is "Laminated Can Packaging," which aids in identifying and referencing the specific market segment covered.
12. How do I determine which pricing option suits my needs best?
The pricing options vary based on user requirements and access needs. Individual users may opt for single-user licenses, while businesses requiring broader access may choose multi-user or enterprise licenses for cost-effective access to the report.
13. Are there any additional resources or data provided in the Laminated Can Packaging report?
While the report offers comprehensive insights, it's advisable to review the specific contents or supplementary materials provided to ascertain if additional resources or data are available.
14. How can I stay updated on further developments or reports in the Laminated Can Packaging?
To stay informed about further developments, trends, and reports in the Laminated Can Packaging, consider subscribing to industry newsletters, following relevant companies and organizations, or regularly checking reputable industry news sources and publications.
Methodology
Step 1 - Identification of Relevant Samples Size from Population Database


Step 2 - Approaches for Defining Global Market Size (Value, Volume* & Price*)

Note*: In applicable scenarios
Step 3 - Data Sources
Primary Research
- Web Analytics
- Survey Reports
- Research Institute
- Latest Research Reports
- Opinion Leaders
Secondary Research
- Annual Reports
- White Paper
- Latest Press Release
- Industry Association
- Paid Database
- Investor Presentations

Step 4 - Data Triangulation
Involves using different sources of information in order to increase the validity of a study
These sources are likely to be stakeholders in a program - participants, other researchers, program staff, other community members, and so on.
Then we put all data in single framework & apply various statistical tools to find out the dynamic on the market.
During the analysis stage, feedback from the stakeholder groups would be compared to determine areas of agreement as well as areas of divergence